Computerized Maintenance Management Systems (CMMS) have evolved from simple digital work order trackers into the operational backbone of Industry 4.0 maintenance strategy — yet most organizations that invest in them never build a rigorous ROI framework before or after deployment. The consequence is predictable: capital committees reject renewal budgets, maintenance managers struggle to defend their platforms against cost-cutting exercises, and the genuine financial performance of the system goes unmeasured. This guide provides the complete ROI calculation framework for CMMS investments in 2026 — the cost components, the savings categories, the formulas, the industry benchmarks, and the AI-integrated analytics capabilities that are redefining what modern maintenance management delivers to operations leaders who demand data over intuition.
Turn Maintenance Data Into Measurable ROI — One Unified Analytics Platform
iFactory AI connects IoT sensors, work order management, predictive maintenance models, and asset health tracking into a single real-time dashboard — so your maintenance team acts on data, not shift-end reports or calendar schedules.
Understanding the CMMS ROI Formula: What Goes In, What Comes Out
The fundamental ROI formula for a CMMS investment is straightforward: ROI (%) = (Net Annual Benefit ÷ Total Annual CMMS Cost) × 100. The complexity lies not in the formula itself but in accurately populating both sides of the equation. Most ROI calculations fail at the CFO level because maintenance teams undercount costs (omitting implementation, training, and integration overhead) or overstate benefits (treating productivity gains as hard savings without a measurement baseline). A credible CMMS ROI model separates hard savings — quantifiable cost reductions that appear directly on the income statement — from cost avoidance and productivity gains, assigning confidence levels to each category. Finance teams respond to this granularity because it demonstrates analytical rigor, not operational optimism.
Total CMMS investment cost across Year 1 typically breaks down across three buckets: platform subscription (30–40% of budget), implementation and data migration (25–35%), and training and process development (15–25%). For a mid-sized manufacturing facility, this commonly ranges from $40,000 to $120,000 in Year 1, falling substantially in Years 2 and 3 as implementation costs drop out. This cost profile is critical context for payback period calculations — most facilities achieve payback within 8–14 months when baseline downtime and labor costs are accurately measured before go-live.
| ROI Category | Savings Type | Typical Annual Value | Measurement Method | Confidence Level |
|---|---|---|---|---|
| Downtime Reduction | Hard Savings | $120,000–$400,000 | MTTR × downtime cost rate × incident delta | High — directly measurable |
| Labor Productivity | Productivity Gain | $40,000–$90,000 | Work orders/tech/day before vs. after CMMS | Medium — partially measurable |
| Spare Parts Inventory | Hard Savings | $30,000–$80,000 | Inventory carrying cost × reduction % | High — inventory system data |
| Emergency Repair Reduction | Hard Savings | $25,000–$70,000 | Emergency repair count × avg. cost premium | High — work order history |
| Asset Life Extension | Cost Avoidance | $50,000–$200,000 | RAV × 25% life extension × depreciation rate | Medium — actuarial model |
| Compliance & Audit Risk | Cost Avoidance | $15,000–$60,000 | Incident probability × regulatory fine schedule | Medium — risk-weighted |
Calculating the True Cost of Downtime: The Largest ROI Driver in Any CMMS Business Case
Unplanned downtime is consistently the single largest ROI driver in any CMMS business case — and the most frequently underestimated. The industry standard Siemens True Cost of Downtime framework values manufacturing downtime at an average of $260,000 per hour when production loss, labor waste, quality scrap, restart costs, and customer penalty exposure are fully counted. Most maintenance teams present only production loss in their ROI calculations, leaving 40–60% of the true downtime cost off the table. A complete downtime cost model captures six elements: direct production loss (units × margin), labor cost during stoppage, restart and quality scrap costs, emergency maintenance premium over planned rates, equipment stress and accelerated wear from unplanned stops, and customer penalty or expedite costs where applicable.
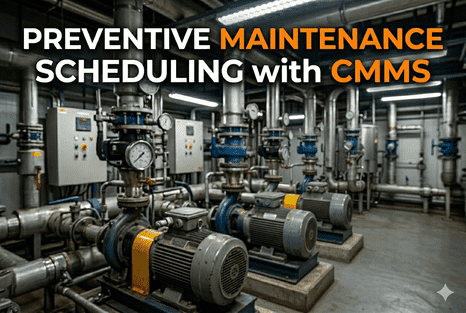
The formula for the downtime ROI contribution is: Annual Downtime Savings = (Pre-CMMS unplanned downtime hours × Hourly cost rate) × Expected reduction percentage. With CMMS-enabled preventive maintenance, facilities typically reduce unplanned downtime by 25–45% in the first year. When AI-driven predictive capabilities are layered onto the CMMS platform — integrating IoT sensor data with condition-based work order triggers — that reduction extends to 50–70% within 24 months. At a $260,000/hour downtime rate, even a single prevented two-hour failure event recovers $520,000 in production value, which alone may exceed the annual CMMS platform cost.
Preventive Maintenance Compliance and Predictive Upgrade: The ROI Multipliers
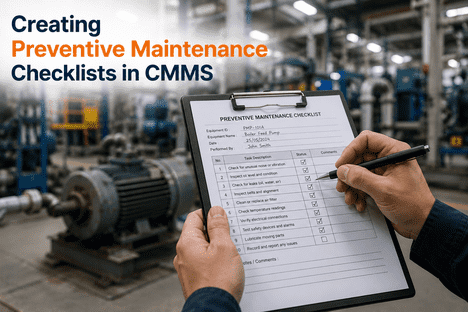
A CMMS that automates preventive maintenance scheduling delivers ROI through two mechanisms that operate in parallel. The first is compliance lift: facilities that move from manual spreadsheet-based PM scheduling (industry average: 54% compliance rate) to CMMS-automated scheduling achieve 87–91% compliance in the first quarter. Higher compliance means more assets reach their next service interval in controlled condition rather than failing in reactive emergency mode, which carries a cost premium of 3–5x planned maintenance rates. The second mechanism is labor productivity: technicians using mobile CMMS work order management complete 25–40% more work orders per shift because time previously spent on paperwork, parts lookup, and verbal communication is eliminated.
When an AI-powered predictive maintenance layer is added to the CMMS — integrating vibration, temperature, pressure, and current signature data from IoT sensors — the ROI profile shifts from incremental to transformational. AI condition-based maintenance eliminates both the over-maintenance cost of unnecessary scheduled PMs and the failure cost of under-maintenance from intervals set too conservatively. Facilities that have deployed AI-augmented CMMS platforms report 15–25% reductions in total maintenance spend alongside 30–50% reductions in unplanned downtime — the combination producing ROI ratios of 300–500% within 18–24 months. For operations leaders evaluating whether to invest in a standalone CMMS or an AI-integrated platform, the ROI differential between the two approaches makes the upgrade case mathematically clear. Book a Demo to see how iFactory's AI CMMS calculates your facility's specific ROI potential.
MRO Inventory Optimization: The Hidden ROI Category Most CMMS Evaluations Ignore
Maintenance, Repair, and Operations (MRO) inventory is one of the largest working capital consumers in any asset-intensive operation — and one of the most overlooked ROI categories in CMMS evaluations. A mid-sized manufacturing facility typically holds $500,000 to $2,000,000 in spare parts inventory, of which industry studies consistently find 20–35% is either obsolete, overstocked, or duplicated across storeroom locations. CMMS inventory management modules address this through three mechanisms: parts consumption tracking against work orders eliminates phantom inventory; reorder point automation reduces both emergency procurement premiums and excess safety stock; and cross-location visibility enables parts sharing that reduces duplicate purchasing across multi-site operations. The combined inventory ROI for a facility with $1 million in spare parts typically ranges from $60,000 to $180,000 annually — representing a carrying cost reduction of 6–18% of total inventory value.
The ROI calculation for inventory optimization requires three data inputs: current inventory value by category, annual inventory carrying cost rate (typically 20–30% of inventory value when storage, obsolescence, insurance, and capital cost are counted), and the projected reduction percentage achievable through CMMS-driven inventory discipline. A conservative 15% inventory reduction on a $1 million spare parts base at a 25% carrying rate yields $37,500 in annual hard savings — every year, compounding as inventory discipline matures. When CMMS inventory data is connected to AI-driven failure prediction models, parts procurement shifts from push (ordering on schedules) to pull (ordering when condition data indicates impending failure need), further reducing emergency buy premiums that average 35–60% above planned procurement costs.
The AI Vision and IoT Multiplier: How Connected CMMS Platforms Compound ROI Over Time
Traditional CMMS platforms manage work orders and maintenance schedules — they are record systems, not intelligence systems. The ROI step-change in 2026 comes from connecting CMMS platforms to AI analytics engines and IoT sensor networks that transform maintenance from a reactive cost center into a predictive reliability function. iFactory's AI Vision Camera platform extends this paradigm further, applying computer vision and machine learning to continuous visual asset inspection — identifying surface defects, alignment deviations, wear patterns, and process anomalies that vibration and temperature sensors alone cannot detect. When these visual intelligence streams feed directly into CMMS work order generation, the gap between fault detection and corrective action closes from days to minutes. Explore iFactory AI Vision to understand how visual AI integrates with your existing CMMS infrastructure.
Connecting vibration, temperature, pressure, and current signature sensors to your CMMS creates the condition data foundation that AI models require to move from scheduled PM to condition-triggered maintenance. iFactory integrates via OPC-UA, MQTT, and REST API with existing SCADA, PLC, and historian infrastructure — no hardware replacement required. Sensor data routes automatically to the asset record, enabling real-time health scoring and failure probability calculation across every monitored asset.
- Continuous vibration, temperature, pressure, and current signature monitoring at 500ms intervals
- Automated anomaly detection with baseline deviation alerting before failures develop
- Asset health score trending updated in real time against equipment-specific failure thresholds
- Condition-triggered PM work order generation eliminates unnecessary scheduled maintenance
- Failure prediction accuracy of 80–97% at 30–90 day advance warning windows
iFactory's AI Vision Camera applies deep learning computer vision to continuous visual inspection of equipment surfaces, process outputs, and mechanical components — capturing defect signatures that no vibration or thermal sensor can detect. Surface wear patterns, coating anomalies, misalignment signatures, and contamination events are identified in real time and converted automatically into CMMS inspection records and work orders, replacing manual visual inspection rounds that create 4–8 hour detection lags.
- Real-time surface defect detection at production line speeds with sub-second latency
- Automatic CMMS work order generation from vision-identified anomaly events
- Defect classification linked to upstream process variables for root cause attribution
- Quality hold prevention through defect-to-process correlation before coil or batch completion
- Customer documentation support — vision inspection records integrated with quality traceability reports
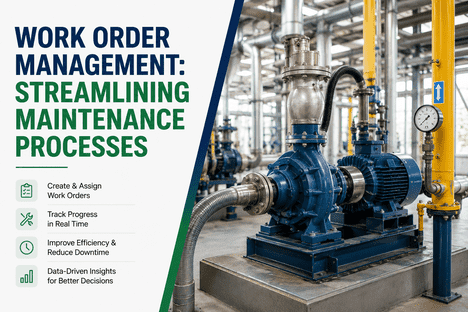
Automated work order generation — triggered by AI condition models, IoT sensor thresholds, or vision inspection events — removes the longest delay in the traditional reactive maintenance cycle: the time between fault occurrence and maintenance awareness. In facilities without automated work order triggers, the average detection-to-dispatch lag is 4–18 hours. CMMS platforms with AI-driven automation reduce this to under 8 minutes from sensor anomaly to work order assignment, which is the single largest driver of MTTR improvement in high-throughput operations.
- Sub-8-minute detection-to-work-order generation from AI condition alert to technician assignment
- Priority scoring model assigns urgency based on failure probability, production impact, and parts availability
- Mobile work order delivery to technicians with asset history, procedure documentation, and parts requirements
- Automatic parts reservation from CMMS inventory at work order creation to eliminate parts-search delays
- Post-completion data capture feeds AI failure models for continuous prediction accuracy improvement
CMMS ROI is not static — it compounds as AI models accumulate operational data, maintenance teams build PM compliance habits, and inventory management disciplines mature. The compounding mechanism is structural: every prevented failure improves the AI model's accuracy for that asset class; every completed work order adds to the parts consumption baseline that optimizes inventory levels; every PM interval validated by condition data reduces unnecessary maintenance spend. Organizations that measure and report ROI systematically achieve 300–500% returns within 18–24 months because the compounding effect produces accelerating savings in Years 2 and 3 that dwarf the initial Year 1 returns.
- Year 1: Downtime baseline established, PM compliance lifts 30–37%, emergency repair frequency drops 20–30%
- Year 2: AI predictive models mature, unplanned failures reduce 50–70%, inventory optimization delivers full savings
- Year 3: Asset life extension ROI begins to appear; deferred CapEx from extended equipment life quantifiable
- Compounding ROI: 64% of industrial organizations report positive ROI within 12 months; 300–500% by month 24
- CFO presentation: IRR calculation against company hurdle rate makes the investment mathematically decisive
Fragmented vs. Unified CMMS: The Full Financial Gap
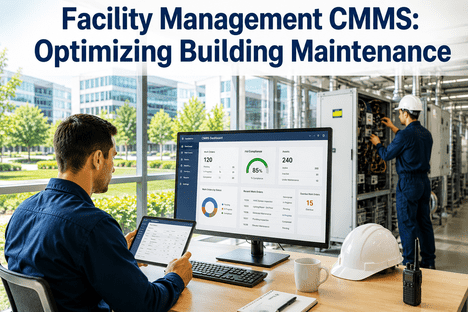
Most facilities that underperform on CMMS ROI are not running the wrong platform — they are running disconnected systems that prevent the cross-functional data integration where the largest savings originate. Maintenance data in the CMMS, asset condition data in a separate historian, inventory in an ERP module, and quality records in a standalone QMS create the same fragmentation problem that afflicts every maintenance function that relies on shift-end reports instead of real-time analytics. iFactory's unified CMMS and AI analytics architecture eliminates these gaps by connecting work order management, IoT condition monitoring, AI vision inspection, and inventory optimization into a single operational layer with per-asset traceability from sensor event to completed repair.
Replace Disconnected Maintenance Systems with One Audit-Ready, AI-Powered CMMS
iFactory connects IoT condition monitoring, AI Vision inspection, predictive maintenance work orders, and MRO inventory management into a single real-time CMMS dashboard — delivering per-asset ROI traceability from sensor event to verified repair.
Presenting CMMS ROI to Finance: The Structure That Survives CFO Scrutiny
A CMMS ROI business case that survives capital committee review requires more than a single ROI percentage — it requires the complete financial narrative that finance teams use to compare competing investments. That means presenting three financial metrics in parallel: ROI percentage (most universally understood), payback period (most operationally intuitive), and Internal Rate of Return (most capital-committee appropriate, allowing direct comparison against the organization's hurdle rate). When an IRR of 200% is set against a company hurdle rate of 15%, the investment decision becomes mathematically obvious rather than politically negotiated. Present three scenarios — conservative (150% ROI), moderate (290% ROI), and aggressive (420% ROI) — with documented assumptions for each. Finance teams approve investments when they understand the risk profile of every assumption, not just the headline number.
The most common reason CMMS ROI cases fail at the budget stage is not insufficient savings — it is insufficient baseline data. Facilities without a CMMS lack the very data needed to prove the ROI case: downtime hours, emergency repair costs, PM compliance rates, and inventory carrying costs are rarely tracked systematically before a CMMS exists. The solution is to use the CMMS evaluation period itself to capture baseline metrics, even manually, over a 30–60 day window. Industry benchmark data — $260,000/hour average manufacturing downtime cost, 54% average PM compliance without CMMS, 20–35% MRO inventory waste — provides defensible proxies where internal data is incomplete. Anchoring the business case on conservative versions of these benchmarks, then demonstrating improvement against them post-deployment, builds the compounding internal evidence base that makes Year 2 and Year 3 budget renewals automatic.
CMMS ROI Calculation — Frequently Asked Questions
CMMS ROI in 2026: The Data Exists — The Integration Decision Determines Whether You Capture It
Every asset-intensive facility generates the data needed to build a compelling CMMS ROI case — downtime events, maintenance labor hours, spare parts consumption, PM compliance records, and quality inspection results stream continuously from equipment and systems across every production shift. The ROI gap exists not because the savings are unavailable but because that data lives in disconnected systems that cannot be assembled into a coherent financial narrative at the speed capital budgeting decisions require. A unified CMMS and AI analytics platform closes this gap by connecting condition monitoring, work order management, inventory optimization, and quality traceability into a single operational layer that makes the ROI calculation automatic, continuous, and CFO-ready.
For operations and maintenance leaders building the 2026 business case for CMMS investment or platform expansion, the framework is clear: document your baseline, separate your savings categories by confidence level, present three ROI scenarios with IRR benchmarked against your capital hurdle rate, and connect your CMMS to AI condition monitoring and vision inspection to access the compounding returns that transform a 150% Year 1 ROI into a 400% cumulative return by month 24. The facilities achieving those numbers are not outliers — they are the ones that treated the CMMS ROI calculation as a continuous measurement discipline rather than a one-time budget justification exercise.
Build a Unified, ROI-Ready CMMS Operation with iFactory AI
iFactory connects every maintenance data stream — IoT condition monitoring, AI Vision inspection, predictive work orders, MRO inventory, and compliance documentation — into a single real-time CMMS dashboard that delivers per-asset ROI traceability and finance-ready reporting on demand.