Setting Up Dashboards and Reports in CMMS

By Austin on June 3, 2026

setting-up-dashboards-and-reports-in-cmms

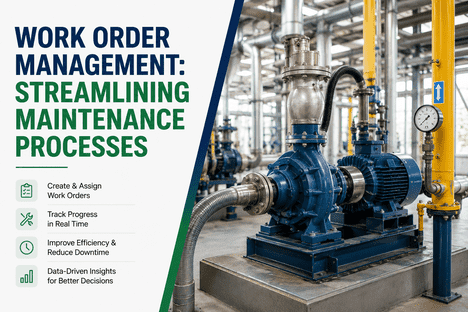
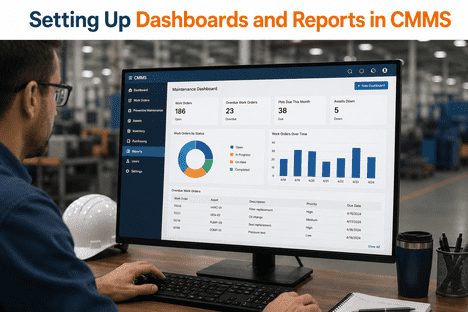
Setting up dashboards and reports in a CMMS is the operational step that separates a maintenance software deployment from a genuine reliability transformation. A CMMS loaded with work orders, asset records, and IoT sensor readings is a database. A CMMS with correctly configured dashboards and automated reports is a real-time operational intelligence layer that tells every member of the maintenance organization — from floor technician to plant director — exactly what is happening, what needs to happen next, and where the highest-consequence risks are accumulating right now. In 2026, the standard for CMMS dashboards has moved well beyond static charts and monthly PDF exports. AI-powered platforms like iFactory now deliver live predictive maintenance dashboards driven by IoT sensor data, real-time OEE tracking across all processing units, AI Vision anomaly feeds connected directly to work order queues, and automated ESG compliance reports generated without manual data consolidation — all from a single unified interface that connects to existing SCADA, DCS, and historian infrastructure without hardware replacement. This guide covers every dimension of setting up CMMS dashboards and reports for maximum operational value: which KPIs to track at each organizational level, how to structure role-based dashboard views, how to connect IoT and AI data sources to reporting layers, and how to configure automated report distribution that closes the loop between maintenance intelligence and operational decision-making. Book a Demo to see iFactory's AI-powered dashboard and reporting layer running live on real industrial asset data from your sector.

500+
Industrial facilities globally running iFactory AI dashboards on existing CMMS and OT infrastructure
94%+
AI failure prediction accuracy surfaced directly in predictive maintenance dashboard views
4 Weeks
From OT infrastructure connection to live AI dashboards, reports, and compliance automation
Zero
Manual data consolidation required for ESG, OEE, and compliance reports — fully automated

Ready to configure AI-powered CMMS dashboards and automated reports for your facility? Book a Demo with iFactory's operations team for a site-specific dashboard configuration review.

iFactory CMMS Dashboards — AI Predictive Intelligence, IoT Analytics, OEE Tracking, and Automated ESG Reporting in One Unified Interface
iFactory connects to your existing SCADA, DCS, and historian infrastructure via OPC-UA, MQTT, and REST APIs and surfaces AI-driven predictive maintenance alerts, real-time OEE analytics, digital twin visualizations, and automated compliance reports — all in a single dashboard layer your operations team can configure, role-assign, and distribute without IT involvement.

Why CMMS Dashboard and Report Configuration Determines Operational Outcomes

Most CMMS implementations fail to deliver their promised operational returns not because the underlying data is unavailable — but because it is never configured into dashboards and reports that make it visible to the people who can act on it. Engineers spend 40 to 60 percent of their shift gathering data from disconnected systems rather than acting on it. Maintenance managers review unplanned downtime numbers in a monthly PDF rather than a live dashboard that would have allowed intervention three weeks earlier. Plant directors make capital decisions based on quarterly reports compiled from spreadsheets rather than live asset health scores updated by IoT sensor data every fifteen minutes. The configuration gap between data collected and data acted upon is where most of the operational value of a CMMS investment disappears. iFactory's dashboard architecture closes this gap by connecting every data source — IoT sensors, AI predictive models, computer vision anomaly detection, CMMS work order records, OEE analytics, and ESG emissions monitoring — into a unified real-time intelligence layer with role-based views configured for each operational audience.

The Cost of Underconfigured CMMS Dashboards
Facilities with underconfigured CMMS dashboards experience the same reactive maintenance cycle regardless of the sophistication of their underlying platform. Predictive alerts that are not surfaced in a real-time dashboard become email notifications that get missed. PM compliance rates that are not tracked on a live dashboard drift below 60 percent before a manager notices. Asset health trends that are not visualized produce emergency shutdowns that were visible in sensor data for three weeks. Dashboard configuration is not a UI preference — it is the operational mechanism that converts data into decisions.
The Operational Value of Correctly Configured Reporting
Organizations that configure role-appropriate CMMS dashboards and automate report distribution to the right stakeholders at the right frequency report maintenance cost reductions of 20 to 30 percent, PM compliance rates above 85 percent, and unplanned downtime reductions of 30 to 50 percent. The mechanism is direct: when the maintenance manager's dashboard surfaces an overdue PM on a high-criticality compressor in real time rather than in a weekly PDF, the intervention happens. When the plant director's dashboard shows asset health trending downward on two process units simultaneously, the capital decision is made before a shutdown becomes unavoidable.
AI and IoT Elevate CMMS Dashboards Beyond Historical Reporting
The 2026 standard for CMMS dashboards is not historical reporting — it is live predictive intelligence. AI models trained on 500,000 hours of industrial equipment sensor data identify failure precursors 3 to 4 weeks ahead of mechanical failure. IoT sensors stream vibration, temperature, pressure, and current data continuously. Computer vision anomaly detection flags visual defects on pipeline and processing equipment in hours, not weeks. When these data sources are configured into CMMS dashboard views, the operational team sees the future of their asset fleet — not just its recent past.
Automated Reports Eliminate the Manual Data Consolidation Tax
Manual report compilation from CMMS, SCADA, historian, and spreadsheet sources consumes significant engineering and planner labor every reporting cycle. Automated CMMS report generation — pulling live data from connected systems and distributing formatted reports to defined stakeholder lists on configured schedules — eliminates this labor overhead entirely. iFactory's reporting module auto-generates EPA GHG compliance reports, ISO 50001 EnPI dashboards, OEE summaries, work order performance analytics, and asset health trend reports without a single manual data aggregation step.

Dashboards and Reports Supported by iFactory — Platform Capabilities at a Glance

iFactory's dashboard and reporting architecture covers every operational, reliability, compliance, and financial view a maintenance organization requires — connected to live IoT sensor data, AI predictive model outputs, computer vision anomaly feeds, and CMMS work order records in a unified platform. The table below maps each dashboard and report type to its data source, update frequency, and primary audience.

Dashboard / Report Type Primary Data Source Update Frequency Primary Audience
Predictive Maintenance Dashboard AI ML model outputs, IoT sensor streams, CMMS asset records Real-time, sub-minute alert latency Reliability engineers, maintenance planners
OEE Analytics Dashboard SCADA production data, IoT sensor readings, work order downtime records Real-time, per-shift summaries Operations managers, plant directors
Work Order Performance Report CMMS work order records, technician time logs, parts consumption Daily auto-generated, weekly distribution Maintenance managers, department heads
AI Vision Anomaly Feed Computer vision model outputs, camera infrastructure, asset records Continuous, alert on detection Reliability engineers, inspection teams
Digital Twin Asset Health View Physics-accurate digital twin model, live sensor synchronization Real-time continuous Reliability engineers, operations leads
Pipeline Integrity Dashboard IIoT pressure/flow sensors, AI integrity model, SCADA historian Real-time, 7–14 day advance warning Pipeline engineers, HSE managers
ESG and Emissions Compliance Report IIoT methane/VOC sensor network, SCADA historian, emissions model Continuous tracking, auto-generated at period close Compliance leads, ESG officers, regulators
Workforce and Certification Dashboard CMMS workforce analytics module, competency records, work order assignments Real-time at assignment, daily summary HSE managers, maintenance supervisors

How to Set Up CMMS Dashboards Correctly: A Phase-by-Phase Configuration Guide

CMMS dashboard configuration that delivers operational value follows a structured sequence — from defining stakeholder KPI requirements through connecting data sources, building role-based views, setting threshold alerts, and configuring automated report distribution. Each phase builds on validated outputs from the previous one. Skipping the KPI definition phase and building dashboards from available data fields produces dashboards that display information nobody acts on. Configuring alerts before AI baselines are established produces false positive rates that erode trust within weeks. The sequence below reflects the configuration approach iFactory uses across 500+ industrial facility deployments. Book a Demo to walk through iFactory's dashboard configuration framework for your specific operational context.

01
Define KPIs by Stakeholder Audience Before Building Any Dashboard
The most common dashboard configuration failure is building views around available data fields rather than stakeholder operational needs. Before configuring a single dashboard widget, define the specific KPIs each audience needs to act on: floor technicians need open work orders, overdue PMs, and asset condition alerts relevant to their assigned equipment. Maintenance managers need PM compliance rates, MTTR, MTBF, work order backlog, and cost per asset. Plant directors need OEE by processing unit, unplanned downtime cost, predictive maintenance ROI, and budget variance. Compliance leads need emissions intensity, ISO 50001 EnPI performance, and ESG reporting coverage. Agree on the mathematical definition of each KPI before any configuration begins — disagreements about whether MTTR includes diagnostic time or only repair time corrupt months of comparative reporting after go-live.
02
Connect IoT Sensor Data, AI Model Outputs, and SCADA Historian Sources
Dashboard intelligence is determined by data source quality. iFactory connects to existing SCADA systems, DCS historians, PLCs, and IoT sensor networks via OPC-UA, MQTT, and REST APIs — ingesting vibration, temperature, pressure, current, flow, and emissions data from existing operational technology without hardware replacement. AI Vision camera feeds connect via standard camera infrastructure protocols. Digital twin models synchronize in real time with live sensor data. The result is a unified data pipeline that feeds every dashboard view with the same source of truth — eliminating the data reconciliation conflicts that emerge when dashboard metrics pull from different system extracts at different timestamps.
03
Build Role-Based Dashboard Views for Each Operational Audience
A single dashboard view visible to all users serves no operational audience well. Technicians overwhelmed by executive financial KPIs stop checking the dashboard. Plant directors presented with work order queue details cannot see the fleet-level patterns that inform capital decisions. iFactory's role-based dashboard architecture delivers tailored views to each audience — technician mobile views with assigned work orders and asset condition alerts, maintenance manager views with PM compliance rates and backlog trends, plant director views with OEE performance and predictive maintenance ROI, and compliance officer views with emissions monitoring and regulatory reporting status — all drawing from the same connected data layer with user-appropriate presentation and access control.
04
Configure AI Predictive Alert Thresholds After Baseline Establishment
Predictive alert thresholds on CMMS dashboards should be configured after the AI model has established asset-specific sensor baselines — not before. Alert thresholds set against generic industry benchmarks before facility-specific baselines are established produce false positive rates above 20 percent, destroying technician trust in the dashboard alert system within weeks. iFactory's ML models establish unique energy and condition fingerprints for each monitored asset during the first 7 to 30 days of live sensor monitoring. Alert thresholds are validated with the reliability engineering team before autonomous alerts appear on dashboards, ensuring the first predictive notifications technicians see are actionable with a confirmed false alert rate below 3 percent.
05
Configure Automated Report Schedules and Stakeholder Distribution Lists
The operational value of CMMS reporting is realized when reports reach the right stakeholders automatically at the right frequency — not when someone manually compiles and distributes them. Configure daily work order performance summaries to maintenance managers, weekly PM compliance and MTBF trend reports to reliability engineers, monthly OEE analytics and maintenance cost reports to plant directors, and quarterly ESG compliance reports to regulatory and sustainability teams. iFactory's automated report distribution engine generates all these reports from live connected data and delivers them to defined distribution lists on configured schedules — with zero manual data aggregation required at any reporting cycle.
06
Establish Dashboard Review Cadences and KPI Target Governance
Dashboard configuration is not a one-time setup exercise — it is an operational discipline that requires scheduled review cadences and defined ownership for each KPI target. Establish weekly operational dashboard reviews with maintenance managers, monthly KPI performance reviews with plant leadership, and quarterly dashboard configuration audits where KPI definitions, alert thresholds, and report distribution lists are validated against current operational priorities. iFactory's continuous model retraining and integration health monitoring ensures the underlying data quality that dashboard accuracy depends on — while the governance cadence ensures the human decision-making layer keeps pace with platform capability.

Core KPIs Every CMMS Dashboard Should Track — and How iFactory Calculates Each

The following KPI definitions reflect the maintenance performance metrics that industrial operations teams and plant directors rely on most in 2026 — each calculated automatically by iFactory from connected work order, IoT sensor, and asset record data without manual spreadsheet compilation.

KPI Definition iFactory Calculation Method Target Benchmark
MTBF Mean Time Between Failures — average operating time between unplanned failure events on a given asset Calculated from work order failure timestamps and asset runtime hours from IoT sensor data — no manual input Asset-class specific; improving trend is the primary target
MTTR Mean Time to Repair — average time from failure detection to return to service Calculated from AI anomaly alert timestamp to work order closure timestamp — including diagnostic and repair phases Below industry median for asset class; declining trend confirms improvement
PM Compliance Rate Percentage of scheduled preventive maintenance tasks completed on time Calculated from scheduled PM due dates versus work order closure timestamps — displayed in real time on maintenance manager dashboard Above 85%; below 70% triggers automated alert to maintenance manager
OEE Overall Equipment Effectiveness — product of Availability × Performance × Quality across processing units Calculated from SCADA production data and CMMS downtime records in real time — displayed per unit and fleet-wide Above 85% world-class; iFactory deployments target 12–18 percentage point improvement
Unplanned Downtime % Percentage of total scheduled operating time lost to unplanned failure events Calculated from IoT-confirmed failure events and CMMS work order downtime records — benchmarked against pre-deployment baseline Below 5%; iFactory deployments target 30–50% reduction from baseline
Work Order Backlog Number of open work orders past their target completion date Real-time count from CMMS work order records — displayed with age segmentation and criticality classification on manager dashboard Below 2 weeks of planned maintenance capacity; automated alert when threshold is exceeded
Predictive Alert Conversion Rate Percentage of AI predictive alerts that result in a confirmed maintenance finding upon inspection Tracked from alert generation through work order closure with inspection outcome recorded — used to refine AI model thresholds Above 85%; below this triggers model threshold review with reliability team

iFactory AI Vision Dashboard — Computer Vision Anomaly Detection Connected Directly to CMMS Reporting

One of the most operationally distinctive dashboard capabilities in iFactory is the AI Vision monitoring view — where computer vision anomaly detection feeds directly into the CMMS reporting layer, generating visual findings, work order triggers, and asset record entries without manual inspection review. AI Vision monitoring applied to pipeline infrastructure, wellhead equipment, rotating machinery, and processing units detects leaks, corrosion, mechanical misalignment, and surface defects in hours rather than weeks. These findings appear in the maintenance manager's dashboard as prioritized work order alerts with AI-generated visual evidence attached — the same pipeline that sensor-derived predictive alerts follow, but sourced from continuous camera feed analysis rather than parameter monitoring. The integration between AI Vision detection and CMMS dashboard reporting means visual anomalies found at 2am on a remote pipeline segment become a work order in the maintenance manager's morning dashboard view with the visual evidence, asset location, and recommended action pre-populated.

Hours
Leak Detection Speed With AI Vision
Computer vision anomaly detection on pipeline and processing equipment surfaces leak precursors in hours compared to weeks under manual inspection cycles — with findings appearing directly on the CMMS maintenance dashboard.
−28%
Pipeline Leak Response Time
Midstream operators connecting iFactory's AI Vision module and pipeline integrity dashboard report 28 percent reductions in leak response time and 35 percent reductions in false alarm rates across monitored networks.
Auto
Work Order Generation From Visual Findings
Every AI Vision anomaly finding above the configured confidence threshold automatically generates a CMMS work order with the visual evidence, asset ID, location, and recommended action attached — no manual review of camera footage required.
24/7
Continuous Asset Monitoring Coverage
AI Vision monitoring replaces periodic manual inspection rounds with continuous 24/7 camera analysis — expanding inspection coverage without increasing inspection labor and delivering anomaly detection that does not degrade between scheduled rounds.
One
Unified Dashboard View
AI Vision anomaly alerts, IoT sensor-derived predictive alerts, and CMMS work order records appear in the same maintenance dashboard view — giving reliability engineers complete asset context from both visual and parameter monitoring in one interface.
Audit
Visual Evidence in Compliance Records
AI Vision findings are automatically archived to the CMMS asset record with timestamp, detection confidence, and work order reference — producing a visual inspection audit trail that satisfies API 570, OSHA PSM, and HSE compliance requirements without manual documentation.

Automated ESG and Compliance Reporting — Zero Manual Consolidation From CMMS Dashboard to Regulatory Submission

ESG and emissions compliance reporting is one of the highest-labor, highest-risk reporting obligations in industrial operations — and one that iFactory's CMMS reporting layer eliminates entirely as a manual process. iFactory aggregates methane, VOC, and flaring data from IIoT sensor networks across all operational segments and auto-generates EPA Methane Emissions reports, EPA GHG Reporting Rule submissions, ISO 50001 EnPI dashboards, and state-level compliance reports. The compliance dashboard in iFactory shows real-time emissions intensity versus regulatory targets, compliance coverage across all monitored assets, and report generation status — giving compliance officers a live view of their regulatory posture rather than a quarterly scramble to compile data from multiple disconnected systems. Reports are audit-ready the moment the reporting period closes.

Compliance Reports iFactory Auto-Generates From Connected CMMS and IIoT Data
EPA GHG Reporting Rule — Scope 1 and 2 emissions inventory from live IIoT sensor aggregation, generated at reporting period close without manual data entry
EPA Methane Emissions Report — methane detection, VOC monitoring, and flaring data aggregated from sensor network with auto-generated regulatory submission format
ISO 50001 EnPI Dashboard — real-time Energy Performance Indicator tracking against targets with automated audit trail generation for certification review
State-Level Environmental Compliance Reports — jurisdiction-specific emissions and permit reporting generated from the same connected IIoT data layer used for EPA submissions
OSHA PSM Mechanical Integrity Records — AI-generated inspection recommendations and findings captured in immutable CMMS records with timestamp and professional attribution for audit access
HSE Work Order Audit Trail — complete timestamped record of all work order completions, safety-critical task certifications, and inspection outcomes auto-formatted for HSE compliance review
OEE Performance Summary Report — weekly and monthly OEE analytics by processing unit and asset class, benchmarked against facility-specific and industry baselines
Asset Lifecycle and Cost Report — maintenance cost per asset, replacement forecasting, and lifecycle trend analysis auto-generated from CMMS work order and parts consumption records
Zero
Manual data consolidation steps in iFactory's automated compliance report generation pipeline
Always
Audit-ready compliance documentation — reports generated continuously, not retroactively compiled
One
Connected data layer serving all dashboard types — ESG, OEE, predictive maintenance, and workforce analytics

Expert Perspective: What Makes CMMS Dashboards Operationally Effective vs. Visually Impressive

The dashboards that actually change operational outcomes are not the ones with the most widgets or the most colorful data visualization — they are the ones that tell the right person the right thing at the moment they can still act on it. A predictive maintenance alert that surfaces on a reliability engineer's dashboard three weeks before a compressor bearing failure is worth more than an entire library of historical charts. The configuration work is in defining which KPIs each audience acts on, connecting those KPIs to live IoT and AI data sources, and validating that the alert thresholds produce actionable signals rather than noise. iFactory's architecture gets this right because the AI layer — trained on 500,000 hours of industrial equipment data — produces a false alert rate below 3 percent. When technicians trust the alerts on their dashboard, they act on them. That is the entire value chain.
Senior Reliability Engineer
Downstream Processing Facility, U.S. Gulf Coast
For plant directors, the dashboard question is always the same: can I see the full production and reliability picture for my facility in one place without calling three engineers and waiting for a spreadsheet? iFactory's OEE dashboard gives me availability, performance, and quality across all processing units in real time, benchmarked against our own historical baseline and industry targets. When two units start trending in the wrong direction simultaneously, I can see it on Monday morning rather than in a Friday report. The predictive maintenance ROI tracking is also something that no previous system gave us — live visibility into how much planned intervention cost versus what the avoided emergency shutdown cost would have been. That data changed how we justify the reliability investment at the board level.
Plant Operations Director
Midstream Gas Processing, Alberta, Canada

Conclusion: The Dashboard Is Where CMMS Intelligence Becomes Operational Action

Setting up dashboards and reports in a CMMS correctly is the configuration step that determines whether the platform delivers its operational promise or remains a sophisticated database that nobody checks. The phases covered in this guide — defining KPIs by stakeholder audience before building any view, connecting IoT and AI data sources to the dashboard layer, building role-based views that surface the right intelligence to the right person, configuring AI alert thresholds after baseline establishment, and automating report distribution to close the loop between data and decision — represent the configuration architecture that separates the 20 to 40 percent of CMMS deployments that deliver measurable ROI from those that stall at partial adoption. iFactory delivers this dashboard architecture as a unified platform — connecting AI predictive maintenance intelligence, AI Vision anomaly detection, real-time OEE analytics, digital twin visualization, and automated ESG compliance reporting into a single interface that goes live in four weeks against existing SCADA, DCS, and historian infrastructure. Reliability teams, maintenance managers, and operations leaders ready to configure operational dashboards that drive measurable outcomes are encouraged to Book a Demo with iFactory and receive a facility-specific dashboard configuration review mapped to their operational requirements and KPI priorities.

Frequently Asked Questions

The core maintenance KPIs are MTBF, MTTR, PM Compliance Rate, OEE, Unplanned Downtime Percentage, Work Order Backlog, and Predictive Alert Conversion Rate. For AI-powered CMMS platforms like iFactory, these are calculated automatically from connected IoT sensor data and CMMS work order records — no manual spreadsheet compilation required. The specific KPI set should be defined by stakeholder audience before any dashboard is configured.
iFactory connects to existing SCADA, DCS, PLC, and historian infrastructure via OPC-UA, MQTT, and REST APIs — ingesting vibration, temperature, pressure, current, flow, and emissions sensor data from existing operational technology without hardware replacement. This sensor data feeds the AI predictive model layer, OEE analytics module, and digital twin simulation — all of which surface their outputs in real-time dashboard views accessible to role-appropriate operational audiences.
Yes — iFactory aggregates methane, VOC, and flaring data from IIoT sensor networks and auto-generates EPA GHG, EPA Methane Emissions, ISO 50001 EnPI, and state-level compliance reports with zero manual data consolidation. Reports are generated continuously and are audit-ready the moment each reporting period closes — eliminating the labor overhead and audit exposure of manual compliance data aggregation.
iFactory's AI Vision module applies computer vision to existing camera infrastructure on pipeline systems, wellhead equipment, and processing units — detecting leaks, corrosion, and mechanical anomalies in hours rather than weeks. Visual findings above the configured confidence threshold automatically generate CMMS work orders and appear on the maintenance manager's dashboard with visual evidence, asset location, and recommended action attached, without manual camera footage review.
Alert thresholds configured against generic industry benchmarks before facility-specific sensor baselines are established produce false positive rates above 20 percent, eroding technician trust in dashboard alerts within weeks. iFactory's ML models establish unique condition fingerprints for each monitored asset during the first 7 to 30 days of live sensor monitoring. Thresholds validated against these facility-specific baselines — with the reliability team confirming accuracy before autonomous alerts activate — produce a false alert rate below 3 percent from the first day technicians see dashboard notifications.
Configure AI-Powered CMMS Dashboards and Automated Reports — Live in 4 Weeks on Your Existing Infrastructure
iFactory connects to your existing SCADA, DCS, historian, and IoT infrastructure and delivers real-time predictive maintenance dashboards, AI Vision anomaly feeds, OEE analytics, digital twin visualization, and automated ESG compliance reporting in a single unified interface — with role-based views for every operational audience and zero manual data consolidation at any reporting cycle.
Role-Based Dashboard Views
AI Predictive Alerts Live
Automated ESG Reporting
OEE Analytics Real-Time
500+ Facilities Globally

Share This Story, Choose Your Platform!