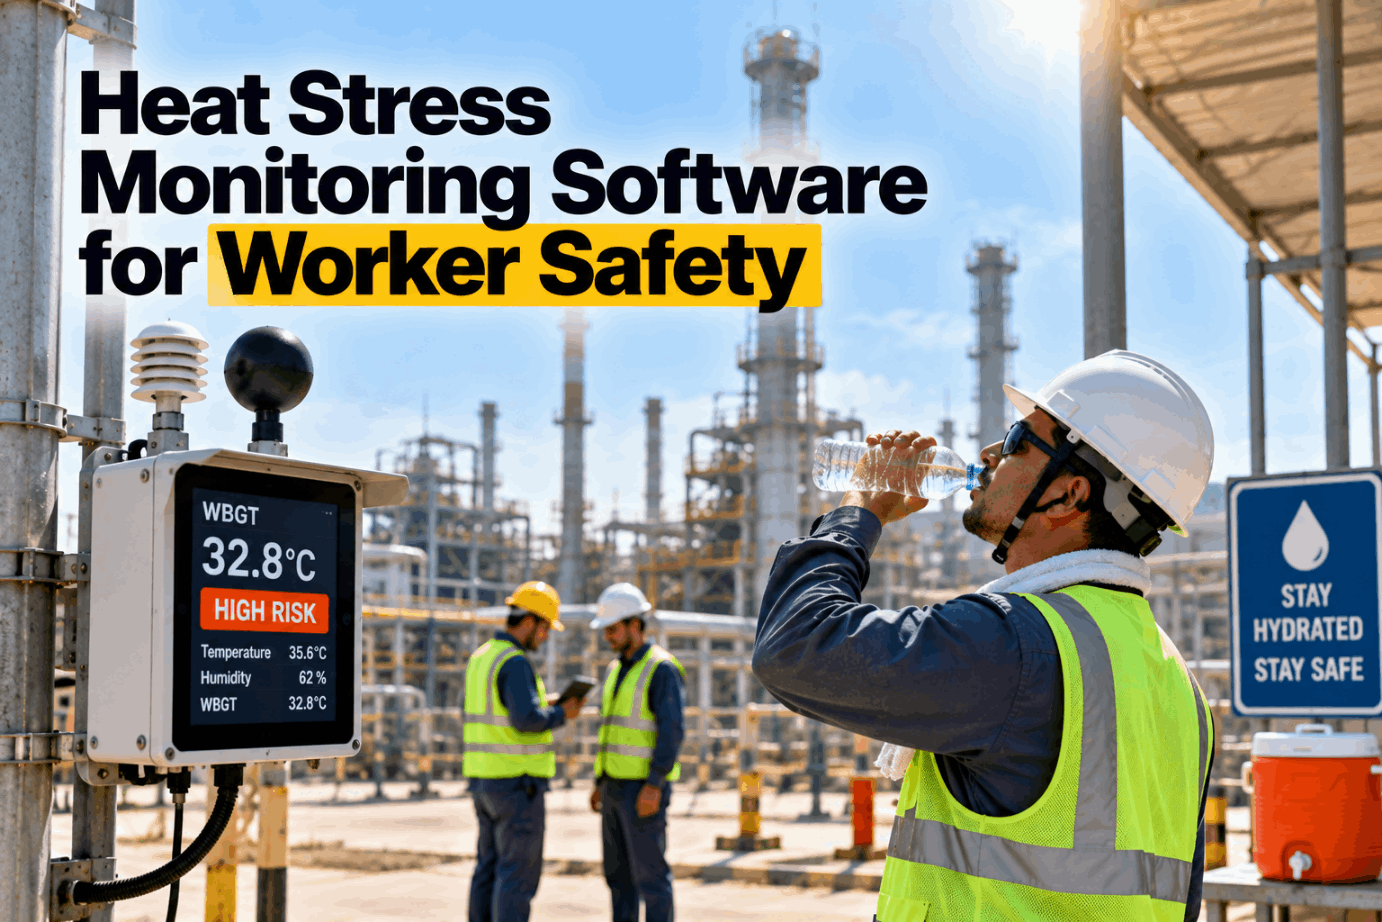
Heat illness is predictable, and that is what makes it preventable. The conditions that cause it can be measured: temperature, humidity, radiant heat, workload and whether a worker is used to the heat. Yet most plants still manage heat with a wall thermometer and a supervisor’s judgment, and act only when someone feels unwell. Federal OSHA has proposed a heat standard with specific triggers at a heat index of 80 and 90 degrees Fahrenheit, several states already enforce their own rules, and OSHA’s heat emphasis program was renewed in 2026 for five more years. Heat stress monitoring software turns a written heat plan into daily action by measuring conditions in each area, alerting when triggers are crossed and recording the breaks, water and acclimatization that follow. This guide covers the rules, the measurements, acclimatization and how to run a heat plan. To see heat monitoring in use, book a short walkthrough.
Heat Stress Monitoring Software for Worker Safety: Measure, Alert and Act Before Heat Illness
Heat index and WBGT tracked in every hot area, with alerts at each trigger and records of breaks, water and acclimatization, so the heat plan runs every day and not just on paper.
Why Heat Illness Keeps Happening in Workplaces
The Bureau of Labor Statistics recorded 48 worker deaths from environmental heat in 2024 and an average of 42 a year from 2011 to 2024. OSHA’s rulemaking background cites 479 heat deaths from 2011 to 2022 and 33,890 heat injuries and illnesses involving days away from work from 2011 to 2020, and says these figures are likely vast underestimates because heat is often not recorded as the cause.
Heat illness develops over hours, and the early signs, such as fatigue, cramps and confusion, are easy to miss on a busy shift. New and returning workers are at greatest risk because their bodies have not yet adapted. By the time someone collapses, the opportunity to prevent it has usually been there since mid-morning.
Indoor workplaces are part of the problem. Foundries, heat treatment, glass, bakeries, laundries, warehouses and loading docks can be hotter than outdoors and have radiant heat that a simple thermometer does not capture.
Measuring heat where people work is the first step. We can review your heat plan on a call.
Where OSHA’s Heat Rule Stands
As of October 2026 there is no final federal heat standard, but the direction is clear and enforcement is active.
OSHA published its proposed rule on heat injury and illness prevention in outdoor and indoor work settings on 30 August 2024.
An informal public hearing ran from 16 June to 2 July 2025; post-hearing comments closed on 30 October 2025.
OSHA renewed its heat National Emphasis Program for five years, to April 2031, targeting 55 industries.
Reports on the 2026 program say OSHA will conduct inspections on days with National Weather Service heat advisories or warnings.
An OSHA official said a supplemental proposed rule is expected in the coming months, with a new comment period.
OSHA can still cite heat hazards under existing authority, and state rules apply where they exist.
For employers, the practical message is to build a plan around the proposed triggers and the strictest state rule that applies, and to be able to show it works. A rule that changes in detail will still be built on the same elements.
Our specialists track the rulemaking and can map your plan to it.
What the Proposed Federal Rule Would Require
OSHA’s fact sheet and legal summaries of the 2024 proposal describe these main elements. Details may change in the supplemental proposal.
The proposal also calls for warning signs in indoor areas above 120 °F, training for workers and supervisors, and identification of indoor work areas where heat reaches the initial trigger.
Each element maps to something a monitoring system can measure or record. See the mapping in a demo.
State Heat Rules Already in Force
Several states enforce their own heat rules now. Multi-state employers need to meet the rule in each state.
| State | Scope | Key triggers | In effect since |
|---|---|---|---|
| California | Indoor | 82 °F, with more controls at 87 °F | 23 July 2024 |
| California | Outdoor | 80 °F for shade and water; 95 °F high-heat procedures | Earlier rule |
| Maryland | Indoor and outdoor | Heat index 80 °F; high-heat measures at 90 °F | 30 September 2024 |
| Oregon | Indoor and outdoor | Heat index 80 °F and 90 °F | 2022 |
| Washington | Outdoor | 80 °F; breaks every 2 hours at 90 °F, hourly at 100 °F | 17 July 2023 |
| Nevada | Indoor and outdoor | Written program for employers with 10 or more employees | November 2024 |
| Minnesota | Indoor | WBGT limits by workload | Long-standing rule |
The triggers differ in number and in measurement. Some use air temperature, some heat index and Minnesota uses wet bulb globe temperature. A monitoring system should calculate all three so one site set-up can serve any state.
Applying the right rule by site location is built into every rollout.
Heat Index, WBGT and What to Measure
Two measures dominate heat rules. They are not interchangeable.
- Combines air temperature and humidity
- Familiar from weather forecasts
- Calculated from simple sensors
- Assumes shade and light wind
- Does not capture radiant heat
- Used by most proposed and state triggers
- Combines humidity, radiant heat, air temperature and air movement
- Outdoors: 0.7 natural wet bulb + 0.2 globe + 0.1 dry bulb
- Indoors: 0.7 natural wet bulb + 0.3 globe
- Captures furnaces, ovens and sun
- Compared with NIOSH limits by workload
- Preferred by NIOSH and ACGIH
Illustrative. The globe reading shows the radiant heat a wall thermometer misses; limits depend on workload and acclimatization.
NIOSH sets two limits against WBGT: the Recommended Alert Limit for workers who are not acclimatized and the Recommended Exposure Limit for those who are. Both fall as the work gets heavier, so the same WBGT can be acceptable for light work and unsafe for heavy work.
Measuring both heat index and WBGT in each hot area gives a complete picture. Ask our team which sensors suit your site.
Acclimatization for New and Returning Workers
The body adapts to heat over about a week of gradual exposure. Workers who have not adapted are at much higher risk, which is why every heat rule includes acclimatization.
| Day | New workers, share of full exposure | Returning experienced workers |
|---|---|---|
| Day 1 | No more than 20% | 50% |
| Day 2 | No more than 40% | 60% |
| Day 3 | No more than 60% | 80% |
| Day 4 | No more than 80% | 100% |
| Day 5 | 100% | 100% |
This schedule follows NIOSH recommendations: no more than 20% of usual exposure on the first day for new workers, increasing by no more than 20% each day; experienced workers returning after an absence follow a faster schedule.
Acclimatization is the element most often missed, because nobody tracks who is on which day. A system that knows start dates and absences can flag those workers automatically and tell supervisors what exposure they should have today.
Linking acclimatization to HR start and absence records makes it automatic. Our engineers set up that link.
What to Monitor and How
A monitoring set-up combines several sources.
Fixed instruments in hot areas measuring wet bulb, globe and air temperature.
Lower-cost sensors for heat index across large areas such as warehouses.
Forecast heat index for outdoor work and planning the next day.
Furnace, oven and dryer status that drives local heat.
Heavier work and protective clothing lower the safe limit.
Physiological monitors can help, but reviews find accuracy varies and evidence of real-time prediction is limited.
Wearable monitors are promising for high-risk tasks. Research reviews caution, however, that estimates of core temperature from heart rate can be inaccurate in some cases and that a single measure of heat strain may not be enough. Area monitoring with clear triggers remains the foundation.
Start with area monitoring and add wearables where the risk justifies it. Discuss options with our advisors.
Turning Heat Readings Into Action
Measurement only helps if it leads to the right action at the right time.
Heat index and WBGT calculated for each area every few minutes.
Readings checked against the trigger that applies to that site and workload.
Supervisors notified when a trigger is crossed or forecast to be crossed.
Water, breaks, shade or cooling, work-rest changes and observation started.
Breaks taken, water provided and actions logged against the area and shift.
Hours above triggers and actions taken reviewed weekly.
- One reading for a large area
- Action when someone feels unwell
- Same rules for new and experienced workers
- Breaks unrecorded
- No forecast of the afternoon
- Nothing to show an inspector
- Readings in every hot area
- Action at defined triggers
- Acclimatization tracked per worker
- Breaks and water recorded
- Alerts before triggers are crossed
- Records kept for inspections
See alerts and records for a sample hot area in a session.
Heat Safety Plan Checklist
Use this checklist to test a heat safety plan.
Most plans have the document and lack the daily records. A heat review shows the gaps.
What Heat Monitoring Is Worth
Value comes from people protected and work that continues safely.
Heat also affects quality and error rates long before anyone is ill. Sites that manage heat deliberately often find they recover output on the hottest days by moving heavy tasks to cooler hours.
A summer of your temperature data usually shows how many hours crossed the triggers. We can analyze it in a working session.
How iFactory Delivers Heat and Environmental Exposure Monitoring
Heat index and WBGT for every hot area.
Federal proposal and state rules applied by location.
Warnings before a trigger is crossed.
New and returning workers flagged with today’s exposure.
Breaks, water and observations logged.
Hours above triggers and actions by area.
It runs on premises with your sensors and HR records. Share your hot areas and we will design the monitoring in a pilot.
See How Many Hours Your Hot Areas Spend Above the Triggers
Share temperature and humidity data for your hot areas. We calculate heat index and WBGT, count hours above each trigger and show what your plan would need to do.
Heat index is 88 °F and rising, forecast to pass 90 °F by 14:00. Two workers in this bay are on day two of acclimatization and should be on reduced exposure.
An Afternoon Trigger Seen Before Lunch
This exchange shows how an EHS manager might use iFactory.
iFactory ships as a pre-configured NVIDIA AI server, racked and ready with the heat and environmental exposure monitoring models loaded. Rack it, plug in power and Ethernet, and the AI is live on your network. Our scope covers cameras, sensors and data connections across hot process areas, warehouses, docks and outdoor work zones, CMMS, HR, training and access control integration, cabling and network setup, supervisor and safety team training, and 24×7 remote monitoring. Alerts and records support your safety team; they do not replace your procedures, competent persons or legal duties.
Server installed, system links live, existing permits, inspections, training and incident records loaded.
Workflows and models configured to your own procedures, then piloted in one area with your safety team reviewing every alert.
Rollout to the agreed areas and sites, supervisor and safety team training, and 24×7 remote monitoring in place.
Software, server and integration come as one package. For pricing on your site, contact our sales team.
Frequently Asked Questions
Not yet, as of October 2026. OSHA proposed a rule in August 2024 and has signalled a supplemental proposal. Its heat emphasis program was renewed to 2031, and several states enforce their own rules.
An initial trigger at a heat index of 80 °F and a high heat trigger at 90 °F, or the equivalent NIOSH wet bulb globe temperature limits.
Wet bulb globe temperature, a measure combining humidity, radiant heat, air temperature and air movement. Indoors it is 0.7 times natural wet bulb plus 0.3 times globe temperature.
NIOSH recommends no more than 20% of usual exposure on day one, rising by no more than 20% a day. Returning experienced workers follow 50%, 60%, 80% and 100% over four days.
Yes where heat reaches the triggers. The proposed federal rule and the rules in California, Maryland, Oregon, Nevada and Minnesota cover indoor work.
Heat monitoring for the first hot areas can typically be live within a 6–12 week rollout. Plan it with our specialists.
Run Your Heat Plan Every Day, Not Just on Paper
iFactory measures heat in every area, alerts before triggers are crossed, tracks acclimatization and records every break, so workers are protected and the plan can be proven.
Illustrative. Hours above the initial trigger show where controls, shade or ventilation will matter most.