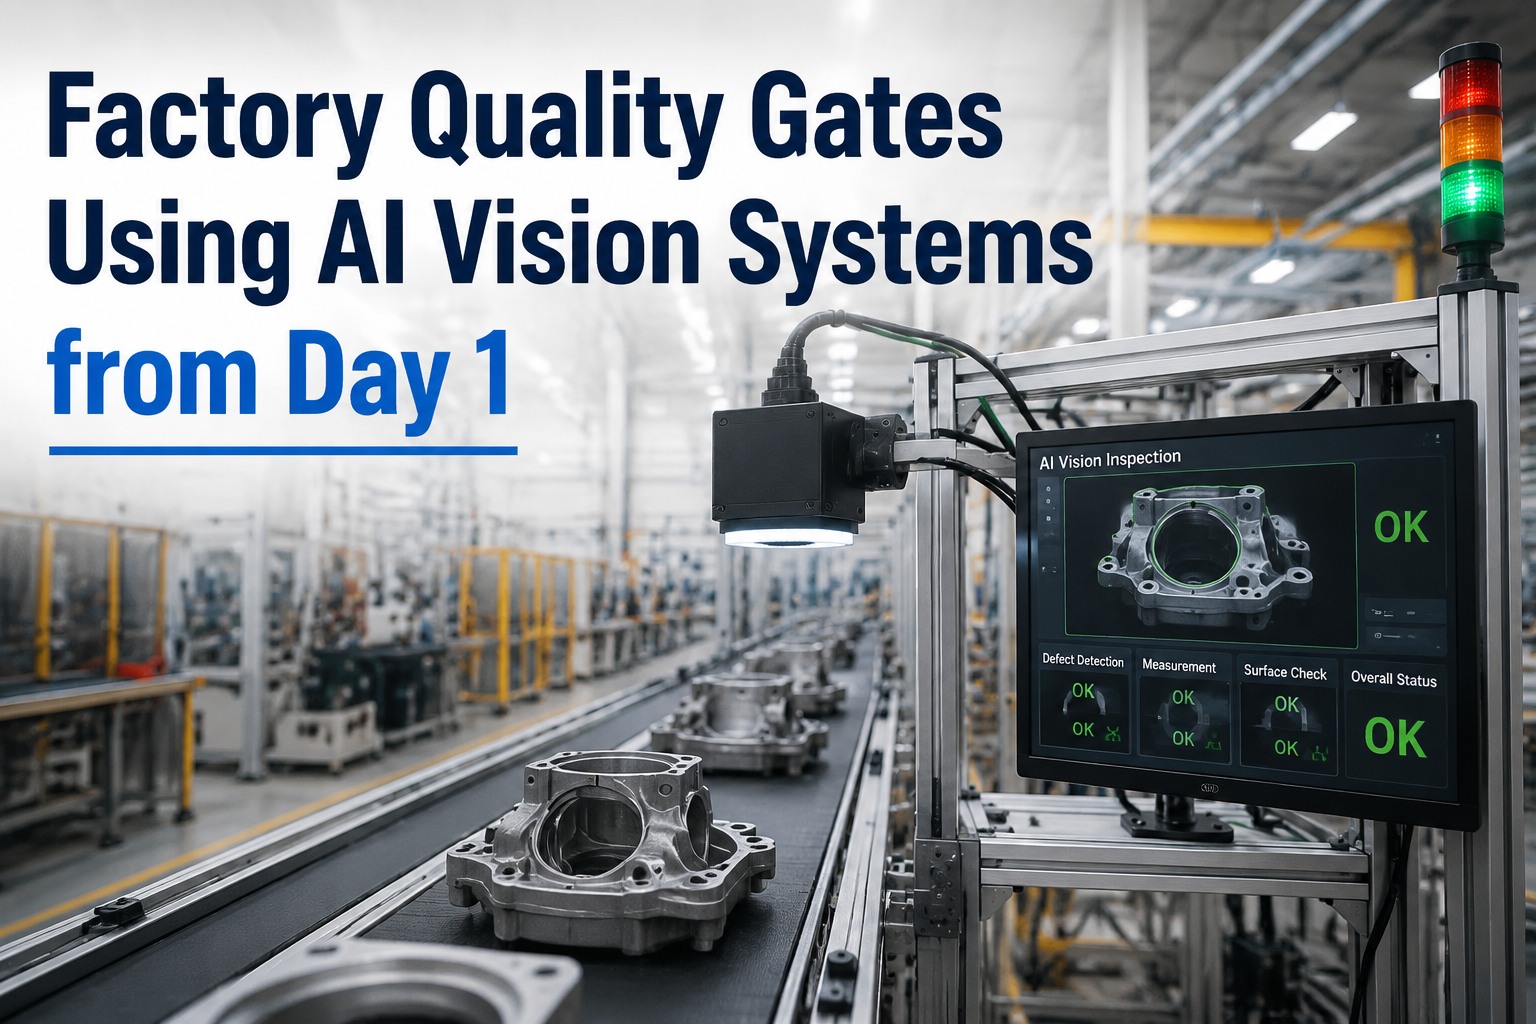
Most greenfield factories design quality inspection as the last step — a final check before product ships. That architectural decision is one of the most expensive mistakes in modern manufacturing. By the time a defect reaches end-of-line, every station downstream has added labor, materials and machine time to a part that will ultimately be scrapped or reworked. On a twenty-station assembly line, a defect introduced at station two means eighteen stations of wasted capacity. AI vision quality gates change this from a detection architecture into a prevention architecture — catching defects at the point of origin, closing the SPC loop in real time, and protecting every downstream process from work that was never worth doing.
Design your quality gate architecture with iFactory — we map every inspection point, camera specification, and SPC integration before your line layout is finalized.
After high-risk operations: press-fit, weld, adhesive, assembly
At sub-assembly completion before integration into main line
100% final inspection — last containment before shipping
The Cost of Getting Quality Gate Architecture Wrong
A single defect caught at Gate 1 (in-process) might cost $2 to contain and correct. The same defect caught at Gate 3 (end-of-line) costs $40–$80 in rework, retesting, and repackaging. The same defect escaping to a customer costs $2,000–$50,000 in warranty processing, expedited logistics, and recall-scope investigation. These multipliers are well-documented across automotive, electronics, and consumer goods manufacturing — and they make the case for in-process quality gates far more powerfully than any vendor benchmark.
defect detection accuracy achievable with AI vision at production line speed
reduction in defect escape rates documented in AI vision deployments vs. manual inspection
target escape rate with three-gate AI architecture — vs. 5–15% with manual end-of-line only
camera trigger to reject gate signal — no throughput penalty at full production speed
Want to calculate the cost of your current inspection gap? Book a quality cost analysis session — iFactory quantifies your escape rate and defect containment cost before you commit to any hardware investment.
Designing Each Quality Gate: What AI Vision Does at Each Stage
Each gate type in the three-gate architecture has a distinct mission, different camera configuration requirements, and different integration pathways. Designing them as a system from day one — rather than adding gates reactively as defect escapes occur — is what separates a zero-defect factory from one that continuously chases quality problems.
Immediately after high-risk operations: press-fit assembly, weld seams, adhesive dispensing, torque-critical fastening, and any step where a defect cannot be reworked cost-effectively downstream. If a defect introduced here multiplies in cost at every subsequent station, a Gate 1 camera pays for itself in weeks.
Defect rate per operation, false reject rate (target ≤0.5%), and correlation between defect type and upstream process variable. Gate 1 data is the most valuable SPC input — it identifies process drift before it compounds across downstream stations.
At the completion of any sub-assembly module before it is integrated into the main product. An incomplete or defective sub-assembly reaching final assembly is a rework event that costs 10–40× more than catching it at the sub-assembly station — and may require disassembly of completed product. Gate 2 is the most cost-protective gate in complex assembly lines.
Sub-assembly first-pass yield, wrong-component escape rate, and time-to-rework on fails. A well-tuned Gate 2 system should achieve first-pass yield above 98.5% within the first production quarter — failures below that threshold indicate a process issue upstream, not an inspection issue.
After final assembly and packaging, before product enters the dispatch buffer. End-of-line inspection evaluates the finished product exactly as the customer will receive it — packaging integrity, label accuracy, final surface condition, and dimensional compliance. This gate is the last containment before shipping and must inspect 100% of production at full line speed with no throughput penalty.
Escape rate (target ≤0.1%), false reject rate (target ≤0.5%), and inspection uptime (target ≥99.2%). Every rejected unit must generate a timestamped image archive — this is the audit evidence that narrows recall scope from a full production batch to a specific time window and defect type.
Not sure how many gates your line needs or where to place them? Talk to iFactory's quality gate design team — we map inspection points against your line layout, process risk profile, and target escape rate before any hardware is specified.
Deploy AI Quality Gates That Are Production-Ready on Day One
iFactory's greenfield quality gate platform designs in-process, sub-assembly, and end-of-line inspection together as a single system — with SPC integration, reject gate control, and CMMS traceability built in from the first production run. No retrofit. No ramp-up delay. Zero-defect architecture from the start.
Closing the Loop: How AI Vision Feeds Real-Time SPC
A quality gate that only passes or rejects individual units is a containment tool. A quality gate that feeds its inspection data into a real-time SPC engine is a prevention tool. The difference is the SPC integration layer — and it is the single design decision that most separates reactive quality management from proactive zero-defect manufacturing.
100% Inspection Data Capture
Every unit inspected generates a timestamped record: defect classification, location in part coordinates, part serial number, machine ID, tool ID, operator shift, and lot number. This per-part traceability dataset is what enables SPC to detect process drift rather than just individual failures.
Data: Per-unit, real-time, structuredReal-Time Control Chart Updates
Defect classification data feeds SPC control charts continuously. Western Electric rules trigger automatically when control limits are approached — not after they are breached. Cpk and Ppk indices reflect live production state rather than last shift's batch sample. Process shifts are detectable hours before defect rates spike.
SPC: Continuous, automated, multi-variableAutomated Process Alerts
When defect patterns exceed configurable thresholds — for example, three consecutive units with the same scratch pattern — the system triggers a process alert routed to the responsible engineer. The alert includes the defect image, upstream process parameters at the time of production, and the suggested corrective action generated from historical root cause data.
Response: Alert in <30 secondsClosed-Loop Corrective Action
Process alerts trigger CMMS work orders, MES production holds, and supplier non-conformance reports automatically — without manual data transfer. The loop closes when the corrective action is completed and defect rates return within control limits. AI model retraining is triggered when new defect types appear, maintaining detection accuracy as products evolve.
Integration: MES, CMMS, ERP — real-timeReady to connect your quality gates to a live SPC engine? Book an SPC integration demo — iFactory shows you how defect data flows from camera to control chart to corrective action in under 60 seconds.
Expert Perspective
The facilities I see with the fewest escapes all share one characteristic: they treat end-of-line inspection not as a standalone quality gate but as the trigger for their entire continuous improvement loop. When a vision system catches a surface defect, the question isn't just 'reject the unit' — it's 'why is this process drifting, when did it start, and what maintenance action prevents it from recurring?' The plants that connect their inspection data to their process parameters are the ones whose defect rates compound downward year after year.
— iFactory Quality Systems Engineering Team, Greenfield Manufacturing Practice
reduction in defect escapes in documented automotive AI vision deployment
scrap rate reduction when 100% inspection data integrates with real-time process control
lower infrastructure cost vs. retrofit — quality gates designed in vs. bolted on after launch
Build Your Zero-Defect Factory From the First Production Run
iFactory's greenfield AI quality gate platform deploys in-process, sub-assembly, and end-of-line inspection together — with SPC integration, real-time process alerts, and CMMS-connected corrective action built in from day one. The result is a quality architecture that improves continuously, not one that chases defect escapes reactively.
Frequently Asked Questions
What is a quality gate in manufacturing, and how does AI vision change it?
A quality gate is a defined inspection point in the production process where products are assessed against acceptance criteria before advancing to the next stage. Traditional quality gates use manual visual inspection or statistical sampling — both of which have inherent escape rates. AI vision transforms quality gates from probabilistic sampling events into deterministic 100% inspection points operating at line speed, with consistent detection accuracy that never degrades across shifts. The critical architectural change is integration: AI vision gates feed their data into SPC engines and CMMS systems in real time, converting each gate from a pass/fail decision point into a continuous process monitoring node.
How many quality gates does a greenfield production line need?
The right number depends on product complexity, process risk profile, and the cost consequence of downstream defect propagation. A practical greenfield design framework starts with a process risk assessment that identifies every operation where a defect cannot be cost-effectively reworked downstream — each of those is a candidate for an in-process gate. Sub-assembly completion points and the final end-of-line position are mandatory gates regardless of line complexity. Most mid-complexity assembly lines end up with 3–7 AI vision gates total: 1–4 in-process gates at high-risk operations, 1–2 sub-assembly gates, and 1 end-of-line gate. Adding gates reactively after launch costs 3–5× more than designing them in from the start.
What escape rate can a three-gate AI vision architecture realistically achieve?
A well-designed three-gate AI vision architecture targets a customer escape rate at or below 0.1% — compared to 5–15% for manual end-of-line-only inspection. The 0.1% target assumes AI detection accuracy of 99.5%+ at each gate, a false reject rate below 0.5%, and a closed-loop SPC system that corrects process drift before it saturates any single gate. Deployments that integrate all three gates with real-time SPC and process feedback have demonstrated 83–87% reductions in escape rates versus the preceding manual inspection regime, with some regulated manufacturers reaching escape rates below 0.05% within 12 months of full deployment.
How does AI vision quality gate data integrate with SPC systems?
AI vision systems export per-unit inspection results — defect type, location, severity, and pass/fail decision — via OPC-UA, MQTT, REST API, or direct database write to MES. The SPC engine ingests this stream and updates control charts in real time, applying Western Electric rules and capability index calculations (Cpk, Ppk) against live production data rather than sampled historical batches. When control limits are approached, the SPC engine triggers process alerts that route to the responsible engineer with the defect image, upstream process parameters, and suggested corrective action. This closes the loop from detection to correction in under 60 seconds — compared to hours or days on manual SPC reporting cycles.
Is it better to deploy AI quality gates in a greenfield factory vs. retrofitting an existing line?
Greenfield deployment costs approximately 70% less than retrofit for equivalent quality gate coverage. In a greenfield facility, camera mounting structures, lighting power drops, conduit runs, vibration isolation, and server room HVAC are all designed into the facility from the start — eliminating the floor modification, production stoppage, and engineering rework costs that dominate retrofit budgets. More importantly, greenfield deployment allows gate placement to be optimized against the designed process flow rather than constrained by existing line layout. Gates can be positioned exactly where process risk analysis demands them, not where retrofit access happens to be available.