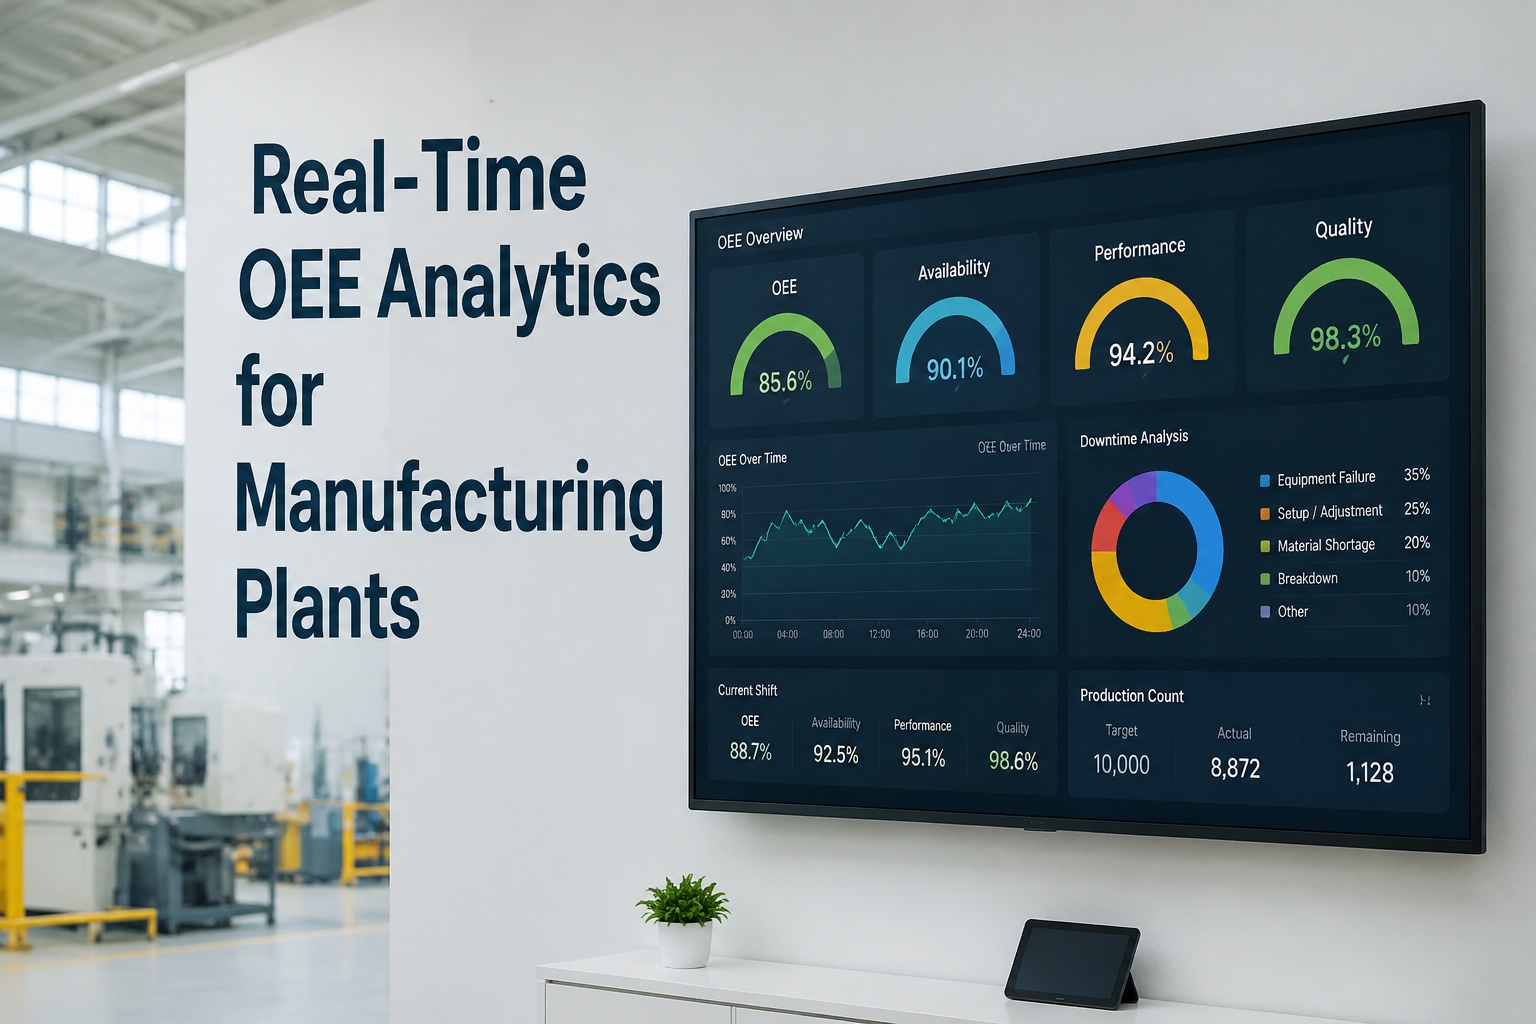
Most manufacturers believe their OEE. They shouldn't. Manual downtime logging misses every stop under five minutes — and those micro-stops, accumulated across a 24-hour shift, routinely account for 15–20% of lost production capacity that never appears in the report. The gap between what your OEE dashboard shows and what your equipment is actually achieving is not a measurement problem. It is a data capture problem. Real-time OEE analytics — connected directly to PLC signals, not to operators with clipboards — eliminates that gap permanently. From the first production shift, every second of lost capacity is classified, attributed, and surfaced with the root cause your engineering team needs to act on it.
See iFactory's real-time OEE dashboard with your production data — 30-minute live demo with a manufacturing analytics specialist.
Why Your Current OEE Number Is Wrong — and By How Much
Manually captured OEE values are systematically 8–12 percentage points higher than automatically measured values. When plants switch to automatic PLC-based capture for the first time, displayed OEE drops by 15–20 percentage points in the first week — not because production got worse, but because measurement became accurate for the first time. This measurement gap is the reason improvement programs stall: you cannot Pareto-analyze data you never collected.
OEE overstatement in manual tracking vs. automatic PLC capture — the hidden gap
OEE improvement in documented Tier 2 automotive deployment over 14 months
average OEE improvement documented across 450+ factories using AI-driven OEE platforms
of manufacturing executives rate real-time analytics as extremely important to operational strategy
Curious how accurate your current OEE number really is? Book a data accuracy comparison session — iFactory connects to your PLCs and shows real vs. reported OEE side by side before you commit to any platform.
The Six Big Losses: Where Your OEE Is Actually Going
The Six Big Losses framework, developed as part of Total Productive Maintenance, gives every plant manager and maintenance engineer a precise map of where production efficiency disappears. Real-time OEE analytics classifies every loss event automatically into one of the six categories — so instead of seeing a percentage drop, your team sees exactly which loss category is the highest-priority improvement target and by how much.
Equipment Failure
Unscheduled stops from motor burnouts, bearing failures, conveyor jams, hydraulic leaks. The most visible and most expensive single loss — halts output entirely and triggers emergency maintenance at premium cost.
Setup & Changeover
Time lost between production runs during product changeovers, die changes, and tooling swaps. Real-time OEE measures actual vs. target changeover time — exposing setup losses that manual logs round away.
Idling & Minor Stops
Stoppages under 5 minutes — sensor trips, jams cleared in seconds, material feed interruptions — that are invisible to manual tracking. These micro-stops routinely account for 15% of lost capacity and only appear with real-time monitoring.
Reduced Speed
Equipment running below its designed ideal cycle rate — worn servo motors, outdated calibration, conservative operator settings. Performance losses are the hardest to see without real-time cycle time comparison to the designed rate.
Startup Yield Loss
Defective parts produced during machine warm-up and after changeovers before process stability is reached. Startup losses spike at every shift start — real-time OEE makes this pattern visible across shift boundaries and product transitions.
Production Defects
Scrap and rework during steady-state production. Real-time quality integration catches defect rate climbs within minutes — not at end-of-shift when 500 rejects have already been produced. Early warning enables parameter correction before the batch is lost.
Want to see which of the Six Big Losses is costing your plant the most? Talk to iFactory's OEE analytics team — we run a loss profile analysis from your existing PLC data before you commit to any solution.
Real OEE From Your First Production Shift — Not Your First Month
iFactory connects to your PLCs via OPC-UA in 24–48 hours and delivers accurate, automatic OEE data from shift one — with AI-powered Six Big Loss classification, shift performance dashboards, and root cause alerts that tell your team what to fix before the score drops again.
What Real-Time OEE Analytics Surfaces That Shift Reports Miss
The time between a production problem occurring and someone with the authority to fix it seeing the data is where your biggest losses live. End-of-shift reports compress twelve hours of production into a single percentage — hiding the patterns that, if caught in real time, would allow a supervisor to intervene in minutes. Here is what changes at every operational level when OEE data is genuinely live.
Sees live OEE for their machine, current shift target vs. actual parts count, and an active alert with reason code when OEE drops below threshold. Responds to problems in minutes instead of discovering them at handover.
Sees all lines simultaneously — each line's current OEE, which asset is underperforming, how the current shift tracks against target, and shift-over-shift comparison with crew attribution. Directs maintenance and intervention where it matters most.
Accesses Six Big Loss Pareto by machine, time window, and product. Correlates downtime events with upstream process parameters, tool wear, and environmental data. AI surfaces the root cause hypothesis — engineer confirms and closes the loop with a CMMS work order.
Tracks OEE trends across all lines, this week vs. last, this month vs. same month last year. Sees line-to-line benchmarks, SKU mix impact on OEE, and capacity utilization against plan. Identifies which line has the highest ROI potential for improvement investment.
Getting Real-Time OEE Live: The 48-Hour Deployment Path
Modern OEE platforms connect directly to PLC signals without stopping production — no MES implementation project, no six-month rollout. For a greenfield plant, OEE infrastructure is designed in from day one alongside the facility's data architecture, so the system goes live with commissioning rather than six months afterward.
PLC Connection & Signal Mapping
Edge gateway connects to PLC via OPC-UA or Modbus. Machine states are mapped: running, stopped, idle, fault, setup. Ideal cycle time is configured per machine per product SKU. No production interruption required — connection is read-only from PLC perspective.
Downtime Classification & Six Big Loss Mapping
AI engine begins classifying every stop event against the Six Big Losses framework using PLC fault codes, duration, and operational context. Downtime categories are validated against plant-specific equipment types. Operator reason code input is available but not required — AI covers the classification gap.
Dashboard Configuration & Alert Thresholds
Role-based dashboards are configured for operators (Andon display), supervisors (shift control view), engineers (root cause drill-down), and management (KPI executive view). OEE alert thresholds are set per line and per shift — SMS, email, and push notifications fire when OEE drops below target.
Shift Handover Reports & AI Root Cause Analysis
Automated shift reports are generated at every handover — showing OEE by machine, Six Big Loss breakdown, top three actions for the incoming shift. After 7–14 days of data, the AI root cause engine begins correlating loss patterns with process parameters, tool wear, and maintenance history to generate predictive alerts.
Ready to see what your real OEE looks like? Book an OEE deployment walkthrough — iFactory shows the exact connection steps for your PLC brand and facility configuration.
Expert Perspective
The moment a plant switches from manual to automatic OEE capture, the displayed number drops — sometimes dramatically. In the first two weeks after going live, plants routinely see their OEE fall 15–20 points on paper. That drop is not bad news. It is the most valuable measurement event in the facility's history: the first time anyone has seen where the capacity actually went. Every improvement program we've run that achieved lasting results started with that drop. The plants that reacted by adjusting the measurement methodology to recover the paper number? They're still at 65% OEE two years later.
— iFactory OEE Analytics Engineering Team, Manufacturing Performance Practice
to first accurate OEE report after PLC connection — no baseline learning period required
world-class OEE benchmark — achieved by only 3% of manufacturers; iFactory shows the path
production capacity recovered by one Tier 2 automotive plant in 14 months with AI OEE platform
Stop Managing the OEE Number. Start Eliminating the Losses Behind It.
iFactory's real-time OEE platform connects to your PLCs in 24 hours, automatically classifies every loss event into the Six Big Losses framework, and surfaces AI-powered root cause analysis before your next shift starts. Built for greenfield plants that want accurate data from day one.
Frequently Asked Questions
How is real-time OEE different from end-of-shift OEE reporting?
End-of-shift OEE is a retrospective average — it tells you what happened, but by the time your team sees it, the production run that caused the drop is already complete. Real-time OEE updates every 30–60 seconds directly from PLC signals, meaning a supervisor sees OEE deteriorating as it happens rather than discovering it at handover. This shift from lagging to leading visibility is what turns OEE from a reporting metric into an operational intervention tool. The critical difference in practice: a 12-minute micro-stop pattern that repeats 30 times per shift becomes visible in a real-time dashboard within the first occurrence. In an end-of-shift report, it appears as a 5% performance reduction with no actionable root cause attached.
How does AI automatically classify downtime into the Six Big Losses?
AI downtime classification uses PLC fault codes, stop duration, operational context (production run, changeover, startup, scheduled maintenance), and historical pattern matching to assign every stop event to one of the six categories without operator input. Equipment failures are identified by fault code and duration patterns. Changeover and setup time is measured against SMED benchmarks. Minor stops under five minutes are classified by duration and frequency pattern. Speed losses are detected by comparing real-time cycle time against the configured ideal cycle rate per product. Quality losses integrate directly from MES pass/fail data or vision inspection systems. The AI model improves its classification accuracy over time as it learns facility-specific fault signatures and operator correction patterns.
What is a world-class OEE score and how is it measured?
World-class OEE is 85% or higher, as defined by the Japan Institute of Plant Maintenance and the ISO 22400-2 standard. It means 85% of all planned production time is producing good parts at ideal speed. In practice, only 3% of manufacturers consistently sustain 85%+ OEE. The global average for discrete manufacturing is 55–70%. Achieving 85% requires simultaneous high performance across all three components: Availability at 90%+, Performance at 95%+, and Quality at 99%+. The most common barrier is measurement accuracy — plants frequently believe they are at 75–80% when automatic PLC-based capture reveals the true number is 55–65%, with the gap explained by untracked micro-stops and speed losses that manual recording misses.
How quickly can real-time OEE analytics be deployed on an existing production line?
A modern OEE platform connects to PLC signals without stopping production — typical deployment on an existing line takes 24–48 hours from connection to live dashboard. The connection is read-only from the PLC's perspective, using OPC-UA or Modbus protocols supported natively by Siemens, Rockwell, Beckhoff, ABB, and most major PLC brands. For greenfield plants, OEE infrastructure is designed into the facility from day one alongside the data architecture — so the OEE platform goes live with commissioning rather than being retrofitted six months later. For legacy equipment without PLC outputs, non-intrusive vibration and current sensors provide production state signals and enable OEE tracking at a lower data resolution.
How do shift-level OEE dashboards help supervisors improve production?
Shift dashboards give supervisors two capabilities they don't have with end-of-shift reports: real-time intervention and shift-over-shift crew attribution. Real-time intervention means a supervisor sees a machine's OEE falling at 9:30am and can dispatch maintenance before the 10am production window is lost — not discover the 90-minute drop at 2pm handover. Crew attribution means OEE data is automatically tagged to the shift team responsible for it, enabling honest comparison of morning, afternoon, and night shift performance against the same machines and products. This attribution data — used constructively rather than punitively — consistently surfaces training opportunities, equipment preferences, and scheduling patterns that move overall OEE improvement faster than any technical intervention alone.