Compressed air is the fourth utility in manufacturing — after electricity, gas, and water — and by far the most wasteful one. The U.S. Department of Energy estimates that 20 to 30% of all compressed air generated in a typical plant is lost before it reaches any production tool, primarily through pipe leaks, pressure mismatches, and compressor inefficiency. At $0.12 per kWh, a 500 kW compressor plant wasting 25% of its output loses approximately $180,000 per year in electricity generating air that does no productive work. In a greenfield plant, every one of these waste sources is a design decision — not an operational problem discovered later. Book a greenfield compressed air design consultation to validate your compressor sizing, piping layout, air quality specification, and AI monitoring architecture before equipment is ordered.
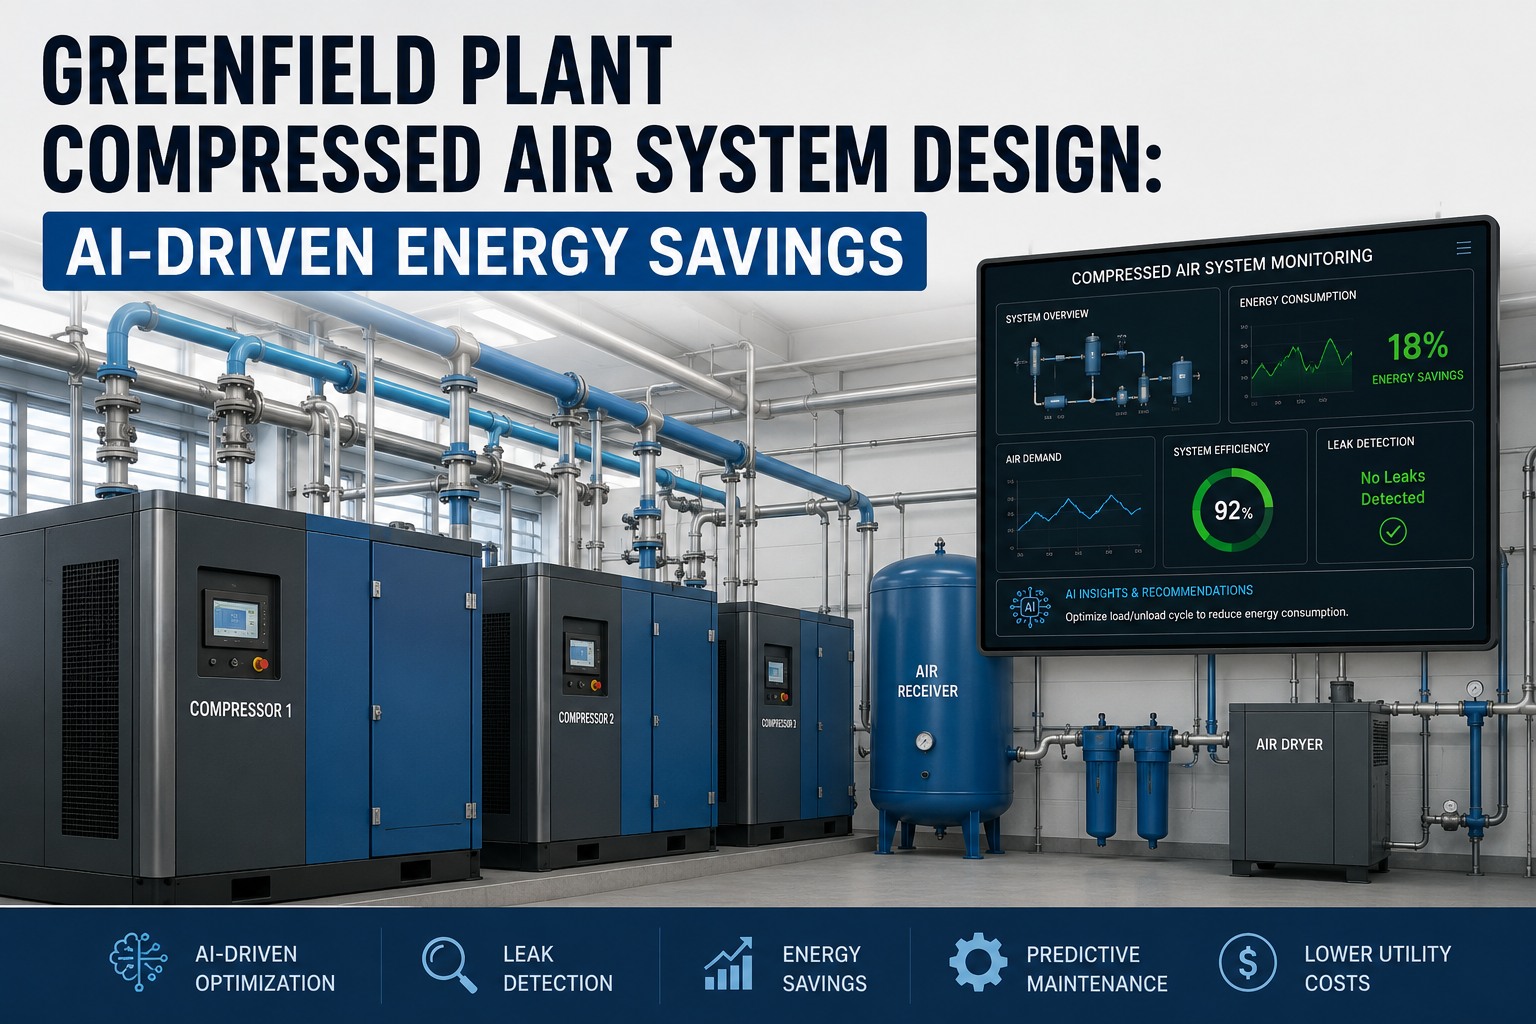
Greenfield Plant Compressed Air System Design — AI Energy Savings 2026
Where Compressed Air Energy Goes — and Where AI Gets It Back
Generated electricity input to compressors
Lost to pipe leaks (typically 20 to 30%)
Lost to over-pressurisation (+10 PSI = +5 to 7% energy)
Lost to compressor part-load cycling inefficiency
Lost to filtration pressure drop (dirty filters, undersized)
Useful work done by compressed air on production tools
≈ 48 to 53%
What AI Recovery Looks Like in Year One
+15 to 20%Leak elimination — AI ultrasonic detection finds and prioritises every leak point within 24 to 48 hours
+8 to 12%Pressure optimisation — AI reduces system pressure to minimum required per zone, not one global maximum
+8 to 10%Compressor staging — AI matches supply to actual demand, eliminating no-load running and peak cycling losses
Total recovery: 30 to 45% reduction in compressed air energy cost in year one
20–30%Of generated compressed air lost to leaks in a typical plant
8–10%Of total plant electricity consumed by compressed air systems
$1.8–4.2MAnnual energy waste from undetected compressed air inefficiencies per plant
5–7%Energy added for every 10 PSI over minimum required system pressure
Compressor Sizing and Selection: The Greenfield Decisions That Drive 20 Years of Energy Cost
The most expensive long-term compressed air decision is made before the first pipe is routed: compressor type, capacity, and staging strategy. An oversized single compressor running at 40% load on its unload cycle wastes 15 to 25% of its rated power generating nothing. An undersized system running at pressure setpoint continuously cannot absorb demand peaks without pressure collapse. Getting sizing right — with correct demand diversity factors, future capacity provision, and VSD staging strategy — is a greenfield engineering calculation, not a vendor sales exercise.
Rotary Screw — Fixed Speed
5 to 500+ kW
Best for steady baseload demand with less than 20% variation. Lowest CapEx per kW.
Inefficient at part load — unloaded compressor still consumes 20 to 35% of full-load power. Do not select as sole compressor where demand varies.
AI role: Monitors specific power (kW/SCFM) against baseline — flags when compressor is running degraded and when demand justifies switching to VSD
Recommended for most greenfield plants
Rotary Screw — Variable Speed Drive (VSD)
15 to 500+ kW
Matches output exactly to demand — energy proportional to actual load. 15 to 35% energy saving vs. fixed speed at typical demand profiles (40 to 80% average load).
Higher CapEx than fixed speed — justified when demand variation exceeds 20%. Not suitable as primary if demand is always at or near rated capacity.
AI role: Reads demand forecast from production schedule, pre-positions VSD setpoint before shift changes — eliminates pressure transients at shift start
Oil-Free Rotary Screw
15 to 1,000+ kW
ISO 8573-1 Class 0 oil-free output — mandatory for food, pharma, semiconductor, and medical applications. Two-stage compression with intercooling for efficiency.
Higher CapEx (1.5 to 2x lubricated equivalent). Requires comprehensive air treatment train even with oil-free technology — ambient oil contamination still present in intake air.
AI role: Monitors intercooler fouling (temperature differential), tracks water separator performance, alerts when ambient intake conditions (humidity, temperature) approach operational limits
Centrifugal (Turbo) Compressor
150 to 5,000+ kW
Best specific energy at large continuous flows. Oil-free by design. Ideal for high-volume, steady-demand applications: glass, chemicals, large automotive.
Surge risk at low demand — minimum inlet flow must be maintained. Requires inlet guide vane control or bypass for turndown. Specialist commissioning required.
AI role: Monitors surge margin continuously, adjusts inlet guide vanes proactively before surge conditions develop — prevents the catastrophic surge events that damage impellers
Recommended Greenfield Staging Strategy: 1 VSD + 1 Fixed Speed Trim
Base
Size VSD compressor to cover 70 to 80% of average demand. It modulates continuously to match load — no unloaded running, no pressure transients.
+
Trim
Size fixed-speed compressor for peak demand above VSD capacity. AI starts and stops trim compressor automatically — never runs both at partial load simultaneously.
+
Reserve
Third compressor (equal to base or trim) on standby only. AI triggers warm start when reliability metrics on base compressor show elevated risk.
Design rule: Never size a single compressor for 100% of peak demand. A single-compressor system with no standby means a compressor failure stops production. All greenfield systems should have N+1 compressor provision in the mechanical room layout, with the N+1 electrical supply provision specified at building design.
Not sure how to size your compressor staging for demand diversity? Book a compressed air system consultation — we will model your demand profile and produce a compressor sizing and staging recommendation before equipment is specified.
Piping Design, Air Quality, and the Treatment Train That Protects Both
Compressed air quality and distribution design are inseparable: a correctly specified treatment train producing ISO 8573-1 Class 1.2.1 air is worthless if the distribution pipework adds contamination, pressure drop, or moisture accumulation downstream. In a greenfield plant, both are designed together — piping material, layout, and filtration all specified before the mechanical room is positioned or the pipe routes are coordinated with structural steel.
The Correct Compressed Air Treatment Train — Golden Rule of Component Order
1
Compressor
+ aftercooler
2
Wet Receiver
condensate collection
3
Pre-filter
5 µm particulate
4
Dryer
refrigerated or desiccant
5
Coalescing Filter
0.01 µm oil removal
6
Dry Receiver
demand buffer
7
Ring Main
aluminium or SS loop
Never reverse dryer and coalescing filter order. Installing the coalescing filter before the dryer saturates the filter element with free water — reducing efficiency to zero within hours and generating massive pressure drop.
ISO 8573-1 Air Quality Classes — Specify the Right Class Before Buying Any Treatment Equipment
Application
ISO 8573-1 Class
Particles
Water (Dew Point)
Oil Content
Pneumatic tools, cylinders, general
Class 3.4.3
≤5 µm, ≤1 mg/m³
+3°C PDP
≤1 mg/m³
Instrumentation, process control
Class 2.3.2
≤1 µm, ≤0.1 mg/m³
−20°C PDP
≤0.1 mg/m³
Spray painting, coating
Class 2.3.1
≤1 µm, ≤0.1 mg/m³
−20°C PDP
≤0.01 mg/m³
Food and beverage (direct contact)
Class 1.2.1
≤0.1 µm, ≤0.1 mg/m³
−40°C PDP
≤0.01 mg/m³
Pharmaceutical, medical, semiconductor
Class 1.2.1 or Class 0
≤0.1 µm, ≤0.1 mg/m³
−40°C PDP or better
≤0.01 mg/m³ (Class 0: agreed specification)
Design rule: Specify ISO class per end-use application zone — not one global class for the entire plant. Running the whole facility at Class 1.2.1 when only one zone needs it adds enormous ongoing filter and dryer energy and consumable cost. Use point-of-use filtration for critical zones fed from a Class 2.4.2 ring main.
Validate Your Compressed Air Design Before Compressors Are Ordered
iFactory's greenfield compressed air consultation covers compressor type and staging selection, demand profile analysis, piping layout review, treatment train specification per ISO 8573-1 class, AI monitoring sensor schedule, and energy baseline calculation — all before equipment procurement begins.
AI Compressed Air Monitoring: Three Pillars, One Energy Platform
Plants running AI compressed air monitoring have reduced energy costs by 30 to 45% within 12 months. The gains come from three simultaneous optimisation pillars that only AI can deliver continuously — because manual audits, even monthly, miss the dynamic between demand patterns, compressor cycling, and leak accumulation that drives energy waste in real time.
Pillar 1
AI Leak Detection & Prioritisation
Recovers 15 to 20% of energy
Ultrasonic sensors and pressure differential monitoring detect leaks within 24 to 48 hours of occurrence — not at the next scheduled audit
AI ranks each leak by energy loss rate (CFM × hours/day × energy cost) and auto-generates prioritised work orders by payback — highest-value repairs first
Leak accumulation trend shows how fast the system is degrading — allows planned repair windows before energy waste compounds
Sensor requirement: Pressure transmitters at every distribution branch + ultrasonic transducer at major junction points. Cable routes specified at pipe layout design.
Pillar 2
AI Pressure Zone Optimisation
Recovers 8 to 12% of energy
AI analyses pressure at every zone sensor and determines the minimum supply pressure needed to satisfy demand — eliminating the energy penalty of over-pressurising low-demand zones to serve one high-demand consumer
Pressure reduction zoning: high-demand areas (moulding, stamping) maintain higher pressure; general assembly, instrumentation served at optimised lower pressure via PRVs
Every 10 PSI reduction in system pressure saves 5 to 7% compressor energy — measurable and trackable in real time
Sensor requirement: Pressure transmitters and flow meters at each zone boundary. Zone isolation valves with position feedback. Specified at piping design stage — not retrofit.
Pillar 3
AI Compressor Demand Forecasting
Recovers 8 to 10% of energy
AI reads production schedule, shift patterns, and historical demand curves to forecast compressed air demand 15 to 60 minutes ahead — pre-positioning compressor staging before demand arrives
Eliminates the reactive pressure cycling that occurs when a fixed-speed compressor tries to match sudden demand peaks — start-stop cycles that cost energy and mechanical wear simultaneously
Specific power tracking (kW per SCFM) continuously monitors compressor health — a rising specific power signature indicates valve wear, intercooler fouling, or separator blockage 3 to 6 weeks before efficiency collapse
Integration requirement: Compressor controller data (MODBUS or OPC-UA), production MES schedule feed, site electricity meter. All data feeds specified at controls design stage.
Expert Perspective: Compressed Air Is the Energy Leak Nobody Manages Until AI Makes It Visible
Every greenfield compressed air system we audit in its first three years of operation has the same profile: 22 to 28% of generated air is leaking, the system pressure is set 12 to 18 PSI above what any process actually needs, and the compressor has been running on a fixed schedule since commissioning regardless of actual demand. None of this was intended. It was the result of sizing for worst case, setting pressure for the most demanding tool, and never having the monitoring visibility to optimise any of it. AI monitoring does not change the physics of compressed air — it changes the information available to act on the physics. When every leak is identified by flow loss and energy cost within 48 hours, they get repaired. When every zone's actual pressure requirement is visible, the system pressure drops. When compressor staging follows demand rather than a timer, the cycling losses disappear. A greenfield plant that designs in AI monitoring sensors, zonal pressure transmitters, and compressor controller integration from day one will achieve in year one what a retrofit plant takes three to five years of incremental improvement to reach.
— iFactory Greenfield Consulting, Industrial Utilities Engineering Practice 2025 to 2026
30–45%
Energy cost reduction achieved by plants running AI compressed air monitoring in year one
24–48 hr
Time for AI to detect and localise a new leak vs. months between manual ultrasonic audits
3–6 wk
AI advance warning for compressor valve and intercooler degradation before efficiency collapse
Want an AI compressed air monitoring specification for your greenfield plant? Talk to our utilities engineering team — we will produce a sensor schedule and monitoring architecture before your compressed air piping drawings are issued.
Design Your Greenfield Compressed Air System for AI Energy Recovery From Day One
iFactory's greenfield compressed air consultation covers compressor type and staging, demand analysis, treatment train specification per ISO 8573-1 zone classes, piping layout review, AI monitoring sensor schedule (pressure transmitters, flow meters, ultrasonic, compressor data integration), energy baseline calculation, and ISO 50001-aligned reporting architecture — all delivered before equipment procurement begins.
Frequently Asked Questions
How much energy does a typical manufacturing plant waste on compressed air leaks?
The U.S. Department of Energy estimates that 20 to 30% of all compressed air generated in a typical plant is lost through leaks before reaching any production tool. For a plant running a 500 kW compressor system at $0.12 per kWh for two shifts per day, 250 days per year, a 25% leak rate represents approximately $180,000 in wasted electricity annually. Across the US manufacturing sector, the DOE estimates air leaks cost $3.2 billion per year in wasted energy. The challenge is that most leaks are completely inaudible on a busy production floor — only detectable by ultrasonic sensors — and accumulate progressively as joints age and fittings cycle through thermal expansion and contraction. Without continuous AI monitoring, most plants discover their leak rate only during an infrequent manual audit.
Why does over-pressurisation add so much energy cost and how does AI fix it?
Every 10 PSI above the minimum required system pressure adds 5 to 7% to compressor energy cost. A plant running at 120 PSI when 95 PSI satisfies all process demands is spending 12 to 18% more on compressed air energy than necessary — permanently, for every hour the compressor runs. The reason plants over-pressurise is that the system is typically set to the maximum pressure required by the most demanding tool, and that pressure is applied to the entire distribution network including low-demand zones. AI pressure zone optimisation analyses actual demand at every zone sensor and determines the minimum supply pressure that satisfies every consumer — then implements zoned pressure reduction via PRVs and adjusts the compressor setpoint accordingly. This optimisation cannot be done manually because pressure requirements vary continuously with production schedule and process conditions.
What ISO 8573-1 air quality class should a greenfield manufacturing plant specify?
There is no single correct answer — ISO 8573-1 class should be specified per end-use zone, not for the entire plant. General pneumatic tools and cylinders typically require Class 3.4.3 (5 µm particles, +3°C dew point, 1 mg/m³ oil). Process instrumentation requires Class 2.3.2 (1 µm, −20°C dew point, 0.1 mg/m³ oil). Food and beverage direct contact zones require Class 1.2.1 (0.1 µm, −40°C dew point, 0.01 mg/m³ oil). Pharmaceutical and semiconductor applications require Class 1.2.1 or Class 0 by agreement. The energy and consumable cost of running the entire plant at Class 1.2.1 when only one zone requires it is substantial — the correct design uses a Class 2.4.2 ring main and point-of-use filtration and drying at critical zones only.
What is specific power in compressed air monitoring and why does AI track it?
Specific power is the energy consumed per unit of compressed air produced — typically expressed as kW per SCFM (standard cubic feet per minute) or kW per m³/min. A well-maintained rotary screw compressor has a specific power baseline of approximately 0.16 to 0.19 kW/SCFM. As compressor valves wear, intercoolers foul, separator elements load up, or air/oil separators degrade, the specific power rises — the compressor consumes more electricity to produce the same flow. AI tracks specific power continuously against the commissioning baseline and flags deviations above 5 to 8% as a maintenance trigger. This provides 3 to 6 weeks of advance warning before the compressor's efficiency degrades to the point of affecting system pressure or triggering a hard failure — allowing planned maintenance rather than emergency breakdown intervention.
How does iFactory's greenfield compressed air consultation work?
iFactory's compressed air consultation covers your demand profile analysis (peak, average, and shift-change demand patterns), compressor type and staging recommendation (VSD base + fixed trim + standby), air quality class specification per zone based on your process requirements, treatment train component selection (receiver sizing, dryer type, filter specification by ISO class), piping layout review for pressure drop compliance (maximum 0.1 bar header to point of use), AI monitoring sensor schedule (pressure transmitters, flow meters, ultrasonic, compressor controller integration), energy baseline and savings calculation, and ISO 50001 and energy reporting architecture. All outputs are specification-ready before equipment procurement begins.
Book your greenfield compressed air consultation here.