Greenfield Plant Conveyor System Design | AI Predictive Maintenance
By Riley Quinn on June 19, 2026
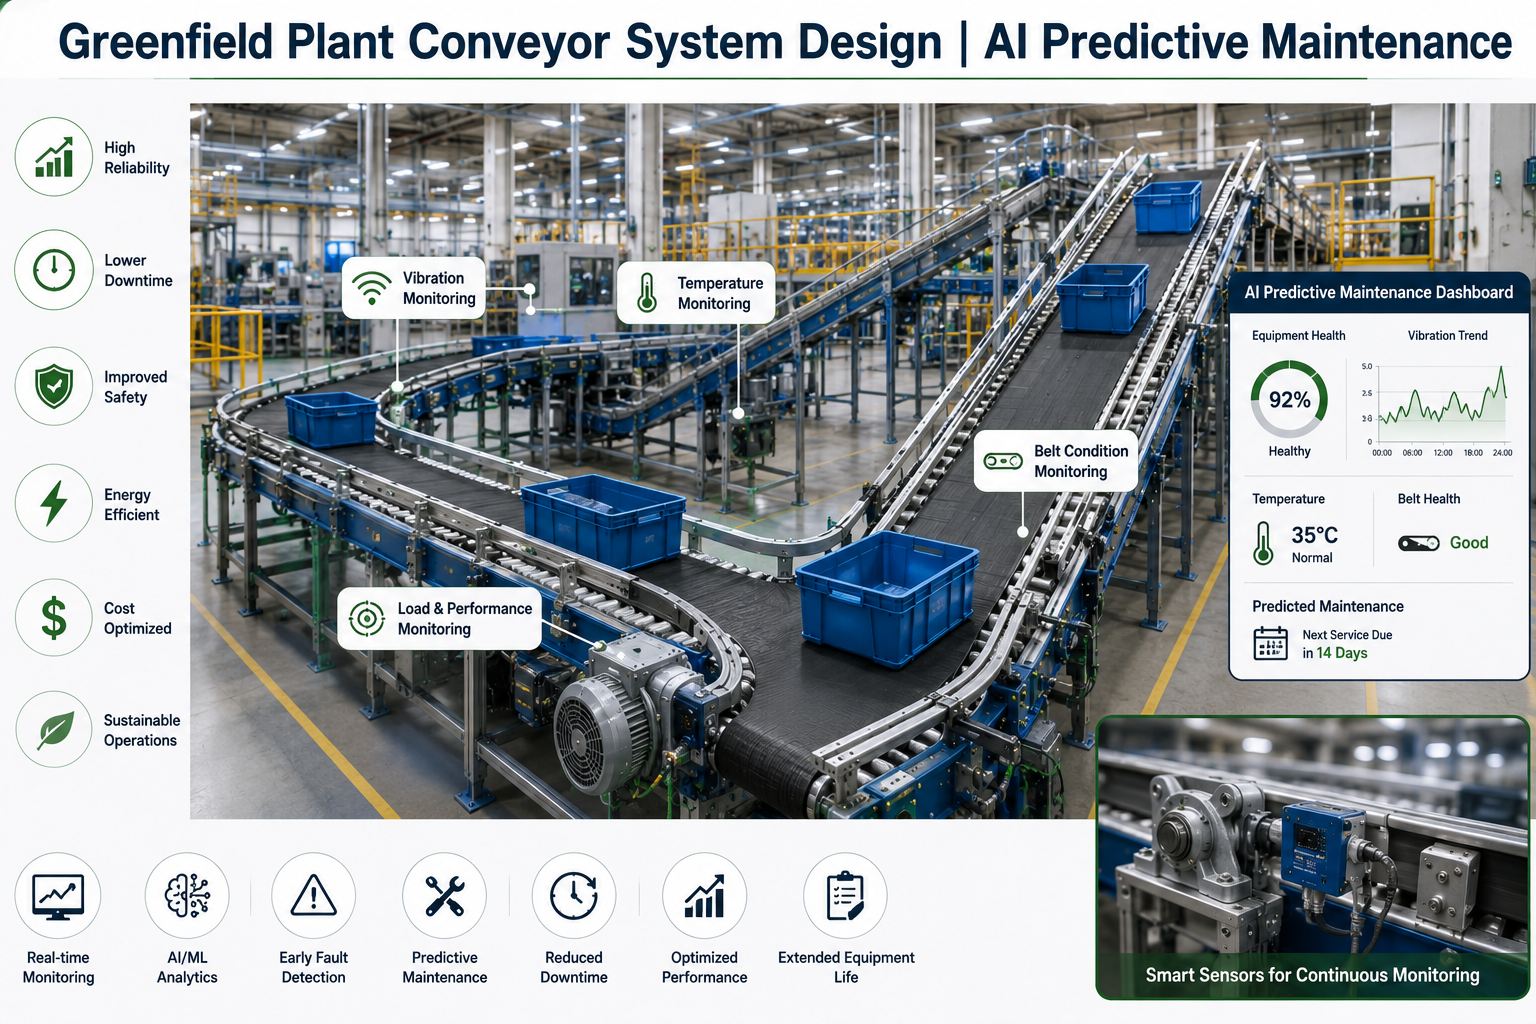
A single unplanned conveyor stoppage in a manufacturing plant costs $10,000 to $250,000 per event depending on line criticality and downstream production impact. Fifty-one percent of conveyor operators report productivity losses from unexpected belt damage — and the warning signs were present weeks before the failure. Bearing degradation leaves a vibration signature 4 to 6 weeks before seizure. Belt splice fatigue shows in tension variation patterns 2 to 3 weeks before a belt tear. Drive motor current anomalies signal mechanical drag 1 to 2 weeks before a gearbox failure. In a greenfield plant, every one of these failure modes can be made detectable from day one — by specifying the correct sensor infrastructure during design, before cable trays are routed and access platforms are positioned. Book a greenfield conveyor design consultation to validate your conveyor specification and AI monitoring architecture before equipment procurement begins.
Greenfield Plant Conveyor System Design — AI Predictive Maintenance 2026
Choose the Right Conveyor Type — Then Build AI Monitoring In From Day One
Belt Conveyor
Bulk material, long runs, inclines
2.5 to 3.5 m/s
AI monitors: belt tracking, tension, splice integrity, idler vibration
Roller Conveyor
Cartons, totes, pallets, discrete units
Gravity or powered, 0.3 to 1.5 m/s
AI monitors: roller bearing temperature, rotation loss, motor current
Chain Conveyor
Heavy loads, high temp, precision indexing
0.05 to 0.5 m/s (indexing); up to 1 m/s (continuous)
AI monitors: chain stretch, sprocket wear, lubrication state, drive load
Overhead / Power-and-Free
Assembly lines, paint lines, heavy carriers
Variable, 0.1 to 0.6 m/s
AI monitors: carrier accumulation, chain tension, trolley wear, drive load
$250K
Average cost per hour of unplanned conveyor downtime
70%
Reduction in breakdowns with AI predictive maintenance
4 to 6 wk
Advance warning window for bearing failures with AI vibration monitoring
30 to 50%
Belt life extension achieved with AI tracking and tension monitoring
Conveyor System Design: The Six Decisions That Drive Lifetime Reliability
Conveyor design in a greenfield plant is not a procurement decision — it is six interdependent engineering decisions that determine 20 years of maintenance cost, throughput reliability, and energy consumption. Getting any one of them wrong in the design phase produces a system that either fails to meet production throughput, becomes a chronic maintenance burden, or requires expensive modification within the first operating year.
01
Throughput Capacity Calculation
Belt conveyor capacity formulaC = 3,600 × A × v × ρ, where A = cross-sectional area (m²), v = belt speed (m/s), ρ = material density (t/m³)
Design marginSize for 80 to 85% of calculated capacity at rated speed — preserves headroom for surge loads without belt overloading
Belt width minimumBelt width must be minimum 3x the largest material lump size to prevent spillage and belt damage at load points
02
Belt Speed Selection
Standard range2.5 to 3.5 m/s for bulk materials — above 3.5 m/s increases idler and belt wear disproportionately
Lower speed applicationsFragile products: 0.5 to 1.5 m/s. Packaged goods on roller: 0.3 to 0.8 m/s. High-precision indexing: 0.05 to 0.3 m/s
VFD requirementSpecify VFD on all conveyors with variable load profiles — enables speed optimization for energy savings and reduces mechanical stress on starts
03
Drive System Selection
Direct driveLowest maintenance — eliminates chain, belt, and sprocket failure modes. Preferred for AI-monitored systems: motor current anomalies directly correlate with mechanical load changes
Chain driveCost-effective, motor positioning flexible — adds chain stretch and sprocket wear as monitored failure modes. Requires dedicated lubrication management
Belt driveQuiet, smooth, suitable for high-speed/high-load. Drive belt wear is a separate AI monitoring point — not to be confused with conveyor belt monitoring
04
Idler and Roller Spacing
Carrying side idler spacing1.0 to 1.5 m for bulk materials. Closer spacing (0.5 to 0.8 m) at load zones where impact and material surges are highest
Return side idler spacing2.5 to 3.5 m — return side carries no load, wider spacing acceptable. AI monitoring focuses on carrying side idlers where failure rate is 10x higher
AI implicationIdler spacing determines how many vibration sensor points are needed for full AI coverage — plan sensor quantity during idler specification, not after
05
Incline and Decline Limits
Maximum incline by materialLoose bulk: 15 to 18°. Packaged goods on cleated belt: up to 35°. Steep conveyors require anti-rollback mechanisms and regenerative braking on VFD
Belt tension on inclineInclined belt tension increases significantly — drives belt width and tensioning system specification. Underestimating tension is the primary cause of splice failure on inclined conveyors
Regenerative energyDownhill loaded conveyors generate regenerative energy — specify regenerative VFD to feed energy back to grid rather than dissipate in braking resistors
06
Integration Points and Transfer Zones
Transfer chute designTransfer points between conveyors are the highest-wear, highest-blockage locations in any material handling system — specify lined chutes and impact-rated idlers at every transfer
Belt scale positionsSpecify belt scale on horizontal, steady-state belt run — minimum 3 m from drive or tension point. Plan position before conveyor structure is detailed
Emergency stop pull-cordIEC 60947-5-5 / ISO 13850 pull-cord switches every 30 m of conveyor length. Cable routing for pull-cord must be shown on conveyor arrangement drawing at design
Working through conveyor specification for a greenfield plant? Book a conveyor design consultation — our engineers will review your throughput requirements, drive selection, and AI monitoring specification before equipment procurement begins.
AI Predictive Maintenance: What Every Conveyor Failure Mode Looks Like Before It Fires
Every conveyor failure mode leaves a data signature weeks before the breakdown — in vibration frequency spectra, bearing temperature trends, motor current patterns, and belt tension variations. The difference between reactive maintenance and AI predictive maintenance is not the sensor: it is the analytical model running continuously against those sensor signals, correlating multivariate patterns against known failure signatures and producing pre-computed detection windows that tell you which component is failing, how quickly, and what intervention is required. In a greenfield plant, the sensor infrastructure for this model is specified before cable trays are designed — because the cable routes from sensor locations to data concentrators must be planned when electrical routing is determined.
AI Conveyor Failure Detection Matrix — Sensor Signatures and Detection Windows
Component
Failure Mode
AI Signal Source
Detection Signature
Warning Window
Idler Bearing
Inner/outer race wear, seizure
Vibration accelerometer + temperature
BPFO/BPFI frequency harmonics rise; bearing temperature deviation begins 72 hrs before seizure
4 to 6 weeks
Drive Gearbox
Gear mesh wear, oil degradation
Vibration at GMF + oil temperature
Gear mesh frequency sidebands appear; oil temperature above baseline by 8 to 12°C
3 to 5 weeks
Belt Splice
Fatigue crack, delamination
Belt tension sensor + vibration at splice pass frequency
Tension variation pulse at splice pass frequency increases progressively — 90% of belt failures occur at splice points
2 to 3 weeks
Drive Motor
Winding deterioration, shaft misalignment
Current signature analysis (CSA) + vibration
Motor current FFT shows sideband frequencies at fault slip frequency; vibration rises at 2x line frequency
3 to 6 weeks
Belt Tracking
Edge damage, spillage, belt wander
Laser tracking sensor or vision AI at head/tail
Belt centerline deviation exceeds 25 mm threshold; rate of drift trend indicates misalignment source
Roller rotation frequency drops; acoustic signature shifts from rolling to sliding — belt fire risk within 4 to 12 hours of full seizure
Hours to days
Specify AI Sensor Infrastructure in Your Conveyor Design Before Cable Trays Are Routed
iFactory's greenfield conveyor consultation covers failure mode analysis by conveyor type, sensor placement specification, cable routing plan for data infrastructure, AI monitoring platform integration with your CMMS, and predictive maintenance alert workflow design — all delivered before conveyor equipment procurement begins.
Sensor Infrastructure Design: What to Specify at Greenfield — and Why Cable Routing Matters
The difference between a conveyor system that enables AI predictive maintenance and one that does not is not the AI software — it is the sensor infrastructure. Sensors must be specified, positioned, and cabled during greenfield design because their mounting locations, cable routes, and data concentrator positions are determined by the conveyor structure layout. Adding sensors to a commissioned conveyor system requires access platforms to be modified, cable management systems to be extended, and in many cases conduit to be surface-mounted on finished structural steel — at 4 to 8 times the greenfield cost.
Vibration Accelerometer
Drive motor housing — horizontal, vertical, axial axes
Gearbox — input and output shaft housings
Head pulley and tail pulley bearing housings
High-load idler stations at load points (every 5th idler minimum)
Triaxial MEMS accelerometers, 0.1 to 10,000 Hz range. IP67 minimum for dusty/wet environments. Wireless transmission acceptable for remote idlers; wired preferred for high-frequency analysis at drives.
Take-up system — load cell or tension transducer at take-up pulley
Drive side — motor torque feedback via VFD current measurement
Long belt runs — intermediate tension monitoring on belts over 200 m
Strain gauge load cells at take-up, 0 to 200% rated tension range. Sample rate minimum 100 Hz to capture splice pass pulses. Critical for AI splice fatigue detection — 90% of belt failures occur at splice joints.
Detects: Splice fatigue, belt elongation, take-up system failure, material surges
Thermal Imaging / IR Sensor
Fixed infrared camera at belt underside — continuous idler thermal scanning
Drive motor enclosure external surface
Electrical panel exterior at MCC
Transfer chute — detect material blockage heat signature
Fixed-mount infrared camera (stationary scanning) or mobile IR sensor per maintenance protocol. Sensor FOV must cover full belt width. Temperature resolution 0.1°C minimum for bearing pre-failure detection.
Detects: Seized idlers (belt fire precursor), motor overheating, blockage, electrical hotspots
Belt Tracking Sensor
Head end — 1 to 2 m before head pulley (both edges)
Tail end — 1 to 2 m after tail pulley
Long conveyors — mid-span tracking stations every 100 to 150 m
Laser displacement or ultrasonic edge detection sensor. 1 mm resolution minimum. Alert threshold: 25 mm deviation from centerline. Trip threshold: 50 mm (prevents edge contact with structure). Specify at design — mounting bracket welded to conveyor structure.
Detects: Belt mistracking, edge damage risk, material spillage precursor, training idler failure
Motor Current Analyzer
MCC panel — CT clamps on motor feeder cables (non-invasive)
VFD output — current feedback from VFD internal measurement
Current transformers (CTs) on motor feeder cables at MCC, 1000:1 ratio, 0.5% accuracy class. Sample rate: 10 kHz minimum for Motor Current Signature Analysis (MCSA). VFD units often have built-in current monitoring — verify data export capability at specification stage.
Piezoelectric AE sensors, 100 kHz to 1 MHz frequency range. Detects stress wave emission from crack initiation and asperity contact — earliest possible failure detection before vibration changes become measurable. Requires specialist signal processing — specify data concentrator with AE processing capability at design.
Detects: Crack initiation in bearing races and gear teeth — earliest detection of 4 to 8 weeks before vibration-detectable failure
Maintenance Strategy Comparison: Reactive vs. Scheduled vs. AI Predictive
The maintenance strategy decision for a conveyor system is made at design — not at commissioning. The sensor infrastructure, CMMS integration, and alert workflow that enable AI predictive maintenance must be specified in the design brief, not added later. Here is what each strategy delivers and costs over a 5-year horizon for a typical 200-metre production line conveyor system.
Annual maintenance cost
Unplanned downtime events / yr
Average downtime per event
Belt replacement frequency
5-year total cost
Verdict
Reactive Maintenance Run to failure
$45,000 to $80,000 / yr
8 to 14 events
6 to 18 hours
Every 18 to 24 months
$2.5M to $5M+
Highest total cost
Scheduled PM Calendar-based intervals
$60,000 to $100,000 / yr
3 to 6 events
3 to 8 hours
Every 36 months (scheduled)
$1.8M to $3.2M
Safer but wastes healthy components
Recommended
AI Predictive Maintenance Condition-based, continuous
$35,000 to $55,000 / yr
1 to 2 events
1 to 3 hours (planned)
Every 54 to 72 months (extended)
$800K to $1.4M
Lowest total cost, highest availability
Expert Perspective: Greenfield Conveyors Are the Last Time Sensor Infrastructure Is Cheap
The hardest conversation in conveyor predictive maintenance is always the same: a reliability engineer with a new conveyor system that has been running for 18 months shows us where they want to add vibration sensors and a belt tension monitoring system. We look at the conveyor structure, and the sensor mounting points require welding to finished steel. The cable routes go through finished panels that are now buried behind equipment. The data concentrator position they need is in the middle of a maintenance access walkway. Everything is possible — but it costs 6 to 10 times what it would have cost at greenfield design. A vibration accelerometer on a bearing housing, with a cable route to a data concentrator, specified in the greenfield conveyor design, costs $200 to $800 per point. The same sensor added to a commissioned conveyor system — with an access platform modification, surface-mounted conduit, and integration into an installed electrical system — costs $1,500 to $5,000 per point. Multiplied across 200 monitoring points on a 500-metre conveyor system, that is the difference between a $120,000 sensor specification and a $600,000 retrofit project. The greenfield advantage is real, measurable, and available to every project team that includes predictive maintenance sensor infrastructure in their design brief before equipment is ordered.
— iFactory Greenfield Consulting, Industrial Maintenance Practice 2025 to 2026
6 to 10x
Cost multiplier for retrofit sensor installation vs. greenfield specification
70%
Reduction in conveyor breakdowns with AI predictive maintenance
6 to 12 mo
Typical payback period for AI conveyor predictive maintenance system
Ready to include AI predictive maintenance sensor infrastructure in your greenfield conveyor specification? Talk to our conveyor reliability team — we will produce a sensor specification document and cable routing plan for each conveyor in your greenfield layout.
Specify AI-Ready Conveyors From the First Drawing — Not the First Breakdown
iFactory's greenfield conveyor design consultation covers conveyor type selection by zone, throughput capacity calculation review, drive system specification, sensor infrastructure planning (vibration, thermal, tension, tracking, current, acoustic), cable routing plan, CMMS integration architecture, and maintenance strategy design — all delivered before conveyor equipment procurement begins.
What is the most important conveyor design decision for AI predictive maintenance readiness?
The most important decision is sensor mounting provision and cable routing — not the AI software or sensor type. Sensors must be positioned on specific structural locations (bearing housings, gearbox casings, belt take-up systems) that are determined by the conveyor's structural design. Cable routes from sensor locations to data concentrators must be planned when electrical routing is determined. These are greenfield decisions: adding sensor mounting brackets requires welding to finished structural steel in a live facility, and cable routes must then be surface-mounted on completed electrical systems. A vibration sensor specified at greenfield costs $200 to $800 per point; the same sensor retrofitted to a commissioned conveyor costs $1,500 to $5,000 per point.
How far in advance does AI detect bearing failures on conveyor idlers?
AI vibration analysis detects idler bearing inner and outer race defects 4 to 6 weeks before bearing seizure in most industrial applications. The detection sequence is: acoustic emission sensors detect stress wave emission from crack initiation at 6 to 8 weeks; vibration frequency analysis reveals BPFO and BPFI frequency harmonics at 4 to 6 weeks; thermal sensors detect bearing temperature deviation 48 to 72 hours before seizure; and seizure itself — if no intervention is made — triggers a belt friction fire within 4 to 12 hours on a fully loaded system. Each detection stage provides a progressively shorter but progressively higher-confidence intervention window.
What belt speed should be specified for a greenfield manufacturing conveyor?
Belt speed selection depends on material type, lump size, and throughput requirement. For bulk materials, 2.5 to 3.5 m/s is the standard range — above 3.5 m/s causes disproportionate idler and belt wear, and below 2.5 m/s on bulk applications requires wider belts for the same capacity. For packaged goods on roller conveyors, 0.3 to 0.8 m/s prevents product damage at transfers. For precision indexing in assembly applications, 0.05 to 0.3 m/s with accurate positioning encoders. Regardless of application, specify a Variable Frequency Drive (VFD) on all conveyor motors — it allows speed optimization for energy savings, reduces mechanical stress on soft-starts, and the VFD's internal current monitoring becomes a primary AI data source for motor and drive fault detection.
Why do 90% of belt failures occur at splice joints and how does AI detect them?
Belt splices are the mechanical weakest point in any continuous belt system — they undergo tensile and flexural fatigue on every revolution as they pass over the head and tail pulleys. Fatigue cracks initiate at the splice adhesive boundary and propagate progressively, reducing splice strength by 3 to 5% per million belt revolutions under typical loading conditions. AI detects splice fatigue through belt tension sensors at the take-up system: as a damaged splice approaches each pulley, it produces a characteristic tension variation pulse at the splice pass frequency (belt speed divided by belt length). The amplitude of this pulse increases progressively as splice damage accumulates — providing a 2 to 3 week detection window before splice separation occurs.
What does iFactory's greenfield conveyor design consultation cover?
iFactory's greenfield conveyor design consultation covers your throughput requirement review and conveyor type selection by zone, capacity calculation verification (belt speed, width, and drive power), drive system recommendation (direct vs. chain vs. belt drive with VFD specification), failure mode analysis for each conveyor type in your layout, sensor infrastructure specification (vibration, thermal, tension, tracking, current, and acoustic sensors) with mounting locations, cable routing plan for data infrastructure, CMMS integration architecture for predictive maintenance alert workflow, and maintenance strategy design. All outputs are specification-ready documents your conveyor supplier and electrical contractor can build from directly. Book your greenfield conveyor design consultation here.