Industrial manufacturing accounts for 19% of total global freshwater withdrawals — reaching over 40% in high-income countries. In a greenfield plant, every water system design decision you lock in during engineering becomes a fixed cost and compliance exposure for the next 20 to 30 years. Under-sized ultrafiltration capacity creates treatment bottlenecks during production scaling. A once-through cooling system in a water-stressed region becomes a permit liability within a decade. Building without AI water monitoring means operating blind to the leaks, over-dosing events, and cooling tower blowdown inefficiencies that collectively waste 15 to 30% of total freshwater intake. Book a greenfield water system consultation to validate your treatment train, recycling architecture, and AI monitoring specification before a single pipe is routed.
Greenfield Plant Water System Design — 2026 Guide
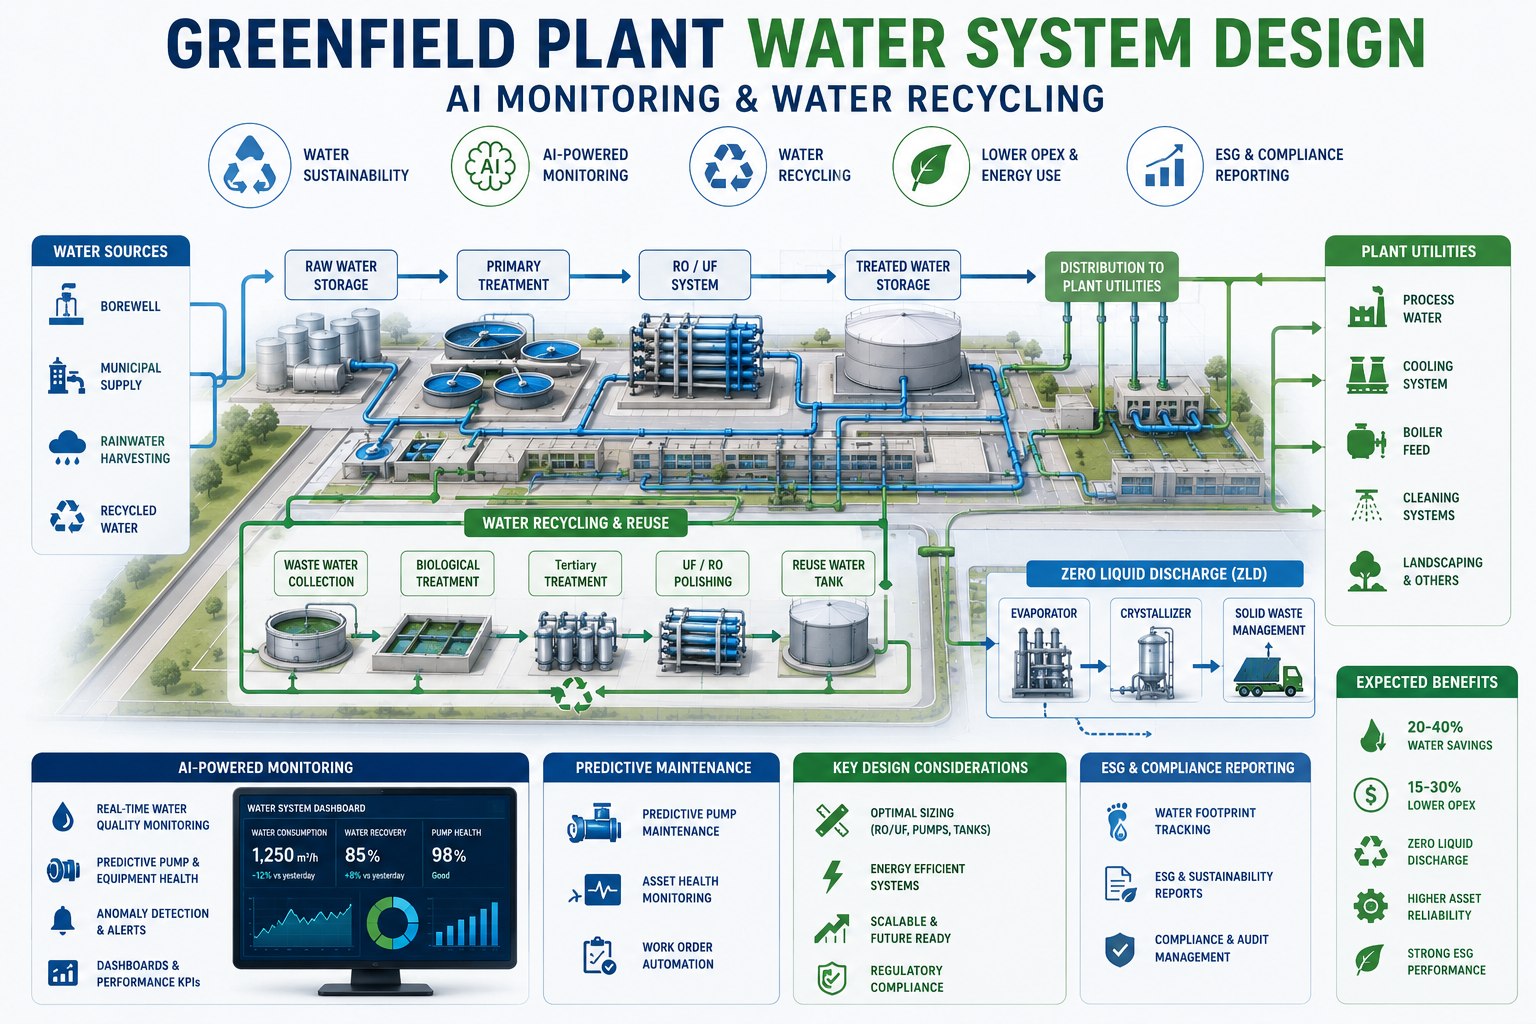
From Freshwater Intake to Zero Liquid Discharge — Every Stage You Need to Design Right
Freshwater Intake
Metered, AI-monitored
Pre-treatment
Softening, UF, multimedia
Process Use
RO, DI, cooling, CIP
Wastewater Recovery
MBR, UF, RO recycle
ZLD / Discharge
Evaporation, crystallization
90%
Freshwater reduction with closed-loop recycling system
95%
Liquid waste recovered in ZLD systems for reuse
30%
Drop in industrial water recycling costs since 2020
3.2 yr
Typical payback period for water reuse system investment
The Five Water Systems Every Greenfield Industrial Plant Needs to Design
Water system design in a greenfield plant is not a single engineering decision — it is five interdependent systems that must be designed, sized, and connected before construction begins. Each system has its own quality specifications, flow rate requirements, treatment train, and monitoring needs. Designing them in isolation creates the integration failures that surface during commissioning: cooling tower makeup quality that fouls the RO membranes, CIP water TDS that's too high for equipment spec, or wastewater streams that can't be co-treated because their chemical incompatibility wasn't identified at design.
01
Cooling Water System
Largest volume consumer
Typical quality specConductivity 500 to 2,500 µS/cm, pH 7 to 9, TDS <1,000 ppm
Treatment trainClarification → Softening → Chemical dosing → Cooling tower with blowdown control
Key design decisionCycles of concentration (CoC) target — drives freshwater makeup and blowdown volumes
AI monitors conductivity continuously, adjusting blowdown timing vs. fixed schedule — saves 15 to 25% makeup water
02
Process Water System
Quality-critical, process-specific
Typical quality specVaries by process: DI (0.1 to 18 MΩ·cm), RO permeate (<10 ppm TDS), ultrapure (<1 ppb TOC)
Treatment trainPre-treatment → UF → RO → Mixed bed DI → UV disinfection (if ultrapure)
Key design decisionRO membrane sizing — flux rate, recovery rate, and fouling allowance for your feedwater quality
AI tracks RO membrane differential pressure and permeate TDS — predicts CIP need 5 to 10 days early
03
CIP / Washdown Water
Regulatory and process quality impact
Typical quality specPotable quality minimum, hot water for thermal sanitization, high volume / short duration demand
Treatment trainMunicipal or pre-treated supply → Storage tank → CIP station with return recovery
Key design decisionCIP return recovery — pre-rinse wastewater often recyclable after pH neutralization and filtration
AI patterns CIP chemical concentrations and rinse conductivity — reduces chemical use 10 to 20% and rinse volume
04
Wastewater Treatment
Compliance and reuse gateway
Treatment trainEqualization → pH adjustment → Coagulation/flocculation → MBR or DAF → UF → RO → Discharge or reuse
Key design decisionStream segregation — incompatible wastewater streams must be treated separately before combining
Reuse potentialTreated effluent (post-RO) reusable for cooling tower makeup, landscaping, or process rinse
AI routes treated streams to optimal reuse destination based on real-time quality characterization
05
Stormwater Management
Regulatory requirement, harvest opportunity
Regulatory requirementNPDES MSGP permit in US; first-flush capture required for industrial sites in most jurisdictions
Harvest potentialRoof runoff collection for cooling tower makeup after sand filtration — reduces freshwater intake 3 to 8%
Key design decisionFirst-flush diversion volume and basin sizing — underestimating creates permit violation risk
AI weather integration pre-positions stormwater basins ahead of predicted rain events — prevents overflow events
How are these five systems connected in your current greenfield water design? Book a water system design consultation — our engineers will map your treatment train interdependencies and identify integration risks before your P&IDs are finalized.
ZLD vs. MLD vs. Conventional Discharge: Choosing Your Water Recovery Architecture
The water recovery architecture you choose for a greenfield plant determines your freshwater dependency, discharge permit exposure, and ESG water intensity trajectory for the building's life. Three architectures exist — and the right choice depends on your water source reliability, local discharge permit tightness, production water volume, and capital budget. Choosing the wrong architecture creates either excess CapEx (ZLD where conventional discharge was viable) or a compliance cliff when discharge limits tighten (conventional discharge when water stress was predictable).
Decision Factor
Conventional Discharge
MLD (Minimal Liquid Discharge)
ZLD (Zero Liquid Discharge)
Water Recovery Rate
0 to 40% — most water discharged
85 to 95% — minimal discharge volume
95 to 100% — no liquid effluent
CapEx (vs. conventional)
Baseline
1.8 to 2.5x baseline
3 to 5x baseline
Freshwater Intake Reduction
Low
60 to 80%
85 to 95%
When to choose
Water-abundant location, loose discharge permits, low water-intensive process
Water-stressed region, moderate discharge limits, medium process water volume
Regulated zero-discharge zones, severe water scarcity, pharmaceuticals / semiconductors
Technology added over conventional
Basic ETP, pH adjustment, settling
MBR or UF + RO recycle loop + brine management
MBR + UF + RO + evaporator + crystallizer
ESG / investor alignment
Minimal — increasing scrutiny from CDP and GRI assessors
Strong — aligns with GRI 303 and CDP Water targets
Best-in-class — full ESG alignment, permit-proof
Payback period
N/A — no reuse revenue or savings
3 to 5 years
5 to 9 years (shorter where freshwater is expensive)
Validate Your Water Recovery Architecture Before Equipment Is Specified
iFactory's greenfield water system consultation covers your water source risk assessment, ZLD vs. MLD vs. conventional discharge decision analysis, treatment train sizing, and AI monitoring specification — validated in a digital twin before your water system P&IDs are issued for construction.
RO and UF Sizing: The Engineering Decisions That Drive Membrane Performance
Reverse osmosis and ultrafiltration membranes are the performance heart of most industrial water recycling systems — but they are also the most common source of design errors in greenfield water systems. Over-specifying flux rate produces low recovery and high reject volumes. Under-designing pre-treatment creates accelerated fouling that cuts membrane life in half. Getting the feedwater quality assumptions wrong generates a system that hits design recovery at commissioning but degrades to 60% recovery within 18 months as the membranes foul on unaccounted foulants.
Ultrafiltration (UF)
Pre-treatment and coarse separation
Pore size0.01 to 0.1 µm — removes bacteria, viruses, colloids, suspended solids
Typical flux rate40 to 80 LMH (L/m²/hr) — reduces to 20 to 40 LMH for high-turbidity feedwater
Recovery rate90 to 95% — 5 to 10% lost to backwash and CIP reject
Key sizing errorSpecifying flux rate at clean membrane — must design for fouled membrane flux (30 to 50% lower) to avoid capacity loss
AI monitors transmembrane pressure continuously — predicts CEB or CIP 5 to 14 days before performance threshold
Reverse Osmosis (RO)
Desalination and high-purity production
Separation mechanismPressure-driven diffusion — removes dissolved salts, organics, TDS to <10 ppm permeate
Recovery rate65 to 85% for single-pass industrial RO — concentrate management required for remainder
Operating pressure7 to 17 bar for brackish water RO — higher for seawater or high-TDS concentrate loops
Key sizing errorUnderestimating Langelier Saturation Index (LSI) in concentrate — causes calcium carbonate scaling and rapid membrane failure
AI tracks normalized permeate flow and salt rejection daily — detects scaling and biofouling signatures 10 to 21 days before performance loss
Membrane Bioreactor (MBR)
Biological treatment + UF in one unit
What it doesCombines activated sludge biological treatment with membrane filtration — produces high-quality effluent suitable for RO feed
Effluent qualityBOD <5 mg/L, TSS <2 mg/L, turbidity <0.5 NTU — significantly cleaner than conventional biological treatment
When to useHigh-organics wastewater (food processing, pharma, chemical) that requires biological treatment before membrane reuse loop
Key design considerationMLSS (Mixed Liquor Suspended Solids) control — maintains biological performance and membrane permeability balance
AI monitors MLSS, DO, and membrane flux simultaneously — adjusts aeration and backwash cycles to minimize energy while protecting biology
AI Water Monitoring: What Continuous Intelligence Changes in Plant Water Management
Most industrial plants track water the same way they tracked energy a decade ago — as a monthly utility bill divided by total output. That approach hides the inefficiencies that AI water monitoring makes visible: cooling tower blowdown running on fixed schedules, undetected leaks in underground piping, chemical over-dosing from delayed lab results, and RO membranes fouling weeks before they show up in a manual performance review. AI monitoring turns every meter, sensor, and analyzer in your water system into a continuous quality and efficiency signal.
Real-Time Water Balance
Identifies 8 to 15% hidden waste
AI aggregates all water meters at intake, process use points, recycle return, and discharge — building a live water balance that instantly surfaces consumption anomalies. Undetected leaks, meter drift, and unauthorized draws become visible within hours, not billing cycles.
Cooling Tower Optimization
15 to 25% makeup water savings
AI monitors conductivity and controls blowdown timing based on actual cycles of concentration — replacing fixed-schedule blowdown that wastes usable water. Also tracks drift eliminator performance and adjusts chemical dosing for biocide and scale inhibitor in real time against measured water chemistry.
Membrane Performance Monitoring
50% reduction in unplanned failures
AI tracks normalized permeate flow, salt rejection, and transmembrane pressure for all RO and UF units — detecting the early signatures of scaling, biofouling, and physical damage weeks before performance drops below specification. CIP is scheduled proactively, not reactively.
Discharge Quality Assurance
Continuous compliance monitoring
AI monitors effluent quality parameters — pH, COD, TSS, conductivity, and specific contaminants — in real time against permit limits. Breach prediction alerts allow corrective action before a permit exceedance event occurs. Automated discharge records are generated continuously for regulatory reporting.
Chemical Dosing Optimization
10 to 20% chemical cost reduction
AI replaces time-delayed lab-result-based dosing with continuous online analyzer feedback — adjusting coagulant, biocide, antiscalant, and pH correction doses in real time. Over-dosing driven by conservative manual schedules is eliminated, reducing chemical spend and sludge generation simultaneously.
Predictive Pump Maintenance
60 to 80% fewer unplanned failures
AI monitors pump vibration, bearing temperature, power draw, and flow rate against learned performance baselines — detecting cavitation, impeller wear, seal degradation, and bearing failure signatures 7 to 21 days before failure. Water system uptime is maintained without over-maintaining healthy equipment.
Specifying your water system sensor and monitoring architecture? Book a greenfield water monitoring consultation — we will walk through your treatment train and specify exactly which sensor points are needed to enable AI monitoring from commissioning day one.
ESG Water Reporting: What Greenfield Plants Need to Build In From Day One
Water is now a material ESG metric for industrial manufacturers. GRI 303 (Water and Effluents), CDP Water Security questionnaire, ISSB IFRS S2, and major retail and supply chain customer audits all require water intensity data, water source characterization, and discharge quality documentation that most legacy plants cannot produce without months of manual data assembly. A greenfield plant built with AI water monitoring has an inherent ESG data advantage — continuous, meter-level water balance data is generated automatically, making what was a quarterly compliance exercise into a real-time management tool.
Water ESG Reporting Framework — What You Need to Track and What AI Delivers
ESG Framework
Key Water Disclosure Required
Without AI Monitoring
With AI Water Monitoring
GRI 303
Water withdrawal by source, water intensity per unit, discharge quality by destination
Monthly utility bills + quarterly lab results — significant gaps and estimation
Continuous meter-level data, automatic intensity calculation per production unit, real-time discharge quality log
CDP Water
Water risk assessment, water-stressed location identification, reduction targets with baseline data
Annual survey-based responses — limited granularity, difficult to substantiate with process-level data
Location water stress index integrated with facility data — targets tracked against continuous consumption baseline
ISSB / IFRS S2
Physical water risk disclosure, transition risk, resilience under climate scenarios
Qualitative narrative — auditors increasingly flagging as insufficient for material water-risk industries
Quantitative water resilience data — plant reuse rate, freshwater dependency reduction, ZLD system performance
Customer Audits
Supplier water footprint, water reduction commitments, discharge compliance history
Periodic snapshots — cannot demonstrate continuous compliance or trend performance
Continuous compliance record with trend data — any period, any parameter, instantly retrievable for audit
Expert Perspective: Why AI Water Intelligence Is a Greenfield Design Decision, Not a Retrofit
The water system design decision that most greenfield projects get wrong is not the treatment technology — it is the monitoring architecture. Plants specify RO systems, MBRs, and cooling towers correctly, then install five meters total and wonder why they cannot produce GRI 303 water intensity data or explain a 12% increase in freshwater consumption. AI water monitoring requires flow meters at every process feed and return, online analyzers at treatment boundaries, pump power monitoring, and continuous discharge quality sensors. The incremental cost of adding this instrumentation during greenfield construction is 1 to 2% of water system CapEx. The cost of retrofitting it into a live facility — with existing underground piping, process interruptions, and confined space requirements — is typically 6 to 10 times that figure. Every water system designed without AI monitoring instrumentation in 2026 is a manual reporting burden and an efficiency blind spot for its operational life.
— iFactory Greenfield Consulting, Water System Practice 2025 to 2026
90%
Freshwater intake reduction achievable with closed-loop industrial water recycling
6 to 10x
Cost multiplier for retrofitting AI water monitoring vs. specifying it at greenfield design
47%
Documented freshwater intake reduction at a food and beverage plant after full water recycling deployment
Ready to build AI water intelligence into your greenfield design? Talk to our water system team — we will review your current sensor specification and confirm your monitoring architecture is AI-ready before P&IDs are issued.
Design Your Greenfield Water System for AI Monitoring, Recycling, and ESG Compliance
iFactory's greenfield water system consultation covers your five-system water architecture, ZLD vs. MLD architecture decision, RO and UF sizing review, AI monitoring sensor specification, and ESG reporting data architecture — all validated before your water system P&IDs are issued. One consultation. Concrete design output.
Frequently Asked Questions
What is the difference between ZLD and MLD and when should each be chosen for a greenfield industrial plant?
Zero Liquid Discharge (ZLD) systems recover 95 to 100% of wastewater for reuse — including thermal treatment stages such as evaporation and crystallization — leaving only solid residues. Minimal Liquid Discharge (MLD) reduces liquid waste volumes by 85 to 95% through membrane filtration without the higher-cost thermal stage. ZLD is appropriate for regulated zero-discharge zones, water-scarce locations, or industries with strict effluent standards such as pharmaceuticals and semiconductors. MLD is the better economics choice for most industrial greenfield plants in moderately water-stressed regions where some discharge is permitted — delivering 60 to 80% freshwater intake reduction at 1.8 to 2.5 times conventional CapEx versus 3 to 5 times for full ZLD.
What is the most common RO membrane sizing error in greenfield water systems?
The most common RO sizing error is specifying flux rate and recovery based on clean membrane performance rather than fouled membrane design conditions. Clean membrane flux is typically 30 to 50% higher than the sustainable long-term operating flux for industrial feedwaters. Systems sized to clean membrane specs run at design recovery at commissioning but degrade to 60 to 70% recovery within 12 to 18 months as fouling accumulates. The second most common error is underestimating the Langelier Saturation Index in the concentrate loop — which causes calcium carbonate scaling on the last-element membranes and can result in irreversible membrane damage within months of operation.
What water monitoring sensors should be specified at greenfield design to enable AI water management?
AI water management requires flow meters at every process feed and return connection (not just the main intake and discharge), online analyzers for conductivity, pH, turbidity, and TOC at treatment train boundaries, differential pressure transmitters across each membrane bank, pump power meters for all major water system pumps, dissolved oxygen sensors in biological treatment stages, and continuous effluent quality monitoring for regulated discharge parameters. The incremental CapEx of this instrumentation during greenfield construction is 1 to 2% of water system cost — compared to 6 to 10 times that figure for retrofitting into a live facility with existing underground infrastructure.
How does AI water monitoring support ESG reporting for GRI 303 and CDP Water compliance?
GRI 303 requires water withdrawal by source, water intensity per unit of production, and discharge quality by receiving environment. CDP Water requires water risk assessment, stressed location identification, and reduction targets with baseline data. Both require continuous, substantiated data rather than annual estimates. AI water monitoring generates meter-level water balance data continuously — calculating water intensity automatically per production unit, tracking discharge quality in real time, and producing audit-ready reports aligned with GRI 303, CDP Water, and BRSR requirements. What was a quarterly manual data assembly exercise becomes a daily automated data product that auditors and investors can verify at the level of granularity they increasingly demand.
How does iFactory's greenfield water system consultation work and what does it cover?
iFactory's greenfield water system consultation is a structured engineering review that covers your five-system water architecture and interdependency mapping, ZLD vs. MLD vs. conventional discharge decision analysis against your location water stress and permit outlook, RO and UF membrane sizing review against your feedwater quality data, AI monitoring sensor specification and instrumentation schedule, and ESG water reporting data architecture. The output is a concrete design recommendation document — not a vendor pitch.
Book your greenfield water system consultation here.