Most plants track too many KPIs. The industry average is 37 metrics per plant. High-performing plants run scorecards of 8 to 12 KPIs at the plant director level and 3 to 5 at the operator level — focused, owned, and reviewed at a defined cadence. The 15 KPIs in this guide are the canonical set: they cover 95% of what a smart factory needs to manage, span the five categories every plant director needs visibility on, and translate directly into the dashboards, reviews, and improvement programs that move OEE from 50% to 85%+. Each KPI listed below includes its formula, world-class benchmark, the failure mode it surfaces, and the cadence it should be reviewed at. Book a smart factory KPI architecture consultation to design the right scorecard for your plant — connected to your PLCs, CMMS, and ERP for real-time visibility from day one.
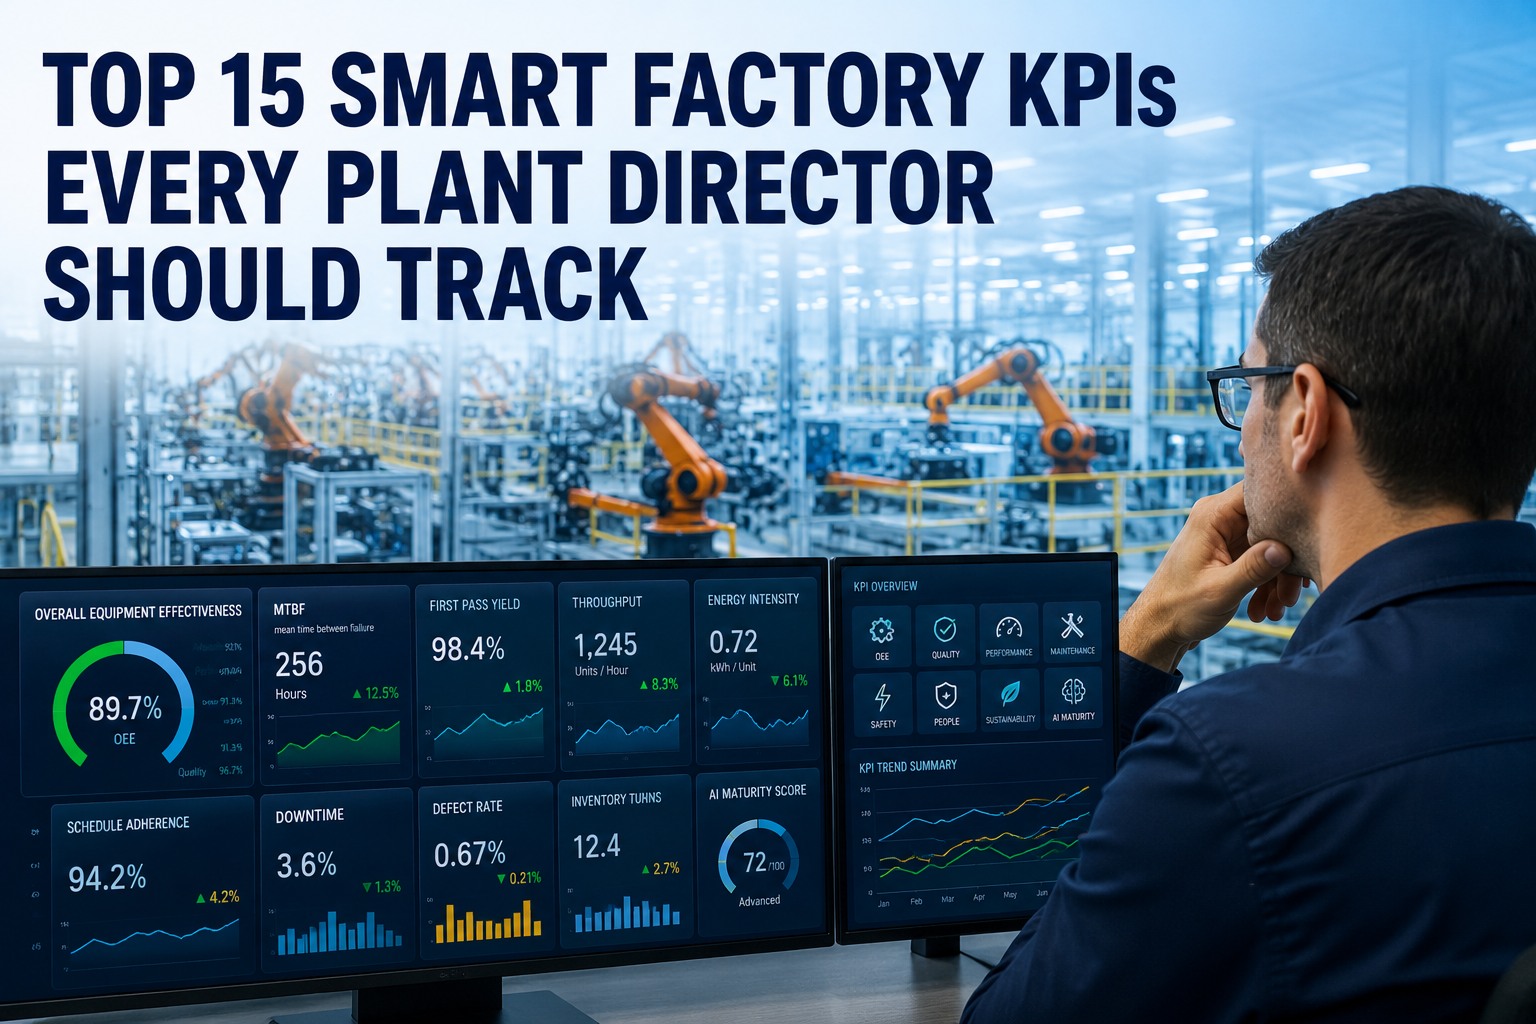
Smart Factory KPIs — Plant Director Scorecard 2026
The 15 Metrics That Drive Every World-Class Plant
Equipment Effectiveness
5 KPIs
OEE · Availability · Performance · Quality Rate · Cycle Time
Reliability & Maintenance
3 KPIs
MTBF · MTTR · PM Compliance
Quality & Yield
2 KPIs
FPY · Scrap Rate
Throughput & Delivery
3 KPIs
Throughput · OTD · Schedule Adherence
Smart Factory Maturity
2 KPIs
Energy Intensity · AI Maturity Score
8–12KPIs on a high-performing plant director scorecard — not 37
85%+World-class OEE — only a small percentage of plants achieve it
50–65%Typical OEE — most plants sit here, with no real-time visibility
6–8 wkPayback timeline once KPIs go from manual to real-time
Category 1: Equipment Effectiveness (5 KPIs)
Equipment effectiveness KPIs answer the question: how productively is your asset base running compared to its ideal? OEE is the headline metric, but the three components — availability, performance, and quality — each surface a different category of loss. Watching only the OEE number without its components hides the actual root cause of every problem it signals.
01
Overall Equipment Effectiveness (OEE)
OEE = Availability × Performance × Quality
World class
85%+
Typical
50–65%
Daily review · Operator dashboard
02
Availability
(Planned Production Time − Downtime) ÷ Planned Production Time
World class
90%+
Typical
75–85%
Daily · Surfaces downtime patterns
03
Performance
(Ideal Cycle Time × Units Produced) ÷ Actual Run Time
World class
95%+
Typical
75–90%
Daily · Detects speed losses, micro-stops
04
Quality Rate
Good Units ÷ Total Units Produced
World class
99.9%+
Typical
95–99%
Per cycle · First-pass production losses
05
Cycle Time
Actual production time per unit (compared to ideal)
World class
±2% ideal
Typical
+10–20%
Per cycle · Bottleneck detection
Category 2: Reliability & Maintenance (3 KPIs)
Reliability KPIs measure how well your maintenance program actually works. A high MTBF says assets stay up longer between failures. A low MTTR says when they fail, you recover fast. PM Compliance tells you whether your preventive program is being followed — or being skipped under production pressure. Together they predict the next month of unplanned downtime.
06
Mean Time Between Failures (MTBF)
Total Operating Time ÷ Number of Failures
World class
5,000+ hrs
Typical
1,500–3,000 hrs
Weekly · Drives predictive maintenance
07
Mean Time To Repair (MTTR)
Total Repair Time ÷ Number of Repairs
World class
<2 hrs
Typical
4–8 hrs
Weekly · Detects spares and skill gaps
08
PM Compliance Rate
PMs Completed On-Time ÷ PMs Scheduled
World class
95%+
Typical
70–85%
Weekly · Predicts next month's failures
Want a real-time KPI dashboard that connects MTBF, MTTR, and PM compliance automatically across every asset? Book a smart factory KPI demo — see your full scorecard in one view.
Category 3: Quality & Yield (2 KPIs)
Quality KPIs surface the cost of rework, scrap, and warranty claims that the OEE number alone hides. FPY is the most powerful — it tells you the percentage of units that pass first time without rework. A plant with high OEE but low FPY is producing fast but reworking heavily — and the real cost is invisible until FPY is on the scorecard.
09
First Pass Yield (FPY)
Units Passed First Inspection ÷ Total Units Started
World class
98%+
Typical
85–95%
Per shift · Detects process drift
10
Scrap Rate
Scrapped Units ÷ Total Units Produced
World class
<0.5%
Typical
2–5%
Per shift · Direct material cost impact
Category 4: Throughput & Delivery (3 KPIs)
Throughput and delivery KPIs connect plant performance to customer commitments. Throughput measures how fast units come off the line. On-Time Delivery tells you whether your customers received what they ordered when they wanted it. Schedule Adherence reveals whether your plant is running to the plan — or running its own plan invisibly.
11
Throughput
Units Produced ÷ Time (per shift, day, week)
World class
95% of design
Typical
70–85%
Real-time · Shift-end review
12
On-Time Delivery (OTD)
Orders Shipped On-Time ÷ Total Orders Shipped
World class
98%+ (auto T1)
Typical
88–95%
Weekly · Customer commitment health
13
Schedule Adherence
Actual vs. Planned Production for the Period
World class
95%+
Typical
75–90%
Daily · Planning system trust
Get Every KPI Calculated in Real Time From Your PLC, CMMS & ERP Data
iFactory connects to your PLCs, SCADA, CMMS, and ERP to calculate all 15 KPIs automatically — updated every production cycle. Operators see their KPIs on the floor. Managers see plant-wide trends and drill into any metric by shift, product, or machine. No spreadsheets, no delays, no manual consolidation.
Category 5: Smart Factory Maturity (2 KPIs)
The newest category on every plant director's scorecard. Energy Intensity connects to ESG and ISO 50001 reporting and is increasingly demanded by customers and lenders. AI Maturity Score quantifies your plant's progress along the Industry 4.0 path — a metric you cannot improve without measuring, and one that boards now ask about quarterly.
14
Energy Intensity
kWh Consumed ÷ Units Produced (or tonne, m², etc.)
World class
−15% vs. baseline
Typical
flat or +5%
Monthly · ISO 50001 / ESG reporting
15
AI Maturity Score
Composite: data availability, model coverage, action loop completeness
World class
Stage 5: Autonomous
Typical
Stage 2–3
Quarterly · Board-level metric
The Five Stages of Smart Factory Maturity
Where your plant lands on the maturity ladder determines which KPIs you can actually measure today — and which still require infrastructure investment. Most plants overestimate their current stage. Honest stage assessment is the foundation of every smart factory roadmap.
Stage 1
Manual Operations
OEE: 35–50%
Production tracking via logbooks and whiteboards. End-of-shift reports. KPIs reconstructed manually from paper records.
Stage 2
Basic Digitisation
OEE: 45–55%
Spreadsheets and basic ERP entries. Some machine data captured. Most KPIs still calculated weekly, retrospectively.
Stage 3
Connected Visibility
OEE: 50–65%
Key lines monitored in real time. Live OEE, downtime, and quality dashboards. Daily management reviews use real data.
Stage 4
Integrated Intelligence
OEE: 65–75%
Bidirectional ERP and quality integration. Condition-based maintenance. Energy integrated with production tracking.
Stage 5
Autonomous Optimisation
OEE: 75–85%+
AI predicts failures and quality deviations. Process parameters self-adjust. Digital twins enable virtual commissioning.
From Data to Decision: The Review Cadence That Makes KPIs Move
KPIs that are published but never discussed are decoration, not management tools. The cadence at which a KPI is reviewed determines whether it changes behaviour. Operational metrics need daily attention. Tactical metrics need weekly review. Strategic metrics need monthly business reviews. Match the cadence to the metric's planning horizon — or accept that the metric is reporting, not management.
Daily Stand-up
Plant Director · Shift Managers · Maintenance Lead
OEEAvailabilityPerformanceQuality RateThroughputSchedule Adherence
Decisions: today's recovery actions, today's resource allocation
Weekly Operations Review
Plant Director · Functional Leads · Customer Service
FPYScrap RateMTBFMTTRPM ComplianceOn-Time Delivery
Decisions: this week's improvement priorities, root cause investigations
Monthly Business Review
Plant Director · Site Leadership · Group HQ
Energy IntensityAI Maturity ScoreCycle Time Trend
Decisions: strategic initiatives, CapEx priorities, board reporting
Expert Perspective: Why Tracking the Wrong KPIs Is Worse Than Tracking Nothing
A KPI that nobody owns, nobody discusses, and nobody acts on is worse than no KPI at all — because it creates the illusion of management while consuming the time of the people who calculate it. The most common failure pattern we see in plants is a dashboard with 30+ KPIs displayed on a screen nobody looks at, while the plant director still relies on the morning walk-around to know how production actually went. The fix is not better dashboards. The fix is a focused scorecard of 8 to 12 KPIs, each one owned by a named individual, each one reviewed at a defined cadence, and each one tied to a specific decision it would trigger if it moved. When KPIs pass that test — owned, reviewed, actionable — every one of them moves. When they fail it, nothing moves regardless of how many KPIs are on the wall.
— iFactory Smart Factory Practice, Plant Performance Engineering 2025 to 2026
37
Industry average KPIs per plant — most never reviewed
8–12
KPIs on a high-performing plant director scorecard
95%
Of plant management needs covered by 15 canonical KPIs
Ready to design a focused, owned, actionable KPI scorecard for your plant? Talk to our KPI architecture team — we will build the right scorecard for your operation.
Move From 37 KPIs Nobody Reads to 15 KPIs That Drive Every Decision
iFactory's KPI architecture engagement covers your scorecard design across all five categories, KPI ownership assignment, review cadence design, real-time calculation from PLC, CMMS, and ERP data, operator dashboard rollout, and benchmark setting per asset and product code — delivered ready for daily, weekly, and monthly management reviews.
Frequently Asked Questions
How many KPIs should a plant director actually track?
A plant director scorecard should contain 8 to 12 KPIs — not the 37 that the average plant collects. High-performing plants follow a rule of thumb: every KPI on the scorecard must be linked to a named owner accountable for the metric and a specific action it would trigger if it moved. If a metric fails that test, it is information rather than a KPI and should be removed from the scorecard or moved to a reference dashboard. At the operator level, 3 to 5 KPIs is the maximum — anything beyond that becomes wallpaper and is ignored within a few weeks. The 15 KPIs in this guide are the canonical set: the plant director typically owns 10 to 12 of them directly, with the remaining 3 to 5 owned by functional leads (maintenance, quality, planning, energy) but visible on the plant director dashboard.
What is a good OEE benchmark for a smart factory in 2026?
World-class OEE is generally considered to be 85% or higher and is achieved by only a small percentage of manufacturers globally. The typical plant operates in the 50 to 65% range, which represents significant improvement potential through structured availability, performance, and quality programmes. Plants operating below 60% almost always have either no real-time visibility or no consistent OEE calculation methodology — fixing the measurement infrastructure typically lifts OEE 5 to 10 percentage points within 90 days simply through awareness and accountability effects, before any process improvements are made. Benchmarks vary by industry: automotive tier 1 supplier OEE benchmarks reach 90%+, process industries (chemicals, cement, food) typically run 70 to 85%, while job-shop and high-mix low-volume plants often sit in the 55 to 70% range due to changeover loss.
Which KPI delivers the biggest improvement opportunity for most plants?
For plants with no prior predictive maintenance programme, the biggest single improvement opportunity is typically Unplanned Downtime Frequency — eliminating even 2 to 3 unplanned stoppages per month cascades into OEE, MTBF, Availability, Schedule Adherence, and On-Time Delivery improvements simultaneously. The second-highest impact KPI for most plants is PM Compliance — plants running below 80% PM compliance almost always show elevated unplanned failure rates 30 to 60 days later. For plants with mature maintenance programmes already at high PM compliance, the next opportunity layer is FPY (First Pass Yield) — typically 5 to 15 percentage point improvement is achievable through SPC, real-time quality monitoring, and root-cause loops that act on every defect rather than batching corrections.
How do energy intensity and AI maturity KPIs fit into a manufacturing scorecard?
Energy Intensity (kWh consumed per unit produced) is increasingly a board-level metric because of ISO 50001 reporting requirements, ESG disclosure mandates, and customer pressure from lower-tier supply chain auditing. Most plants track total energy consumption but not energy per unit — making it impossible to separate the impact of production volume changes from genuine efficiency improvements. AI Maturity Score is a composite metric that captures where your plant sits on the 5-stage maturity ladder — data availability, model coverage, action loop completeness. It is reviewed quarterly rather than daily, used for board-level strategic discussions and CapEx prioritisation. Both metrics belong on the plant director scorecard but with monthly or quarterly cadence — not daily — because the underlying behaviours change slowly and the metrics are noisy at short intervals.
How does iFactory calculate and deliver these 15 KPIs in real time?
iFactory connects to your PLCs and SCADA via OPC-UA gateway, your CMMS via REST API, and your ERP via standard connectors — calculating all 15 KPIs automatically per production cycle, per shift, per product code, and per asset. Ideal cycle time, quality specification limits, and energy intensity benchmarks are set per product code from your ERP or iFactory product master, so multi-product OEE, FPY, and energy intensity reflect the actual product mix running at any given time. Operators see their immediate KPIs on shop-floor dashboards; managers see plant-wide trends and drill into any metric by shift, product, or machine. No spreadsheets, no manual consolidation, no end-of-shift reconciliation.
Book your KPI architecture demo here.