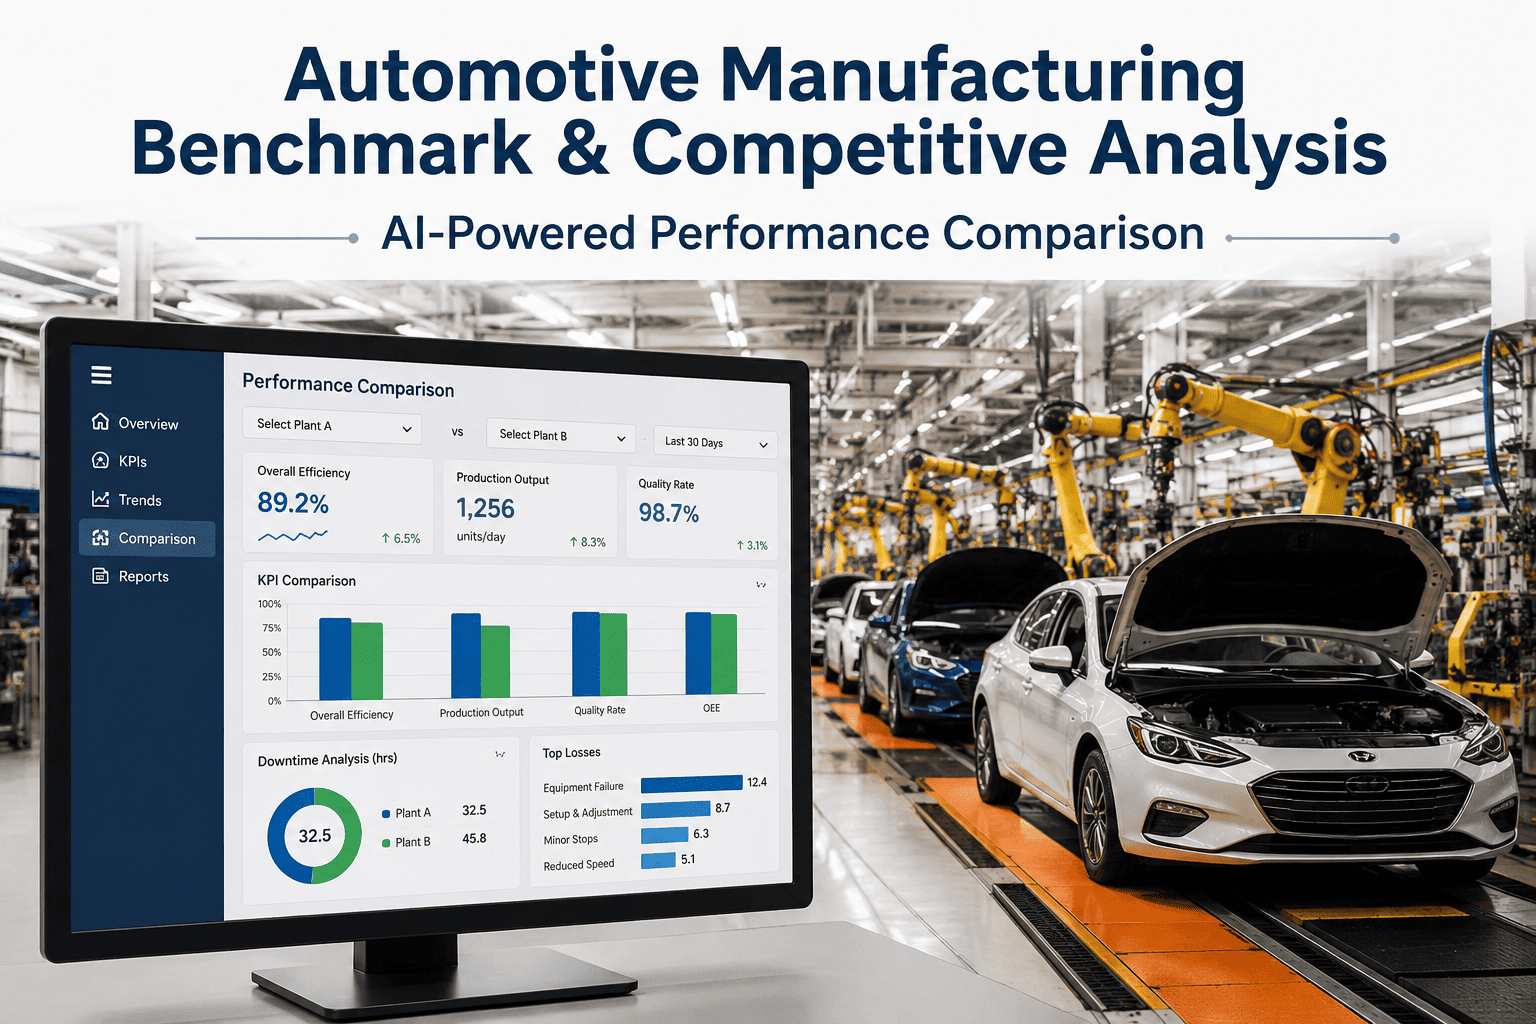
Most automotive plant leaders can recite their own OEE, scrap rate, and delivery performance from memory, but far fewer can say with confidence how those numbers stack up against the top quartile of plants running the same product mix. That gap between knowing your own number and knowing where it sits on the competitive curve is exactly where budget gets misallocated, improvement targets get set too low, and capital gets approved for the wrong project. A structured competitive benchmark closes that gap by translating raw plant data into a defensible position against class-leading automotive operations. Book a demo to see how iFactory turns your floor data into a live benchmark instead of a once-a-year consulting slide.
Stop Guessing Where Your Plant Ranks Against Class-Leading Automotive Operations
iFactory continuously compares your OEE, quality PPM, delivery performance, and cost metrics against automotive-specific benchmark bands, so VP Operations teams walk into every capital and staffing decision with a real competitive position instead of a guess.
Internal Trend Lines Answer "Are We Improving." Benchmarks Answer "Are We Winning."
A plant can post steady quarter-over-quarter OEE gains and still be losing ground competitively if the rest of the industry is improving faster. This is the central blind spot of internally-focused performance reviews: they measure a plant against its own history rather than against the field it actually competes with for allocated production volume, new program awards, and executive investment. Automotive OEMs and Tier 1 buyers do not evaluate suppliers against last year's numbers in isolation, they evaluate them against every other plant bidding for the same business.
Recent industry data puts this in sharp relief. World-class OEE in high-volume automotive assembly and stamping now sits at 88 to 90 percent, against an industry average closer to 70 to 75 percent, and the gap between typical and world-class performance in automotive Tier 1 plants is driven almost entirely by reactive rather than condition-based maintenance. A plant sitting comfortably at 74 percent OEE may feel like it is performing well relative to its own three-year trend, while sitting in the bottom half of its actual competitive set. Benchmarking exists to surface that distinction before a customer sourcing decision does it for you.
Four Metrics Every VP Operations Should Be Benchmarking This Quarter
Where Below-Average, Average, and World-Class Plants Actually Diverge
Benchmark numbers only become useful when they are broken into tiers a plant leader can map their own facility onto honestly. The table below organizes the most commonly tracked automotive plant metrics into three performance bands, drawn from current industry benchmark reporting across OEE, quality, and delivery data.
| Metric | Below Average | Industry Average | World-Class |
|---|---|---|---|
| OEE | Under 65% | 70–75% | 88–90% |
| Supplier Quality PPM | Above 500 | 150–500 | Under 50 |
| Unplanned Downtime | Above 15% | 8–12% | Under 5% |
| Changeover Time | Above 45 min | 20–30 min | Under 10 min |
| First Pass Yield | Under 92% | 95–98% | 99.9%+ |
| On-Time Delivery | Under 90% | 93–97% | 99%+ |
The most dangerous mistake in this exercise is comparing manually tracked figures against automatically measured benchmark data. Manual OEE tracking is systematically 8 to 12 percentage points higher than reality because micro-stops, short unplanned pauses, and optimistic cycle time assumptions rarely make it into a paper log. Before positioning your plant on this table, confirm the underlying measurement method matches the one used to build the benchmark, or the comparison itself becomes misleading. Contact support if you want help auditing your current measurement methodology before you benchmark against it.
The Gap Between Typical and World-Class Is Rarely a Single Cause
Plant leaders often assume the gap between their own performance and the world-class band comes down to equipment age or capital investment, but benchmark data across hundreds of plants tells a more specific story. The single largest driver separating typical automotive Tier 1 performance from world-class performance is the shift from reactive to condition-based maintenance, not newer machines. Facilities that catch bearing wear, motor degradation, and tooling fatigue before failure consistently sit in the upper range of every benchmark band, regardless of how old the underlying equipment is.
Benchmarking Against the Wrong Peer Group Is Worse Than Not Benchmarking At All
The single most common error in automotive plant benchmarking is not a bad number, it is a bad comparison. A stamping line running a single high-volume part number and a job-shop machining cell running forty part numbers across shared equipment operate under fundamentally different loss structures, and applying the same world-class ceiling to both produces a target that is either meaningless or actively demoralizing. The 88 to 90 percent world-class OEE band applies specifically to high-volume, repetitive discrete manufacturing with fast, well-optimized changeovers. A high-mix cell benchmarked against that ceiling will always appear to be underperforming, even when it is executing at the top of its own realistic category.
Building an honest peer group starts with three filters: production volume and dedication, changeover frequency, and regulatory or validation overhead. A plant running validated safety-critical components with mandatory inspection holds should not be benchmarked against a plant with no such requirement, even if both are technically classified as automotive manufacturing. The goal of peer group selection is not to find the most flattering comparison, it is to find the comparison that produces an improvement target the plant can actually act on. A realistic, well-matched peer group of similar plants, even a smaller sample, generates more useful guidance than a broad industry average blended across radically different production models.
| Plant Profile | Realistic OEE Ceiling | Primary Loss Driver |
|---|---|---|
| Dedicated High-Volume Line | 88–90% | Unplanned downtime |
| High-Mix Machining Cell | 75–82% | Changeover frequency |
| Validated Safety-Critical Line | 72–78% | Inspection and hold time |
| Legacy Mixed-Age Equipment | 70–76% | Reactive maintenance events |
Once the correct peer group is established, the benchmark stops being an abstract industry statistic and becomes a specific, defensible target that a VP Operations team can present to executive leadership, a customer quality audit, or a capital request committee without the comparison itself being the first thing challenged in the room.
A Four-Quarter Path From Industry Average Toward World-Class Positioning
Closing a full benchmark gap in a single year is rarely realistic and chasing it too aggressively tends to produce short-lived gains that erode by the next audit cycle. A more durable approach sets a specific, trackable improvement target for each quarter, tied to one driver at a time rather than the aggregate OEE number.
The Same Benchmark Data Answers Different Questions for Different Roles
One reason benchmark exercises stall inside a single quality report is that the same underlying data answers very different questions depending on who is reading it. A VP Operations team uses the benchmark primarily to prioritize capital and staffing decisions across multiple plants, asking which facility has the widest gap and the clearest path to close it. A plant manager uses the same numbers to set a floor-level improvement cadence, translating a quarterly target into specific shift-level actions on specific lines. A quality manager uses the PPM and first pass yield columns specifically to prepare for customer audits and supplier scorecard conversations, where the exact defect definition and measurement method matter as much as the headline number itself.
A reliability or maintenance engineer reads the same benchmark table through the lens of availability and unplanned downtime, using the gap between current and target performance to justify a shift toward condition-based monitoring on specific asset classes rather than a blanket maintenance policy change across the whole plant. When a single benchmark dataset is shared consistently across these roles, rather than each function tracking its own disconnected version of the numbers, the organization avoids a common failure mode where operations, quality, and maintenance teams each believe they are hitting their targets while the plant as a whole continues to sit below its peer group on the metrics that actually determine program awards and customer trust.
Four Ways Plants Misread Their Own Competitive Position
A benchmark is only as useful as the accuracy of the comparison behind it. These four mistakes show up repeatedly in plants that believe they are performing better, or worse, than they actually are relative to the field.
Each of these four mistakes shares a common thread: they make a plant's competitive position look either better or worse than it actually is, and both directions carry real cost. Overstating performance delays the maintenance and process investments a plant genuinely needs, while understating it through a mismatched peer group can push a team to chase an unrealistic target, burning goodwill and budget on an improvement plan that was never achievable given the plant's actual production profile. Correcting the comparison itself, before setting the next quarter's target, is consistently the highest-leverage first step in any benchmarking initiative.
Turning a Benchmark Gap Into an Approved Capital or Staffing Request
A benchmark gap by itself rarely secures budget. Executive committees approve capital and headcount requests when a gap is translated into a specific financial consequence, tied to a specific driver, with a specific improvement path already outlined. A VP Operations team walking into a capital review with "our OEE is below world-class" will get a different response than one walking in with "our unplanned downtime sits eight points above our matched peer group, driven primarily by reactive maintenance on three legacy asset classes, and closing that gap over four quarters is projected to recover a defined volume of production capacity without adding a shift."
The strongest version of this business case connects the benchmark position directly to commercial risk, not just operational efficiency. Automotive OEMs and Tier 1 buyers increasingly use supplier scorecards that blend PPM performance, on-time delivery, and cost competitiveness into sourcing decisions for future program awards. A plant sitting in the bottom half of its benchmark tier on quality PPM is not simply leaving efficiency on the table, it is putting future volume allocation at risk in a way that has a quantifiable dollar value attached to it. Framing the benchmark gap in terms of program award risk, rather than only internal efficiency, tends to move capital requests through executive review faster because it maps directly to revenue rather than cost avoidance alone.
Three elements consistently strengthen this kind of business case: a peer-matched benchmark rather than a generic industry figure, a named root cause tied to a specific asset class or process step rather than an aggregate metric, and a phased improvement plan with checkpoints rather than a single large capital ask. Committees are far more likely to approve a four-quarter phased plan with defined checkpoints than an open-ended request framed only around catching up to an abstract industry average.
Common Questions on Automotive Manufacturing Benchmarking
What is a realistic OEE benchmark for an automotive plant, and does 85 percent still apply?
The commonly cited 85 percent figure originated specifically within automotive manufacturing in the 1970s and remains a reasonable orientation point, but current benchmark reporting places true world-class performance for automotive assembly and stamping closer to 88 to 90 percent, against an industry average nearer 70 to 75 percent. The right target depends heavily on product mix, changeover frequency, and how much of the line runs a single dedicated product versus a high-mix schedule. A high-mix line running 15 shared machines across dozens of part numbers should not be measured against a dedicated single-product benchmark, since the underlying loss structure is fundamentally different. Book a demo to see a benchmark calibrated to your actual product mix.
Why does our OEE drop after we switch from manual tracking to automated measurement?
This is one of the most consistent patterns in manufacturing benchmark data and it is not a sign that performance has actually declined. Manual OEE tracking systematically overstates performance by 8 to 12 percentage points because operators logging data by hand tend to miss micro-stops, misclassify unplanned downtime as planned, and rely on nameplate cycle times rather than demonstrated best-case cycles. Automated measurement captures every one of those events, so the first accurate baseline almost always looks worse than the manually tracked number it replaces. The correct response is to treat the new, lower number as the true starting point and build improvement targets from there rather than reverting to the more flattering manual figure. Contact support to understand how automated capture compares to your current logging method.
How often should a plant re-run its competitive benchmark against industry data?
An annual benchmark review is the minimum acceptable cadence, but it leaves a plant blind to competitive slides that happen mid-year, particularly when a customer's sourcing decisions or a competitor's capital investment shift the field faster than expected. Quarterly re-benchmarking against current industry data allows a plant to catch a widening gap on any single metric, such as a rising PPM trend or slipping on-time delivery rate, while there is still time to correct course before it affects a supplier scorecard or renewal conversation. Plants running continuous, automated data capture can re-benchmark essentially in real time rather than waiting for a scheduled review cycle to surface a problem. Book a demo to see a continuously updated benchmark view instead of a quarterly snapshot.
What is the difference between DPPM and the PPM figure automotive customers reference in scorecards?
DPPM counts defective parts per million produced, while PPM in the Six Sigma shorthand sense often refers to defects per million opportunities, which matters when a single part has multiple potential defect points. For a simple part with one critical dimension, the two figures are effectively identical, but for a complex assembly with hundreds of solder joints or fastener points, they can diverge by orders of magnitude. Automotive supplier contracts and OEM scorecards from VW, BMW, Toyota, and Stellantis almost universally use DPPM as the reporting convention, with a common target ceiling of under 50 DPPM for critical safety and functional parts. Understanding which convention a specific customer scorecard uses prevents a plant from misreporting its own quality position. Contact support for help reconciling internal defect tracking with customer scorecard conventions.
Can a plant with older equipment realistically reach world-class benchmark bands?
Yes, and benchmark data consistently shows that equipment age is not the primary driver separating typical from world-class performance. The gap between the two tiers in automotive Tier 1 plants is driven predominantly by the shift from reactive to condition-based maintenance, along with changeover discipline and root-cause closure rates, all of which are process and monitoring improvements rather than capital equipment replacements. A plant running a decade-old line with rigorous condition monitoring, disciplined changeover tracking, and verified corrective action closure can outperform a newer plant that still relies on reactive maintenance and undocumented fixes. This is generally good news for VP Operations teams facing capital constraints, since the highest-leverage improvements are frequently process-based rather than equipment-based. Book a demo to identify which process levers apply to your specific equipment base.
Get a Real Competitive Position, Not a Once-a-Year Estimate
iFactory continuously benchmarks your OEE, quality, downtime, and delivery data against current automotive industry bands, so your next capital request or customer scorecard conversation is backed by a live number instead of a stale annual report.