A shift supervisor at a Tier-1 automotive stamping plant in Ohio watches the real-time OEE dashboard on the plant floor flicker from 78% to 62% in under three minutes. A progressive die on Press Line 4 has started producing parts with burrs exceeding the 0.05mm tolerance, but the anomaly detection system — a legacy SCADA wrapper — won't flag it for another 17 minutes, by which time 340 defective door panels will have entered the downstream weld cell. Each panel costs $47 in rework. The supervisor knows the vibration signature on the press ram has been drifting for weeks, but no one has the tools to correlate that time-series trend with the quality data from the CMM. This is the cost of operating with siloed, unanalyzed sensor data — and it's a cost that compounds with every shift.
Stop chasing quality defects. Let AI read your equipment's time-series data and predict failures before they cost you a shift.
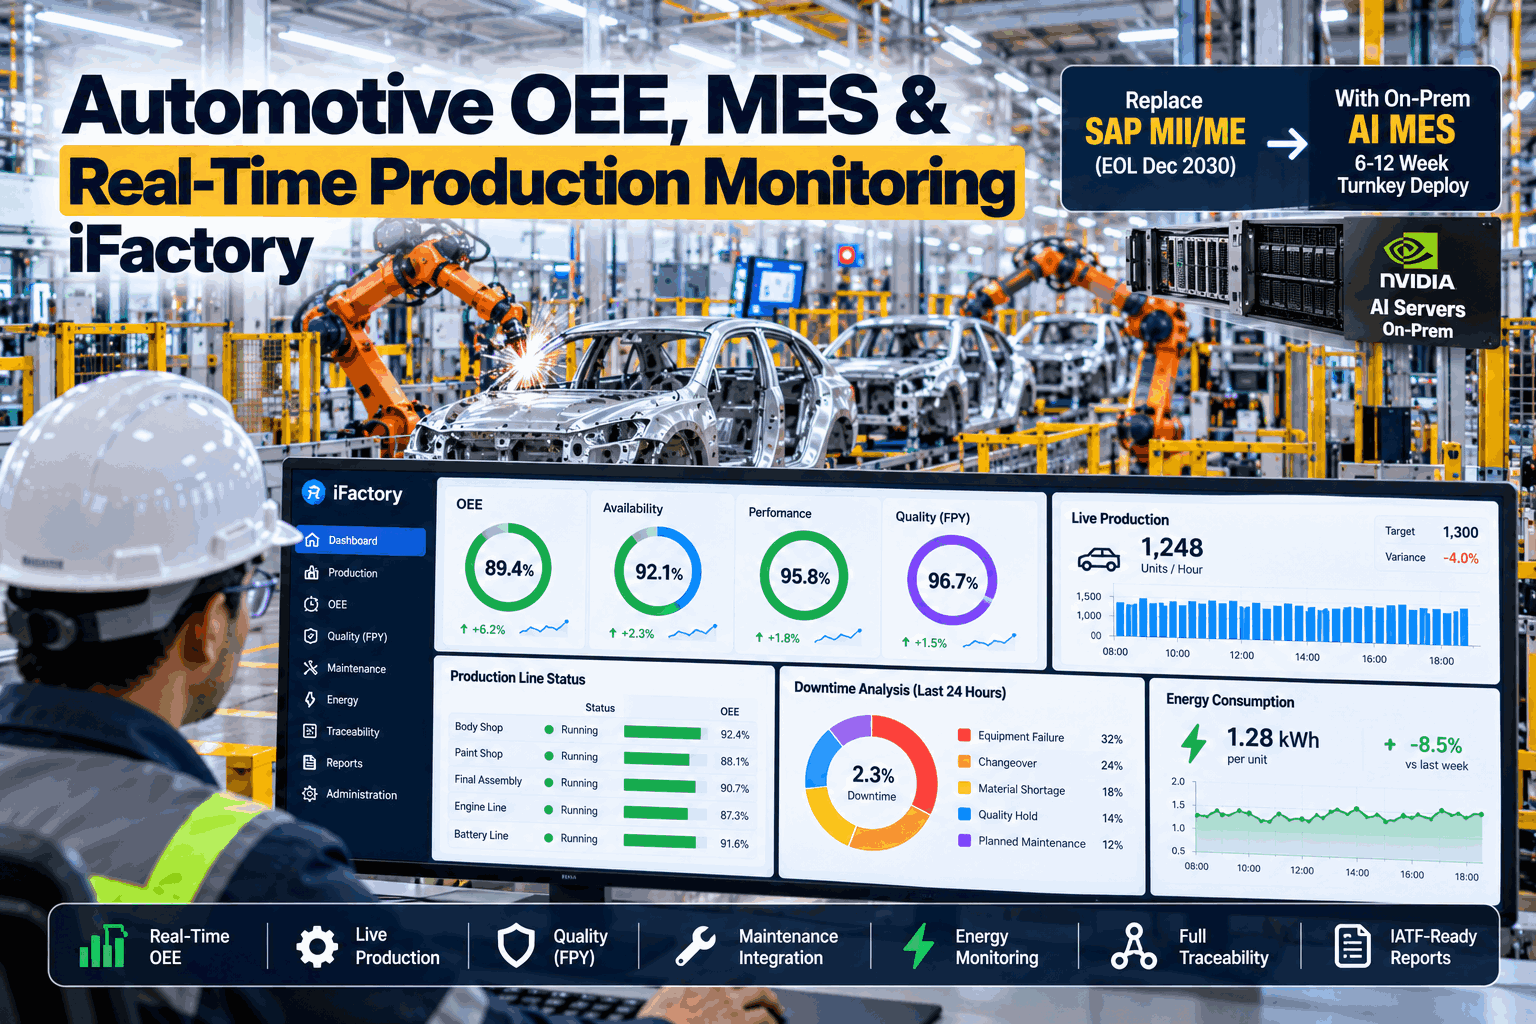
iFactory ingests raw vibration, temperature, pressure, and cycle-time signals from every press, weld gun, and conveyor on your plant floor — then builds a predictive model that flags anomalies 15–45 minutes before your current system does. No cloud. No data science team. Just a turnkey NVIDIA appliance that connects to your existing PLCs and historians.
Your equipment is telling you it's failing. You're just not listening — yet.
Every press stroke, every weld cycle, every conveyor rotation generates a time-series signature. In most automotive plants, that data lands in a historian, gets averaged into a daily OEE number, and is never examined for the sub-second deviations that precede a catastrophic die crash or a quality excursion. The result: unplanned downtime costs an average of $22,000 per minute on a high-volume stamping line, and defect rework adds another 8–12% to cost of goods sold. Below are the specific ways this gap hits your P&L.
Vibration drift goes undetected for weeks
A progressive die's ram acceleration profile shifts by 2% over 14 days. No rule-based system catches it because the change is gradual. When the die finally cracks, you lose 8 hours of production and $176,000 in tooling replacement. The vibration data was there — the analysis wasn't.
Cycle-time micro-variations mask systemic issues
A weld gun's servo motor adds 120ms to each cycle over the course of a shift. Individually, it's invisible. Aggregated over 800 welds per body-in-white, it costs 1.6 minutes per car — and a 4% line rate loss you can't explain because no one correlates cycle-time trends across 40 stations.
Quality feedback loops are 3–5 hours delayed
A CMM measures 1 part per hour. By the time the dimensional report lands in the press shop, 900 stamped parts are already in the buffer. The sensor data from the press — tonnage, parallelism, pad pressure — showed the drift 45 minutes earlier, but no system connects those signals to the quality outcome.
False alarms erode operator trust
Your existing system triggers 12–15 nuisance alerts per shift. Operators learn to ignore them. When a real bearing failure signature appears at 3:00 AM, the alert is dismissed. The spindle seizes at 3:47 AM. Repair cost: $34,000. Lost production: 6 hours. The time-series pattern was textbook — but nobody trained a model to recognize it.
Root-cause analysis takes weeks of manual effort
After a quality incident, your ME team pulls data from 4 different historians, 2 SCADA systems, and a spreadsheet. The analysis takes 3 weeks. By then, the same root cause has affected 12,000 more parts. With correlated time-series AI, the root cause is identified in minutes, not weeks.
Every one of these pain points shares a single root cause: time-series data that is collected but never analyzed for the patterns that matter. Book a 30-min walkthrough and see how iFactory connects your sensor data to your bottom line in under 12 weeks.
From raw signals to actionable predictions in 4 steps — no data science required.
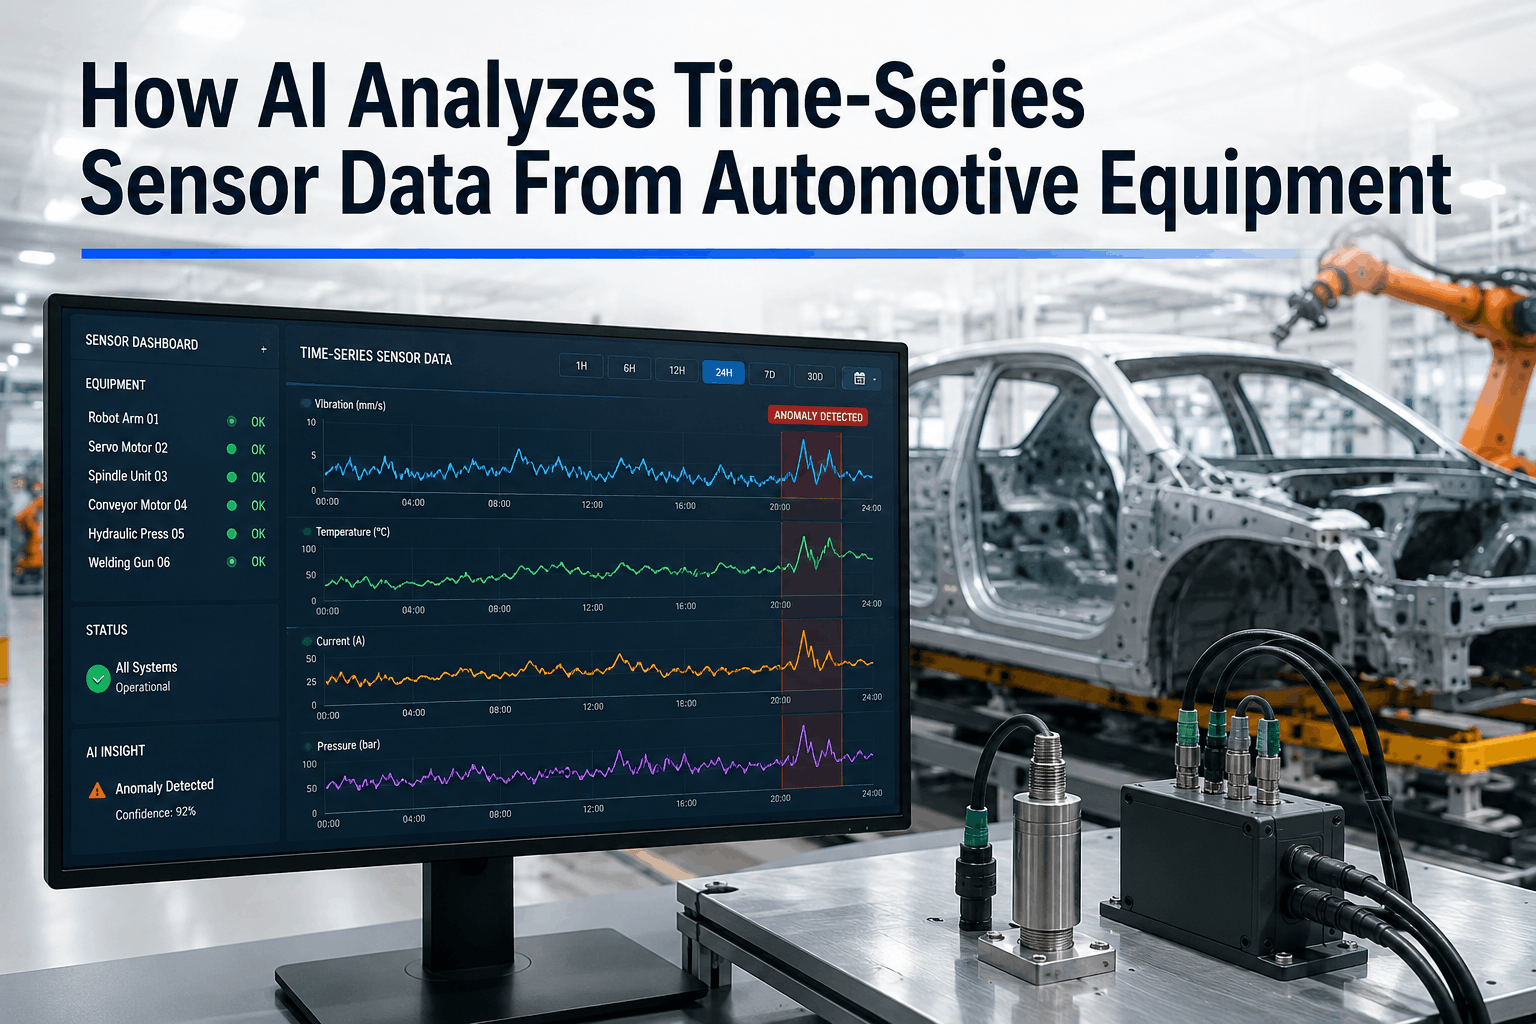
iFactory is not a dashboard overlay. It is an AI-native inference engine that lives on a secure NVIDIA appliance on your plant network. It connects to your existing data sources — PLCs, historians, MES, CMMs — and builds a digital twin of your equipment's time-series behavior. Here is exactly how it works, from connection to prediction.
Connect and ingest
iFactory connects to your OPC-UA, Modbus, or MTConnect data sources, plus your existing historians (OSIsoft PI, Canary, or SQL-based). It begins ingesting all time-series signals — vibration, temperature, pressure, current, torque, cycle time — at native frequency, typically 10–100 Hz per sensor.
Self-supervised pattern learning
The AI model learns the normal operating envelope for each machine — not from labeled data, but from the statistical structure of the signals themselves. Within 3–5 days of data, it builds a baseline for every phase of the press stroke or weld cycle.
Anomaly detection with context
When a signal deviates from its learned baseline, iFactory scores the anomaly in real time — not a binary pass/fail, but a severity score from 0–100. It correlates anomalies across related sensors: a 5°C rise on a weld gun's transformer combined with a 3% current drop and a 50ms cycle extension triggers a single, high-confidence alert.
Predictive alerts with time-to-failure
iFactory estimates remaining useful life (RUL) for each developing fault — "Press Line 4 ram bearing: 87% probability of failure within 12 hours at current drift rate." Alerts land in your existing notification channels (email, SMS, PagerDuty, or directly into your CMMS as a work order).
Built for automotive: high-frequency, high-volume, high-stakes.
iFactory is purpose-built for the data volume and complexity of automotive manufacturing. These are the specific capabilities that make it work in your environment — not generic AI promises.
Vibration & tonnage signature analysis
iFactory models the full press stroke envelope — from pad contact to bottom dead center — and flags deviations as small as 0.5% in tonnage or 2% in acceleration. Detects die wear, misalignment, and lubrication failure before they produce scrap.
Weld gun signature monitoring
Analyzes current, voltage, and electrode force waveforms for each weld. Detects electrode tip wear, shunting, and expulsion events in real time. Reduces weld quality rework by up to 30% in pilot deployments.
Cycle-time & throughput anomaly detection
Models normal cycle-time distributions per station and flags micro-stalls, transfer delays, and accumulating backpressure. Predicts line jams 5–10 minutes before they occur, giving operators time to intervene.
Sensor-to-CMM correlation
iFactory automatically links dimensional quality data from CMMs to the time-series signals from the machines that produced those parts. When a critical dimension drifts, it traces back to the sensor signature that predicted it — often hours earlier.
Power & coolant system monitoring
Monitors pump motor current, coolant flow rate (gpm), and chiller temperature trends. Detects pump cavitation, filter clogging, and refrigerant loss before they cause a line stoppage or energy spike.
On-premise NVIDIA appliance — zero cloud dependency
All data processing happens on a hardened appliance inside your plant network. No data leaves your firewall. No cloud subscription. No latency. iFactory is certified for OT network environments with no internet access required.
Measurable outcomes from plants running iFactory today.
These are not theoretical projections. They are aggregated results from iFactory pilots in Tier-1 and OEM automotive plants across stamping, welding, and assembly operations. Your numbers will vary based on line complexity and data quality, but the direction is consistent.
Turnkey. On-premise. Proven in production. No hidden complexity.
iFactory is not a SaaS platform you have to integrate, configure, and maintain. It is a managed appliance that arrives pre-configured for your data environment and is supported 24x7 by our operations team. Here is exactly what is included in every deployment.
End-to-end turnkey deployment
We handle everything from network connectivity assessment to model validation. Your team provides data-source access; we deliver a working pilot in 6–12 weeks. No integration consultants. No middleware projects.
On-premise NVIDIA appliance
All processing happens inside your plant network on a hardened, air-gapped appliance. No cloud dependency. No data egress. No cybersecurity review delays. Certified for OT environments with zero internet access required.
24x7 managed service
Our operations team monitors model health, data quality, and system performance around the clock. You get SLAs on prediction accuracy and alert latency. If a data feed drops, we detect and escalate before you notice.
Pilot to ROI in one quarter
We scope the pilot to a single production line or work cell. Within 12 weeks, you have a measurable ROI case — reduced downtime, fewer defects, or both. Expansion to additional lines is a configuration change, not a new project.
No data science team required
iFactory's self-supervised learning eliminates the need for labeled training data, feature engineering, or model tuning. Your manufacturing engineers own the system. No PhD required.
Plugs into your existing infrastructure
iFactory connects to any OPC-UA, Modbus, MTConnect, or historian data source. It feeds alerts into your existing CMMS, MES, or notification systems. No rip-and-replace of your current stack.
What operations leaders want to know before deploying time-series AI.
Stop guessing. Start predicting. Your sensor data already has the answers.
Book a 30-minute walkthrough with our operations team. We'll connect to a sample of your data and show you what iFactory can predict — before you commit to a pilot.