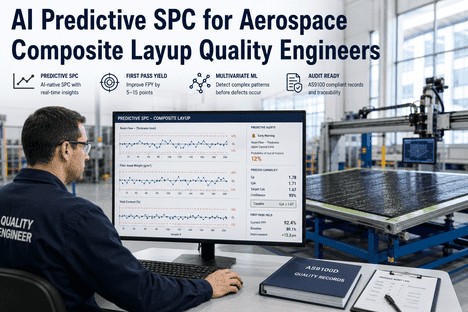
The plant manager who waits for final inspection to discover a scrapped composite part is not managing quality. They are managing the aftermath of a process failure that sensor data could have predicted hours or days earlier. Predictive SPC replaces that reactive cycle with machine learning models trained on inline process variables that detect drift patterns before a single ply deviates beyond specification. A process running at Cpk 0.9 generates 2,700 defects per million opportunities. At Cpk 1.33, that number falls to 64 ppm. At Cpk 1.67, it reaches 0.6 ppm. The difference between these capability levels is not inspection rigor. It is the speed at which the quality control system detects and responds to process drift. Predictive SPC collapses that detection time from hours to seconds.
Predictive SPC for Plant Managers
The Scrapped Part You Inspected Yesterday Was Predictable Three Hours Before It Happened. Predictive SPC Makes Sure You Never Miss That Signal Again.
The Scrap Problem Is Not a Material Problem. It Is a Detection Speed Problem.
Aerospace composite layup operations in 2026 face a structural challenge: the cost of poor quality runs at 10 to 15 percent of total revenue, and that number has barely moved in a decade despite billions invested in inspection technology. The reason is not a lack of data. It is a lack of prediction. The ZEISS Manufacturing Insights Report confirms that 47 percent of aerospace manufacturers still identify time-consuming inspection as their top operational bottleneck. For the plant manager, each percentage point of scrap above the industry benchmark of 2 to 3 percent represents material cost, rework labor, schedule disruption, and audit exposure that compound across every production shift.
Research published in Composites Part B: Engineering demonstrates that AI-driven defect prediction frameworks can forecast twist defects up to 5 millimeters before they appear under the sensor and pucker defects at 2 millimeters with 94 percent overall classification accuracy. A separate 2025 study in the Journal of Composite Materials confirms that manual layup defect rates in prepreg composites range between 5 and 15 percent depending on environmental controls and process discipline. The gap between 5 and 15 percent is not a skill gap. It is a predictability gap that traditional SPC, with its reliance on sampled measurements and retrospective control limits, was never designed to close.
Predictive SPC closes that gap by replacing periodic sampling with continuous inline monitoring, replacing static control limits with self-tuning models that detect sub-0.25 sigma drift, and replacing reactive out-of-spec alerts with predictive warnings that flag process trajectories heading toward the specification limit before the first non-conforming ply is laid.
Traditional SPC vs. Predictive SPC: The Detection Speed Gap
The statistical math of control charts has not changed since Walter Shewhart published the first one in 1931. What has changed is the speed at which data is collected, analyzed, and acted upon. The comparison below shows what a plant manager gains when SPC shifts from reactive sampling to predictive inline intelligence.
Traditional SPC
Sampling frequency
Periodic (5-10% of data)
Drift detection speed
2 to 48 hours
Minimum detectable shift
1.0 to 1.5 sigma
Cross-parameter correlation
Manual, siloed
Predictive SPC
Sampling frequency
Continuous (100% of data)
Drift detection speed
Real-time (10-50x faster)
Minimum detectable shift
Sub-0.25 sigma (EWMA + ML)
Cross-parameter correlation
Automated, multi-variate
Detection speed advantage: 10-50x faster with predictive SPC vs. traditional SPC
The Three Pillars of Predictive SPC for Composite Layup
Predictive SPC is not a single algorithm or dashboard feature. It is a three-pillar architecture that transforms how quality data flows from the layup table to the plant manager's decision screen. Each pillar replaces a traditional quality limitation with a predictive capability.
1
Predict: ML-Driven Defect Forecasting
Machine learning models trained on historical production data identify precursor variable patterns that precede wrinkles, gaps, porosity, and fiber misalignment. LSTM and CNN architectures process laser profilometry, thermal, and force sensor streams in real time. Published research demonstrates defect prediction accuracy above 94 percent, with twist defects forecast up to 5 mm before they appear under the sensor. The plant manager receives a predictive alert, not a post-defect non-conformance report.
When predictive models detect a trajectory toward the specification limit, the system adjusts process parameters before the defect forms. Reinforcement learning controllers adapt heater power, deposition speed, and compaction force in closed-loop response to inline sensor data. Documented results show nip-point temperature regulation within +/- 10 degrees Celsius over 85 percent of operation. Control limits self-tune to current process variability rather than relying on static historical thresholds.
KPI impact: Rework rate below 2%. Cp/Cpk improvement from 1.18 to 1.52 in 90 days.
3
Optimize: Continuous Capability Trending
Cp/Cpk, Pp/Ppk, and DPMO calculated continuously from inline sensor data rather than from scheduled capability studies. Rolling Cpk updates sample-by-sample, showing capability drift live. All eight Western Electric rules plus Nelson rules evaluated on every chart with configurable severity and alert routing. Defect patterns correlated across material lots, shifts, operators, and machine configurations to identify root cause from pattern data rather than investigation.
KPI impact: 60%+ quality-driven downtime reduction. 100% traceability per AS9100.
The CpK Ladder: From PPM to Profit
Every plant manager knows that higher CpK means fewer defects. What is less understood is the nonlinear relationship between incremental capability improvements and exponential defect reduction. Moving from CpK 1.00 to 1.33 reduces defects by 97 percent. Moving from 1.33 to 1.67 reduces them by another 99 percent. Predictive SPC makes the second move achievable because it detects the sub-sigma drift that traditional control charts cannot see.
CpK 0.90
2,700
Defects per million
97.3% pass rate
Typical manual layup without inline QC
CpK 1.33
64
Defects per million
99.994% pass rate
Achievable with traditional SPC + inline inspection
CpK 1.67
0.6
Defects per million
99.99994% pass rate
Achievable with predictive SPC + closed-loop control
The gap between CpK 1.33 and CpK 1.67 is a 99% reduction in defect rate. Predictive SPC closes that gap by detecting process drift at sub-0.25 sigma before it produces a single non-conforming ply.
How Predictive SPC Deploys on Your Plant Floor
Predictive SPC is deployed in four progressive stages, each building on the previous without disrupting production. The typical timeline from sensor integration to active predictive control spans 10 to 14 weeks.
1
Sensor Layer Installation
Machine vision, thermal, force, and vacuum sensors installed as non-intrusive retrofit. Data pipeline captures 50-80 variables per placement event. Two-week baseline of current process variability captured without operator intervention.
Weeks 1-4
2
Model Training and Calibration
ML models trained on historical production data correlating sensor variables with known defect outcomes. Baseline Cp/Cpk established from inline data. Control limits and Western Electric rules configured per critical-to-quality parameter.
Weeks 5-7
3
Shadow-Mode Validation
Predictive SPC runs in shadow mode alongside production. Alerts routed to quality engineer review only. Model predictions compared against actual outcomes. Thresholds and model weights tuned. Discrepancies reviewed weekly.
Weeks 8-10
4
Active Predictive Control
Predictive SPC active on the production floor. Operator-facing alerts with corrective guidance triggers. Quality dashboard showing Cp/Cpk trending, defect precursor patterns, and process capability by material lot and shift. Monthly model retraining.
Week 11+
We had been running SPC on our composite layup line for three years with a CpK of 1.18 and a scrap rate of 8.3 percent. The traditional control charts were detecting drift after the fact, and by the time we had enough data points to trigger a Western Electric rule, the non-conforming parts were already in the autoclave. Predictive SPC changed the timeline. The ML models detected a fiber orientation drift pattern on ply four that would have resulted in a scrapped wing skin panel. The alert fired at placement. The operator corrected the parameter before ply five was laid. That single event paid for the first year of the system. In the next six months, our CpK moved from 1.18 to 1.56 and scrap dropped to 2.4 percent. The system had paid for itself three times over within the first quarter.
The plant manager who achieves Cp/Cpk 1.67 in aerospace composite layup is not the one with the largest quality team or the most expensive inspection equipment. It is the one whose quality control system predicts process drift before it produces a defect, adjusts parameters in real time to prevent non-conformance, and trends capability continuously to identify improvement opportunities before they become quality incidents.
Predictive SPC transforms quality control from a retrospective reporting function into a forward-looking process control discipline. The documented outcomes across aerospace composite layup operations that have deployed predictive SPC with inline sensor integration and ML-driven analytics confirm that 30 to 50 percent scrap reduction is achievable within the first year. The 60 to 80 percent reduction in rework events confirms that predictive SPC does not just detect defects faster. It prevents them from forming. And the continuous Cp/Cpk trending satisfies AS9100D and NADCAP audit requirements with automatically generated capability reports that eliminate the manual documentation burden.
iFactory Predictive SPC is purpose-built for aerospace composite layup operations. It connects to your existing layup cells with inline sensor integration, ML-driven defect prediction, and real-time process capability monitoring that integrates with your quality management system and production workflow. The platform deploys in 10 to 14 weeks and delivers measurable scrap reduction from the first month of active operation.
Calculate Your Plant ROI
Every percentage Point of Scrap Reduction Adds Direct Margin to Your Aerospace Composite Program. Find Out What Predictive SPC Would Save on Your Production Line.
Traditional SPC relies on Shewhart control charts applied to sampled measurement data. Control limits are calculated from a historical baseline and updated periodically. A process shift is detected only after enough data points fall outside the control limits to trigger a Western Electric rule. This creates a detection lag of 2 to 48 hours depending on sampling frequency. Predictive SPC adds three capabilities that traditional SPC was never designed to provide: ML-driven virtual metrology that predicts current quality state from process parameters before measurement data is available, cross-parameter correlation that detects drift patterns invisible in univariate charts, and sub-0.25 sigma shift detection using EWMA and ML fusion models. The result is drift detection 10 to 50 times faster than traditional SPC alone.
Documented results across aerospace composite layup operations that have deployed predictive SPC with inline sensor integration show 30 to 50 percent scrap reduction within the first 12 months. A 2025 study published in Sustainability demonstrated that ML-based scrap prediction models achieve more than 30 percent RMSE reduction compared to standalone forecasting approaches. A digital twin-controlled manufacturing trial published in the Journal of Polymer Composites reported part rejection rates dropping from 18 percent to 6.3 percent and void volume fraction reduced from 3.2 percent to 0.9 percent. Individual plant manager case studies from tier 1 aerospace composites manufacturers document scrap rate reduction from 8.3 percent to 2.4 percent within six months of active predictive SPC deployment. The specific reduction depends on current baseline capability, process complexity, and the speed of model retraining adoption.
Predictive SPC runs in parallel with your existing SPC system. Traditional Shewhart control charts are maintained for regulatory compliance and audit documentation. The predictive layer adds ML-driven forecasting, cross-parameter correlation, and sub-sigma drift detection on top of your existing control chart infrastructure. All eight Western Electric rules plus the four Nelson rules continue to be evaluated on every chart. Control limits, Cp/Cpk/Pp/Ppk, and DPMO are calculated continuously from inline sensor data in addition to your scheduled capability studies. This dual approach ensures you maintain compliance while gaining the detection speed advantage of predictive analytics. Most deployments run both systems in parallel during the shadow-mode validation phase before transitioning to predictive SPC as the primary alerting system.
Predictive SPC operates with standard plant networking infrastructure. An edge computing device at the layup cell performs real-time data fusion, ML model inference, and alert generation without depending on cloud connectivity. This ensures uninterrupted quality control during network outages. Process data transmits to the predictive SPC server for long-term trending, model retraining, and dashboard visualization. Bandwidth requirements are under 10 Mbps per layup cell. The platform supports deployment on facility servers, private cloud, or iFactory cloud depending on your data security requirements. For AFP cells and automated systems, data is ingested through OPC-UA, Modbus TCP, and MQTT interfaces. For manual layup operations, machine vision cameras, thermal sensors, and force transducers are added as a non-intrusive retrofit. A data readiness assessment conducted during deployment planning confirms the specific connectivity and computing requirements for your facility. Talk to an Expert to schedule an assessment.
Predictive SPC generates the complete documentation trail required for AS9100D and NADCAP AC7118 compliance without manual data compilation. Every control chart, capability study, and deviation event is logged with timestamps, operator identification, and corrective action records. The system satisfies AS9100D clauses 8.1 (operational planning and control), 8.5.1 (controlled production conditions), and 8.5.2 (identification and traceability). For NADCAP, the system generates process parameter documentation, capability trending reports, and non-conformance records in audit-ready format. Cp/Cpk reports are trended by part number, material lot, shift, and operator. Electronic signature workflows and document control integration support compliant record retention. Book a Demo to review audit documentation output for your specific quality management system.
You Are Laying Piles of Margin into Every Part. Predictive SPC Makes Sure None of Them Become Scrap.
iFactory Predictive SPC for aerospace composite layup. ML-driven defect prediction, real-time process capability monitoring, and closed-loop parameter control. Purpose-built for plant managers who need to protect margin, maintain compliance, and hit production rate.