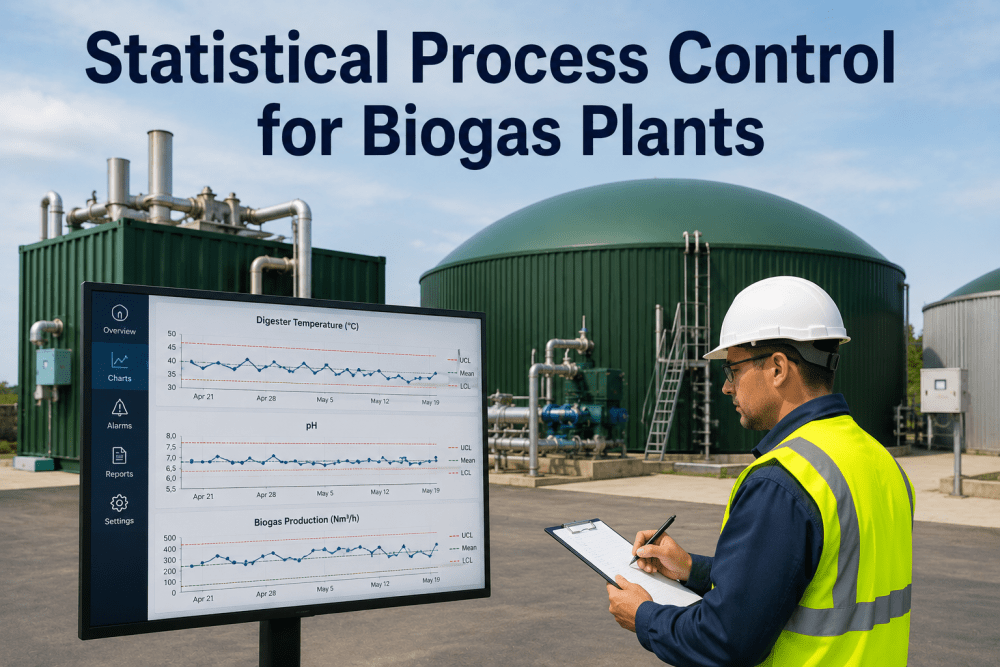
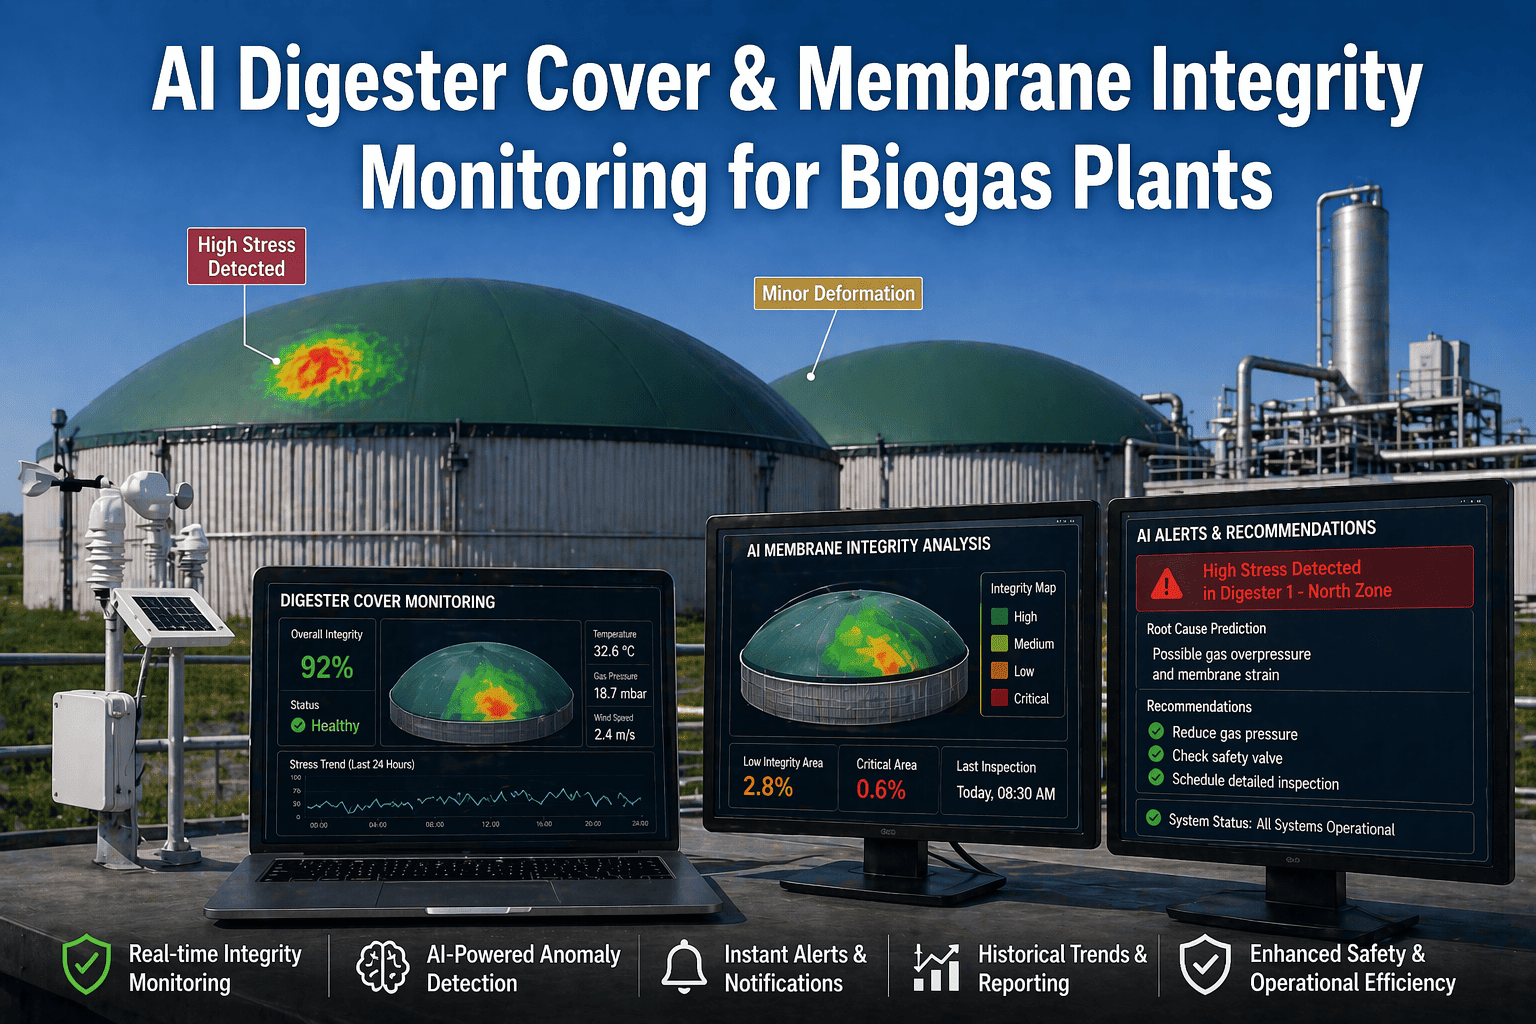
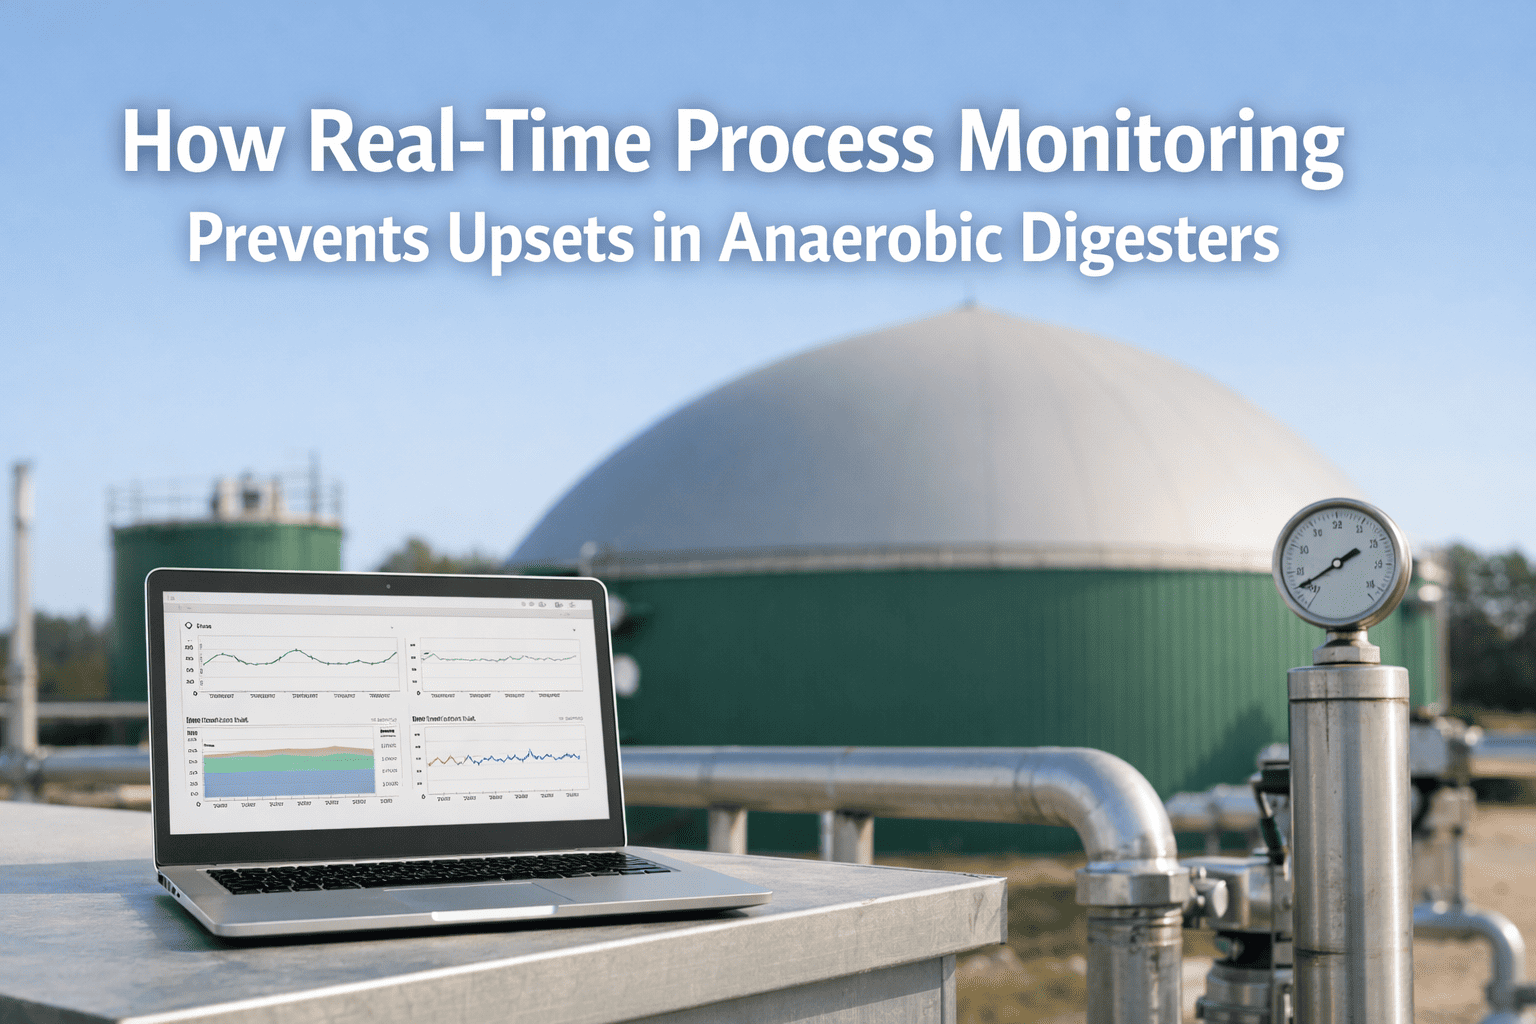
Anaerobic digestion is a living process. Microbial populations respond to feedstock changes, temperature swings, and loading rate shifts within hours—not days. Traditional Statistical Process Control on spreadsheets, with manual data entry and periodic chart updates, simply cannot keep pace with the biology. By the time a control limit violation is detected on a manual X-bar chart, the digester may already be trending toward acidification or ammonia inhibition. Automated SPC software for biogas plants closes this gap by connecting directly to SCADA historians calculating control limits in real time, and triggering alarms the moment a process parameter drifts outside its normal operating window. iFactory AI’s platform brings production-proven SPC capabilities purpose-built for anaerobic digestion environments, including VFA tracking, OLR monitoring, FOS-TAC ratio analysis, and biogas composition trending. Schedule a demo to see how automated SPC can protect your digester biology and maximize gas yield.
Automated SPC • Biogas • AD Operations • 2026
Choosing Automated SPC Software for Biogas Plants
Manual SPC on biogas spreadsheets is too slow to protect biology. Real-time automated SPC with dynamic control limits, multi-parameter correlation, and early-warning alarms is the only practical approach for modern anaerobic digestion operations.
Automated SPC detects control limit violations within minutes versus hours with manual charting
100%
Continuous Parameter Monitoring
12–18%
Higher Biogas Yield with SPC-Driven OLR Control
60%
Fewer Process Upset Events
24/7
Automated WECO Rule Surveillance
Real-Time SPC Charts
X-bar, R, and individuals charts updated with every SCADA data point. Control limits recalculated dynamically as process conditions evolve.
Automated WECO Rule Alarms
All eight Western Electric rules applied continuously. Alerts pushed to operators via dashboard, SMS, or SCADA integration.
Multi-Parameter Correlation
Correlate OLR, VFA, temperature, pH, and biogas composition on a single dashboard to identify root causes of process drift.
Want to see how automated SPC applies to your specific AD operation? Schedule a live platform walkthrough with your plant's historical process data.
Why Manual SPC Fails for Biogas Operations
Anaerobic digestion presents a uniquely challenging environment for statistical process control. The biological process has inherent nonlinear dynamics: a stable digester can tip into acidification within 12–24 hours of a feedstock overloading event, and recovery requires days or weeks of reduced feeding. Manual SPC, typically implemented through periodic spreadsheet updates with static control limits calculated from archived data, cannot detect the early warning signals that precede a process upset. The fundamental problem is latency: manual data entry and chart review cycles of 4–24 hours mean that by the time a control chart signals an out-of-control condition, the biology has already moved significantly past the point where corrective action is straightforward.
01
Static Control Limits on a Dynamic Process
Traditional SPC calculates upper and lower control limits from a fixed baseline period. Biogas processes shift seasonally with feedstock availability, temperature, and microbial population evolution. Static limits trigger false alarms on normal seasonal variation and miss real signals during transition periods.
02
Data Latency Masking Early Warnings
Manual data collection from lab analysis of VFA, alkalinity, and ammonia can take 24–48 hours from sample draw to chart entry. During that window, a digester overload event can progress from early warning to critical instability.
03
Incomplete Multi-Parameter Visibility
A single-parameter SPC chart for OLR cannot reveal the interaction between loading rate, VFA accumulation, alkalinity depletion, and methane percentage drop. Manual operators lack the tools to correlate multiple parameters simultaneously.
04
Reactive Rather Than Predictive Response
Manual SPC is inherently retrospective. It tells you what already went wrong. Automated SPC with trend prediction and drift detection gives operators actionable lead time of 4–12 hours before a parameter crosses a critical threshold.
Is Your Biogas Plant Outgrowing Manual SPC?
A 30-minute consultation evaluates your current SPC workflow against automated alternatives. We will analyze one parameter from your plant at no cost and demonstrate the latency gap between manual and automated detection.
Critical SPC Parameters Every Biogas Operator Must Track
Automated SPC for biogas plants monitors a defined set of process parameters that serve as leading indicators of digester health. Each parameter has established control limits and alarm rules calibrated to the specific facility’s feedstock, operating temperature, and microbial community. The table below summarizes the essential parameters, typical control ranges, and the biological significance of deviations.
Essential SPC Parameters for Anaerobic Digestion Process Control
Must-Have Features in Automated SPC Software for Biogas
Not all SPC software is built for anaerobic digestion. General-purpose manufacturing SPC tools lack the parameter-specific logic, time-series correlation capabilities, and biological context that biogas operations require. The following eight capabilities distinguish biogas-specific automated SPC platforms from generic alternatives.
01
Biogas-Specific Control Chart Templates
Pre-configured chart templates for OLR, VFA, FOS-TAC, temperature, pH, CH4, CO2, H2S, and NH4-N with appropriate subgroup sizes and sampling frequencies. No manual chart setup required for AD operations.
02
Dynamic Control Limit Calculation
Control limits that automatically recalibrate based on recent process data windows (e.g., trailing 30-day rolling baseline). Prevents false alarms from seasonal variation while maintaining sensitivity to abnormal drift.
03
Full WECO Rule Implementation
All eight Western Electric rules applied to every parameter: one point beyond 3-sigma, two of three beyond 2-sigma, four of five beyond 1-sigma, eight on one side, and trending rules. Rules configurable per parameter.
04
Multi-Parameter Correlation Workbench
Overlay OLR, VFA, FOS-TAC, and CH4 on a single timeline to identify cause-effect relationships. Automated correlation analysis highlights leading indicators that precede process shifts by 4–12 hours.
05
SCADA and Historian Direct Integration
Native connectors for OPC-UA, Modbus, Siemens S7, Allen-Bradley, and major SCADA historians. No manual data entry. SPC charts update automatically as new process data arrives from the DCS.
06
Alarm Notification and Escalation
Configurable alarm rules that trigger SMS, email, Slack, or SCADA alerts when SPC rules are violated. Escalation paths ensure alarms reach the right operator regardless of shift or location.
07
Cp and Cpk Process Capability Analysis
Automated Cp and Cpk calculation for each parameter against user-defined specification limits. Trend charts for process capability over time help operators identify degradation before it causes product quality issues.
08
Trend Prediction and Early Warning Models
Machine learning models trained on historical process data predict when a parameter will cross control limits or specification limits, providing 2–12 hours of lead time for corrective action before violations occur.
Ready to evaluate your options? Schedule a structured walkthrough of biogas-specific SPC capabilities and a comparison against your current workflow.
Manual vs. Automated SPC: Performance Comparison
Quantifying the operational gap between manual and automated SPC helps build the business case for investment. The comparison below reflects aggregate data from biogas plants that transitioned from manual spreadsheet-based SPC to iFactory AI’s automated platform.
SPC Chart Update Latency
4–24 hours manual
30–60 seconds automated
99.9% faster
Control Limit Violation Detection
2–8 hours post-event
< 1 minute post-event
99% faster
Process Upset Events per Quarter
6–10 events (industry avg)
2–4 events post-automation
-60% reduction
Biogas Yield (normalized to feedstock)
Baseline
+12–18% improvement
Significant ROI driver
Operator Time on SPC Tasks
8–12 hours/week
1–2 hours/week
80% time savings
How to Evaluate SPC Software for Your Biogas Plant
Selecting the right automated SPC platform requires a structured evaluation against your specific operational requirements. The wrong choice wastes budget and frustrates operators. The following six-step process guides your evaluation from requirements definition through pilot deployment, ensuring the selected platform matches your SCADA environment, parameter set, operator skill level, and compliance requirements.
01
Map Your Parameter Set and Data Sources
Document every process parameter you need to monitor, its current data source (online sensor, lab analysis, manual entry, or SCADA historian), and the desired sampling frequency. Identify parameters currently tracked manually that should be automated.
02
Verify SCADA and Historian Compatibility
Confirm the SPC platform supports native connectivity to your existing automation infrastructure. Key protocols: OPC-UA, Modbus TCP, Siemens S7, Allen-Bradley CIP, MQTT, and REST API. Request a compatibility test before committing.
03
Evaluate SPC Charting and Rule Capabilities
Verify support for X-bar R, individuals (I-MR), p-charts, np-charts, CUSUM, and EWMA charts. Confirm all eight WECO rules are implemented and configurable per parameter. Test dynamic control limit calculation on your historical data.
04
Review Alarm and Notification Workflow
Test the alarm configuration interface: rule definition per parameter, notification channels (SMS, email, dashboard, SCADA), escalation paths, and shift-based routing. Alarms that reach the wrong person are worse than no alarms.
05
Run a Parallel Pilot on Real Data
Deploy the SPC platform in parallel with your existing process for 4–6 weeks. Compare alarm timestamps, detection accuracy, false-positive rates, and operator response times between manual and automated SPC. Quantify the difference.
06
Transition Operations Gradually
Phase in automated SPC one parameter group at a time: begin with continuous SCADA parameters (temperature, pH, biogas flow), then add online sensor parameters (VFA, CH4), then integrate lab-based parameters with semi-automated data entry.
Start Your SPC Automation Journey
iFactory AI delivers biogas-specific automated SPC with pre-configured templates for anaerobic digestion parameters, direct SCADA integration, dynamic control limits, full WECO rules, and multi-parameter correlation. Schedule a 30-minute demo to see the platform running against your plant’s data.
Expert Review: SPC Automation Is a Biological Imperative for AD
"I have spent 20 years managing anaerobic digestion plants across food waste, agricultural, and municipal sludge operations. The single biggest operational mistake I see is treating SPC as a compliance exercise rather than a biological early-warning system. Manual SPC on spreadsheets gives operators a false sense of control because the data is always 8 to 24 hours old by the time it reaches a chart. In a biological system where acidification can progress from warning to critical in 12 hours, that latency is the difference between a minor feeding adjustment and a week-long recovery event. Automated SPC with real-time sensor integration, dynamic control limits calibrated to trailing process windows, and multi-parameter correlation has transformed how my teams operate. They catch OLR-VFA interactions before the FOS-TAC ratio signals trouble. They see temperature drift patterns that manual charting missed entirely. The gas yield improvement of 12–18% is real and sustainable. For any plant processing more than 20,000 tons per year, manual SPC is no longer a viable option. The biology moves too fast."
— Senior Operations Director, European Biogas Association (25 years in anaerobic digestion operations and process optimization)
20+ yrs
AD Operations Experience
12–18%
Measured Yield Improvement
8–24 hr
Manual SPC Latency Gap
Conclusion
Automated SPC software for biogas plants is not a luxury. It is an operational necessity for any anaerobic digestion facility that treats process stability and gas yield optimization as business priorities. The transition from manual spreadsheet-based charting to real-time automated SPC closes the detection latency gap that allows minor process deviations to escalate into costly upset events. With biogas-specific control chart templates, dynamic limit calculation, full WECO rule implementation, and multi-parameter correlation, modern SPC platforms give operators the real-time visibility they need to manage the biology proactively rather than reactively. iFactory AI’s platform delivers all of these capabilities with direct SCADA integration and purpose-built support for anaerobic digestion parameters. Book a Demo to start your SPC automation journey.
Frequently Asked Questions
What is the difference between manual and automated SPC for biogas plants?
Manual SPC relies on operators periodically entering process data into spreadsheets and reviewing control charts at fixed intervals, typically once per shift or daily. Automated SPC connects directly to SCADA historians, online sensors, and lab data management systems, updating control charts continuously as new data arrives. The critical difference is detection latency: manual SPC typically detects control limit violations 2–8 hours after the data point was generated, while automated SPC detects violations within seconds to minutes. For biological processes like anaerobic digestion where conditions can shift rapidly, this latency gap directly determines whether a minor deviation can be corrected before it becomes a process upset. See a live comparison of detection times.
What SPC chart types are most useful for biogas process monitoring?
The most commonly used chart types in biogas SPC are X-bar and R charts for subgrouped data (e.g., hourly average VFA readings), individuals and moving range (I-MR) charts for continuous sensor data (e.g., temperature, pH, biogas flow), and p-charts or np-charts for attribute data (e.g., number of exceedances per shift). CUSUM and EWMA charts are particularly valuable for biogas applications because they detect small, persistent shifts in process parameters before they trigger traditional 3-sigma control limit violations. These sensitive charts are ideal for detecting early acidification trends, gradual temperature drift, and slow changes in methane composition that would be invisible on standard Shewhart charts until the deviation is significant.
How should control limits be set for biogas processes that vary seasonally?
Seasonal variation is a well-known challenge for biogas SPC. The recommended approach is dynamic control limit calculation using a trailing baseline window, typically 30–60 days. Control limits are recalculated daily or weekly using the most recent process data window. This ensures limits reflect current operating conditions rather than a static historical baseline that may not represent the current season’s feedstock or temperature regime. Separate baseline windows can be configured for different seasons or feedstock periods. The automated SPC platform should also support manual limit overrides for periods of planned operational changes, such as digester maintenance or major feedstock transitions.
Can automated SPC integrate with existing biogas plant SCADA and control systems?
Yes. Modern automated SPC platforms are designed as overlay systems that connect to existing automation infrastructure without replacing it. Standard integration protocols include OPC-UA (most common for biogas SCADA systems), Modbus TCP (common for gas analyzers and flow meters), Siemens S7 and Allen-Bradley CIP (for PLC-based control systems), MQTT (for IoT sensor networks), and REST API (for cloud-based historian platforms). The SPC platform reads process data from these sources, performs statistical analysis, updates control charts, and generates alarms. No changes to the existing DCS or SCADA configuration are required. The SPC system typically runs on a separate server or cloud instance with read-only access to the process historian. iFactory AI’s platform supports all of these protocols with pre-built connectors. Discuss your SCADA environment.
What is the typical ROI timeframe for automated SPC software in a biogas plant?
Biogas plants typically achieve full ROI within 6–12 months of automated SPC deployment. The primary value drivers are: reduced process upsets (fewer recovery periods at reduced or zero gas production), increased biogas yield (12–18% improvement through optimized OLR control), reduced operator time on manual SPC tasks (8–10 hours per week redirected to value-added activities), and avoided maintenance events from proactive detection of equipment degradation. For a typical 500 kW biogas plant processing 20,000 tons per year, the combined value of yield improvement and upset reduction alone can exceed $80,000–$120,000 annually. Factors that accelerate ROI include: existing sensor infrastructure (reduces implementation cost), complex feedstock mix (more frequent process shifts create more value from early detection), and regulatory compliance requirements (automated reporting saves labor).