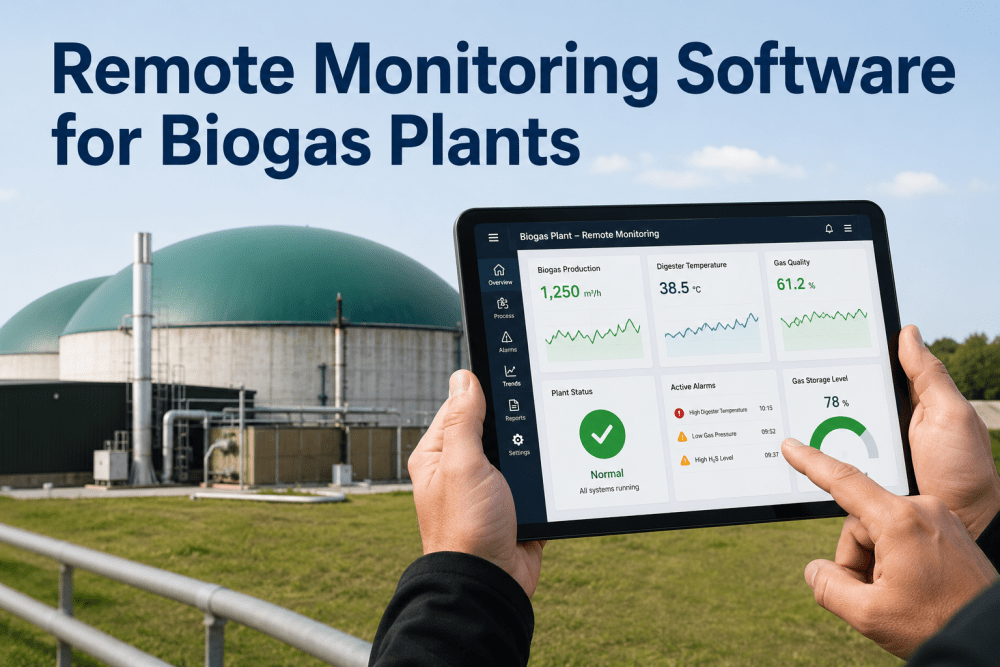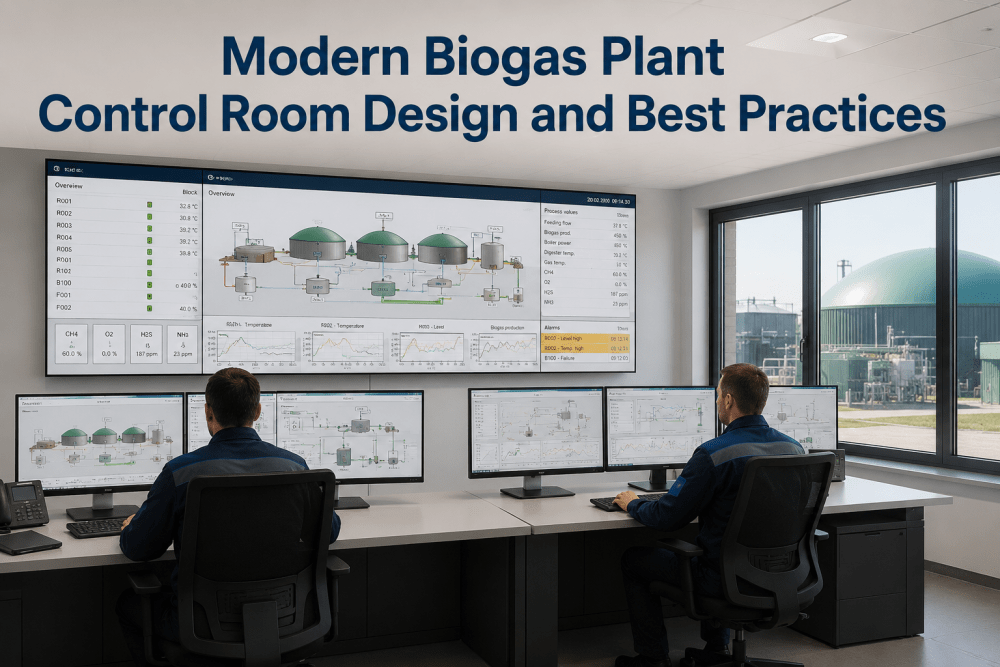
Biogas plant control rooms have evolved from simple SCADA monitoring stations with a single screen displaying digester temperatures and CHP engine status into sophisticated operations centers that integrate real-time process data, predictive analytics, video surveillance, and decision-support dashboards across the entire plant footprint. Plant managers and operations leaders who Book a Demo discover how iFactory transforms the biogas control room from a monitoring station into a predictive operations center.
Transform Your Biogas Control Room Into a Predictive Operations Center
iFactory AI delivers alarm rationalization, role-based HMI layouts, real-time predictive analytics integration, and operator decision support — purpose-built for biogas and RNG facilities. From digester health dashboards to CHP performance monitoring, reduce operator reaction time and protect methane yield around the clock.
The Evolution of Biogas Control Room Design
The typical biogas plant control room in operation today was designed around the capabilities of the SCADA system that was installed when the plant was commissioned — which in many cases means a fixed set of screen views that mirrored the P&ID rather than the operator's decision workflow.
Modern biogas control room design starts from a different premise: the operator should never have to search for the information needed to respond to an event. Operations managers who Book a Demo see how iFactory's control room design framework rebuilds the operator information environment from the decision outward.
Key Design Principles for Modern Biogas Control Rooms
Designing a control room that enables rapid, accurate operator decision-making requires applying a consistent set of principles that govern everything from alarm philosophy to screen layout to information density. The following framework defines the core design principles that iFactory applies to every control room deployment.
Alarm Rationalization by Consequence Severity
Warning alarms — feed pump failure, temperature deviation beyond normal range, gas quality degradation — require operator acknowledgment within a defined response window. Informational alerts — routine parameter changes, scheduled maintenance reminders, end-of-shift summaries — are logged to the alarm historian without operator display interruption. iFactory's alarm rationalization module applies this classification automatically, reducing operator alarm fatigue while ensuring that the alarms that matter are never missed.
Role-Based HMI Layout and Screen Hierarchy
A single control room serves multiple operator roles — the senior operator monitoring overall plant performance, the shift operator managing digester feed and CHP dispatch, the maintenance technician tracking equipment health trends. Each role requires a different information view and a different level of detail. Role-based HMI design creates screen layouts that are optimized for each operator's decision responsibilities — plant overview screens for situational awareness, process unit screens for focused monitoring, and equipment detail screens for diagnostic investigation.Book a Demo
Predictive Analytics Integration Into Operator Workflows
The most significant advance in modern control room design is the integration of predictive analytics directly into the operator's primary monitoring workflow — not as a separate dashboard that operators must open in another window, but as an embedded layer within the HMI that surfaces AI-generated predictions alongside real-time process dataThis integration transforms the control room from a reactive monitoring environment into a predictive operations center where operators act on forecast events, not alarm cascades. Book a Demo to see predictive analytics embedded in the operator's primary HMI workflow.
Unified Situational Awareness Dashboard
A unified situational awareness dashboard presents every critical plant parameter in a single organized display — digester conditions, CHP engine status, gas treatment system performance, feedstock inventory, RNG injection parameters, and environmental compliance data — structured by operational significance rather than by control system topology. The dashboard serves as the operator's primary monitoring interface during normal operations, with drill-down paths to detailed views for any parameter that requires closer examination.
Alarm Management and HMI Design for Biogas Operations
Effective alarm management is the single highest-impact control room improvement a biogas plant can implement — yet it remains one of the most neglected. Unrationalized alarm systems generate hundreds of alarms per shift, creating an environment where critical alarms are indistinguishable from nuisance alerts and operators develop alarm fatigue that causes genuine emergencies to be missed. The ISA-18.2 standard for alarm management provides the framework for rationalization, but implementing it in practice requires a structured approach that maps every alarm to its operational consequence and defines the appropriate operator response. Engineering and operations leaders who Book a Demo receive an alarm system assessment that quantifies their current alarm load and identifies the rationalization opportunities that will deliver the fastest operator effectiveness improvement.
| Design Element | Legacy Control Room Approach | iFactory Modern Design |
|---|---|---|
| Alarm Philosophy | All alarms treated equally — no prioritization by consequence severity or response time requirement | Three-tier rationalization: Critical (immediate response), Warning (scheduled response), Informational (logged only) |
| HMI Screen Organization | Organized by SCADA tag structure or P&ID origin — operator must remember screen numbers to navigate | Organized by operator role and decision process — plant overview, unit screens, equipment detail with consistent two-click navigation |
| Data Visualization | Digital readouts and single-parameter trends — operator must correlate parameters mentally across multiple screens | Multi-parameter trend overlays, deviation highlighting, process graphics with live values embedded in P&ID context |
| Predictive Alerting | Threshold-based alarms only — alerts fire after the deviation has already occurred | AI-generated predictive alerts with time-to-event, confidence score, and recommended intervention — alarms fire before the deviation causes consequences |
| Alarm Historian and Reporting | Alarm log accessible only through SCADA vendor interface — difficult to analyze alarm load trends | Integrated alarm historian with automated KPIs — alarm rate, operator response time, standing alarms, nuisance alarm frequency — reported on shift summary |
| Shift Handover Integration | Verbal handover with paper logs — critical context lost between shifts | Digital shift summary with alarm history digest, pending operator actions, equipment status changes, and AI-generated shift notes — all captured in permanent record |
Real-Time Data Flow Architecture for Biogas Control Rooms
An effective modern control room depends on a data architecture that moves information from field devices and process sensors to operator screens with minimal latency and maximum reliability. The data flow must bridge multiple systems — the DCS or SCADA platform that collects field data, the historian that archives process trends, the analytics engine that generates predictive insights, and the HMI that presents information to operators
Field Data Acquisition and SCADA Integration
Digester temperature, pressure, pH, and gas composition sensors; CHP engine vibration, temperature, and power output transducers; gas treatment pressure, temperature, and H2S monitoring instruments — all connected to the plant DCS or SCADA system through OPC UA, Modbus TCP, or 4-20 mA analog loops. iFactory integrates with existing SCADA infrastructure without requiring replacement of field instrumentation or control system components.Book a Demo
Real-Time Data Historian and Normalization
SCADA data streams into the process historian with 1-second resolution for critical parameters and 10-second resolution for secondary measurements. iFactory's data normalization layer performs unit conversion, timestamp alignment, and signal validation — filtering out sensor noise and communication glitches before data reaches the analytics engine and operator displays.
AI Analytics and Predictive Model Execution
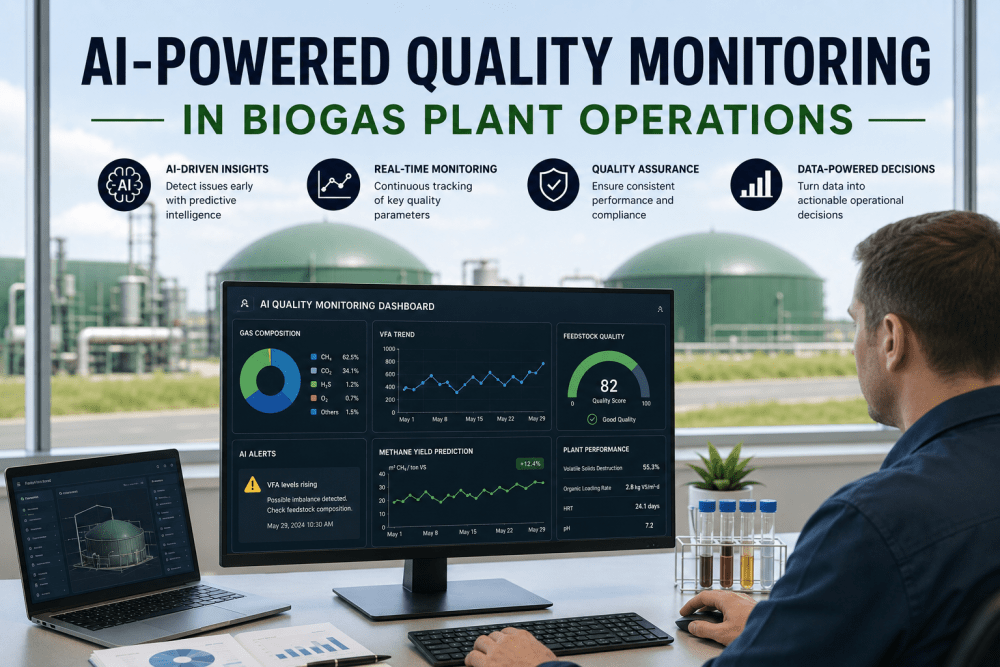
iFactory's machine learning models run continuously on normalized plant data — detecting developing digester imbalances, predicting CHP component degradation, forecasting gas treatment media exhaustion, and identifying feedstock quality variations that will affect methane yield. Model outputs are generated as structured prediction events with lead time, confidence, and recommended action.
Operator Display and Decision Support
Unified situational awareness dashboard presents live process data, predictive alerts, and recommended operator actions in a single organized display. Operators monitor plant status at a glance, drill down into detailed views for investigation, and receive AI-generated shift summaries that capture all significant events, predictions, and pending actions for handover to the next shift.Book a Demo
Expert Review: What Control Room Operators Say About Modern Biogas HMI Design
The following observations reflect the experience of control room operators and plant managers at biogas facilities that have transitioned from legacy SCADA HMI environments to modern, AI-integrated control room designs using the iFactory platform. These accounts are drawn from operating experience across agricultural biogas, food waste digestion, and landfill gas-to-energy facilities in the United States and Canada.
The second most frequently cited improvement is the integration of predictive analytics into the primary HMI. Operators report that having AI-generated predictions — such as "digester VFA imbalance developing — expected to reach critical level in 4–6 hours at current trend" displayed on their main monitoring screen — changes their decision-making from reactive to proactive. Instead of responding to alarm cascades after a digester upset has begun, operators adjust feed rates, supplement additives, or modify temperature setpoints before the upset develops. This shift from reactive to predictive operations is consistently described as the most transformative change in the control room.
The third theme is the value of consistent, role-based screen navigation. Operators who previously memorized screen numbers or navigated through menu trees to find critical parameters report that iFactory's role-based HMI layouts, with their two-click navigation from plant overview to equipment detail, reduced the time to find and act on critical information by 40–60 percent. In emergency situations where every second of delayed response increases the severity of consequences, that reduction in navigation time directly translates to reduced operational risk. Book a Demo to see how iFactory's HMI design transforms the operator decision environment.
Measurable Impact of Modern Control Room Design on Biogas Plant Performance
The financial and operational benefits of modern control room design are measurable across multiple dimensions — from reduced operator workload and faster incident response to improved plant availability and methane yield. The following impact areas reflect aggregated performance data from biogas facilities that have implemented iFactory's control room design framework.
| Impact Area | Before Modernization | With iFactory Control Room | Typical Benefit |
|---|---|---|---|
| Operator Response to Critical Events | 4–8 minutes — delayed by alarm overload and multi-screen navigation | Under 60 seconds — prioritized alarm with one-click drill-down to diagnostic view | 85% faster critical response |
| Active Alarm Load Per Shift | 300–500 active alarms — operators develop alarm fatigue and miss critical events | Under 50 actionable alarms — rationalized by consequence with nuisance alarms suppressed | 90% alarm load reduction |
| Digester Upset Detection Lead Time | Detected after parameter deviation exceeds threshold — upset already in progress | AI predictive alerts 4–12 hours before process deviation reaches critical level | Proactive intervention window |
| Shift Handover Information Loss | Verbal handover with paper logs — critical context lost between shifts | Digital shift summary with alarm digest, pending actions, and AI-generated operational notes | 100% context retention |
| Screen Navigation Efficiency | 12–18 clicks to navigate from plant overview to equipment diagnostic detail view | 2 clicks maximum — consistent hierarchy from overview to unit to equipment detail | 40–60% faster navigation |
| Incident Documentation and Compliance Reporting | Hours of manual log compilation after each significant event | Auto-generated incident timeline with alarm history, operator actions, and process data | 85% reporting time reduction |
Conclusion: The Control Room Is the Nerve Center — Design It for Decisions, Not Just Monitoring
The biogas plant control room is where operational intelligence becomes operational action. It is the interface between the plant's extensive instrumentation and analytics infrastructure and the human operator whose decisions determine whether the plant runs at optimal yield or cycles through preventable upsets. Designing that interface for rapid decision-making — through alarm rationalization, role-based HMI layouts, embedded predictive analytics, and unified situational awareness — is not a cosmetic improvement. It is a direct investment in plant performance that reduces operator reaction time, increases digester stability, improves CHP availability, and protects methane yield.
iFactory AI delivers the control room modernization framework that enables this transformation — integrating alarm rationalization, role-based HMI design, predictive analytics, and decision support into a unified operator environment that works with your existing automation infrastructure. Plant managers and operations leaders across the United States and Canada are already using iFactory to reduce critical event response time by 85 percent, cut alarm load by 90 percent, and shift their operations from reactive to predictive. Book a Demo to see how iFactory transforms your biogas control room into a predictive operations center.
Frequently Asked Questions: Biogas Control Room Design and Best Practices
Do I need to replace my existing SCADA system to implement iFactory's control room design framework?
No. iFactory's control room design framework operates as an overlay on your existing SCADA infrastructure — integrating with the control system through OPC UA, PI Historian, or REST API connections to read process data and present it through iFactory's modern HMI interface. Your existing field instrumentation, DCS or SCADA system, and control logic remain unchanged. The operator gains a new unified interface that sits above the existing SCADA layer, providing the modern HMI experience without requiring any changes to the underlying control system. SCADA integration typically requires 3–5 days of configuration, and the new operator interface can be deployed alongside the existing HMI during a transition period.
How long does it take to rationalize a typical biogas plant alarm system using the iFactory framework?
The initial alarm rationalization for a typical biogas plant — covering digester operations, CHP engine monitoring, gas treatment, and feedstock handling — is completed in 4–6 weeks. The process begins with an alarm system audit that extracts the current alarm configuration from the SCADA system, categorizes every alarm by process area and current priority, and identifies the alarm load profile. Each alarm is then classified using the three-tier consequence framework — Critical, Warning, Informational — with operator response requirements defined for each tier. The rationalized alarm configuration is deployed to the SCADA system during a planned plant outage or low-activity period. Ongoing alarm management includes monthly alarm load reviews and quarterly rationalization updates to maintain an alarm load below the ISA-18.2 target of 150 alarms per shift.
Can iFactory's HMI design accommodate different operator experience levels and training needs?
Yes. The role-based HMI framework supports configurable interface complexity levels that match operator experience and training progression. New operators are presented with a simplified interface that highlights the most critical plant parameters, provides guided navigation paths, and includes embedded context help for each process view. Experienced operators can enable advanced interface features — detailed trend analysis tools, predictive model configuration access, and customizable dashboard layouts. The interface complexity level is configurable per operator login, allowing the same control room to serve operators at different experience levels without requiring separate screen configurations or limiting the capability available to senior operators.
What hardware is required for iFactory's control room display system?
iFactory's operator interface runs on standard Windows-based workstations and is compatible with any display configuration — single-monitor, dual-monitor, or multi-screen video wall arrangements typical of centralized control rooms. The software is delivered as a thin-client application that can be deployed on existing SCADA workstations without hardware upgrades in most cases. For facilities building a new control room or upgrading display infrastructure, iFactory provides display configuration recommendations including screen size, resolution, and mounting layout based on the number of operator positions, the available wall space, and the specific process views that will be displayed. Video wall support includes configurable display zones for process overview, alarm summary, trend displays, and video surveillance feeds.
How does iFactory integrate predictive analytics into the operator's primary HMI without causing information overload?
Predictive analytics outputs are integrated into the HMI through a dedicated prediction panel that sits alongside the primary process display — visible at all times but positioned to avoid competing with critical real-time data for operator attention. Predictions are displayed with three elements: the predicted event (e.g., "digester VFA imbalance"), the expected time to event (e.g., "4–6 hours at current trend"), and a confidence score (e.g., "87% confidence based on current trend"). Predictions that exceed a configurable confidence threshold generate a visual alert on the prediction panel that operators can acknowledge and investigate without triggering a full alarm cascade. This design enables operators to act on predictive insights as part of their normal monitoring workflow without adding unnecessary cognitive load or contributing to alarm fatigue.Book a Demo
From Reactive Monitoring to Predictive Operations — Transform Your Control Room in Weeks
iFactory AI delivers alarm rationalization, role-based HMI design, predictive analytics integration, and unified operator decision support — purpose-built for biogas and RNG facilities. No SCADA replacement required. No field instrumentation changes. Just a fundamentally better way for your operators to monitor, predict, and control your plant.