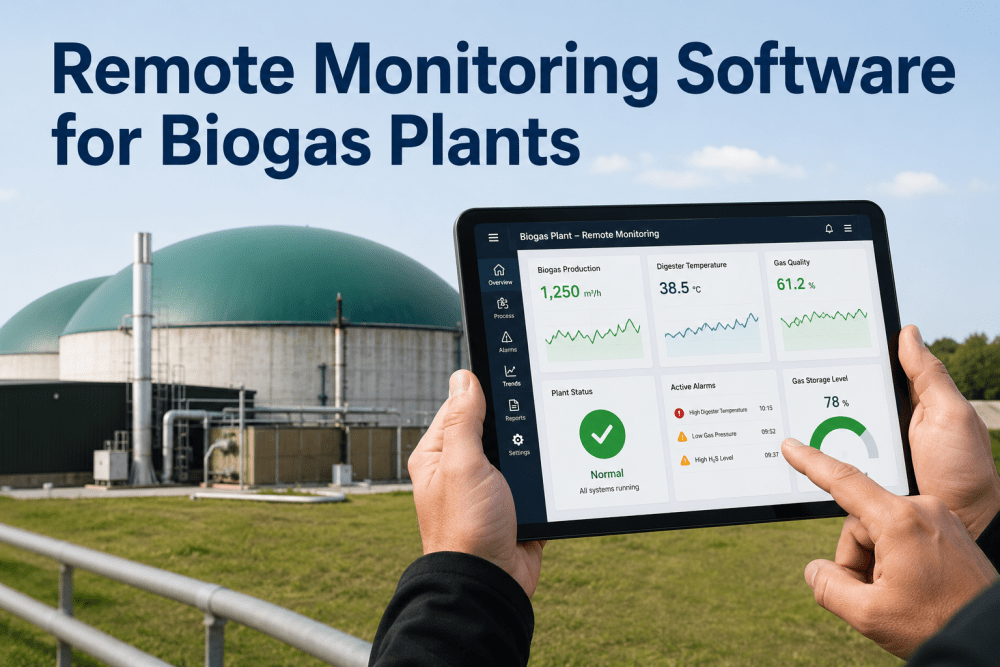
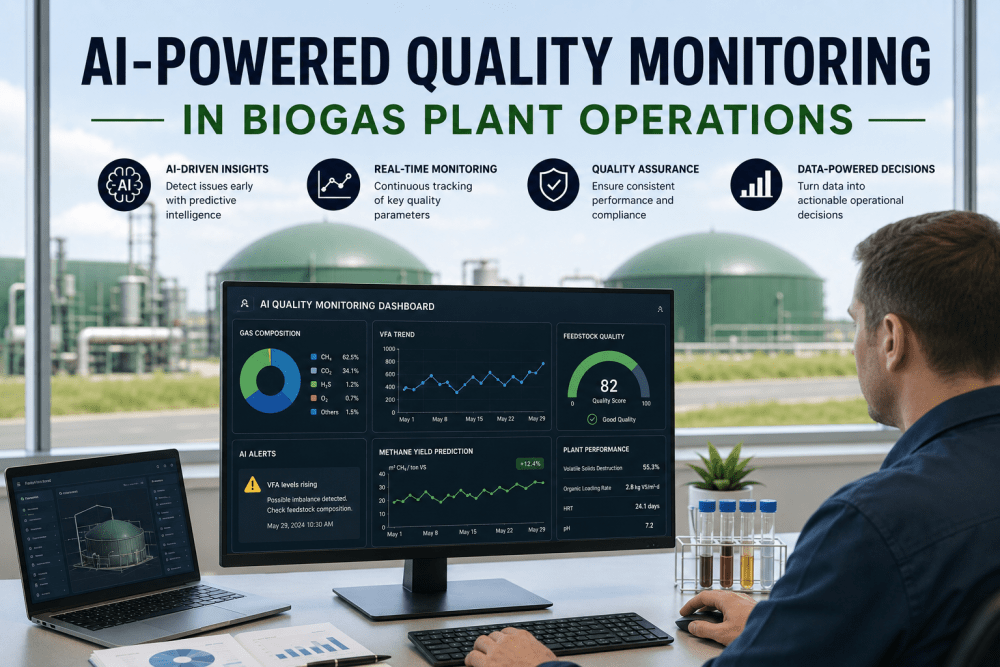
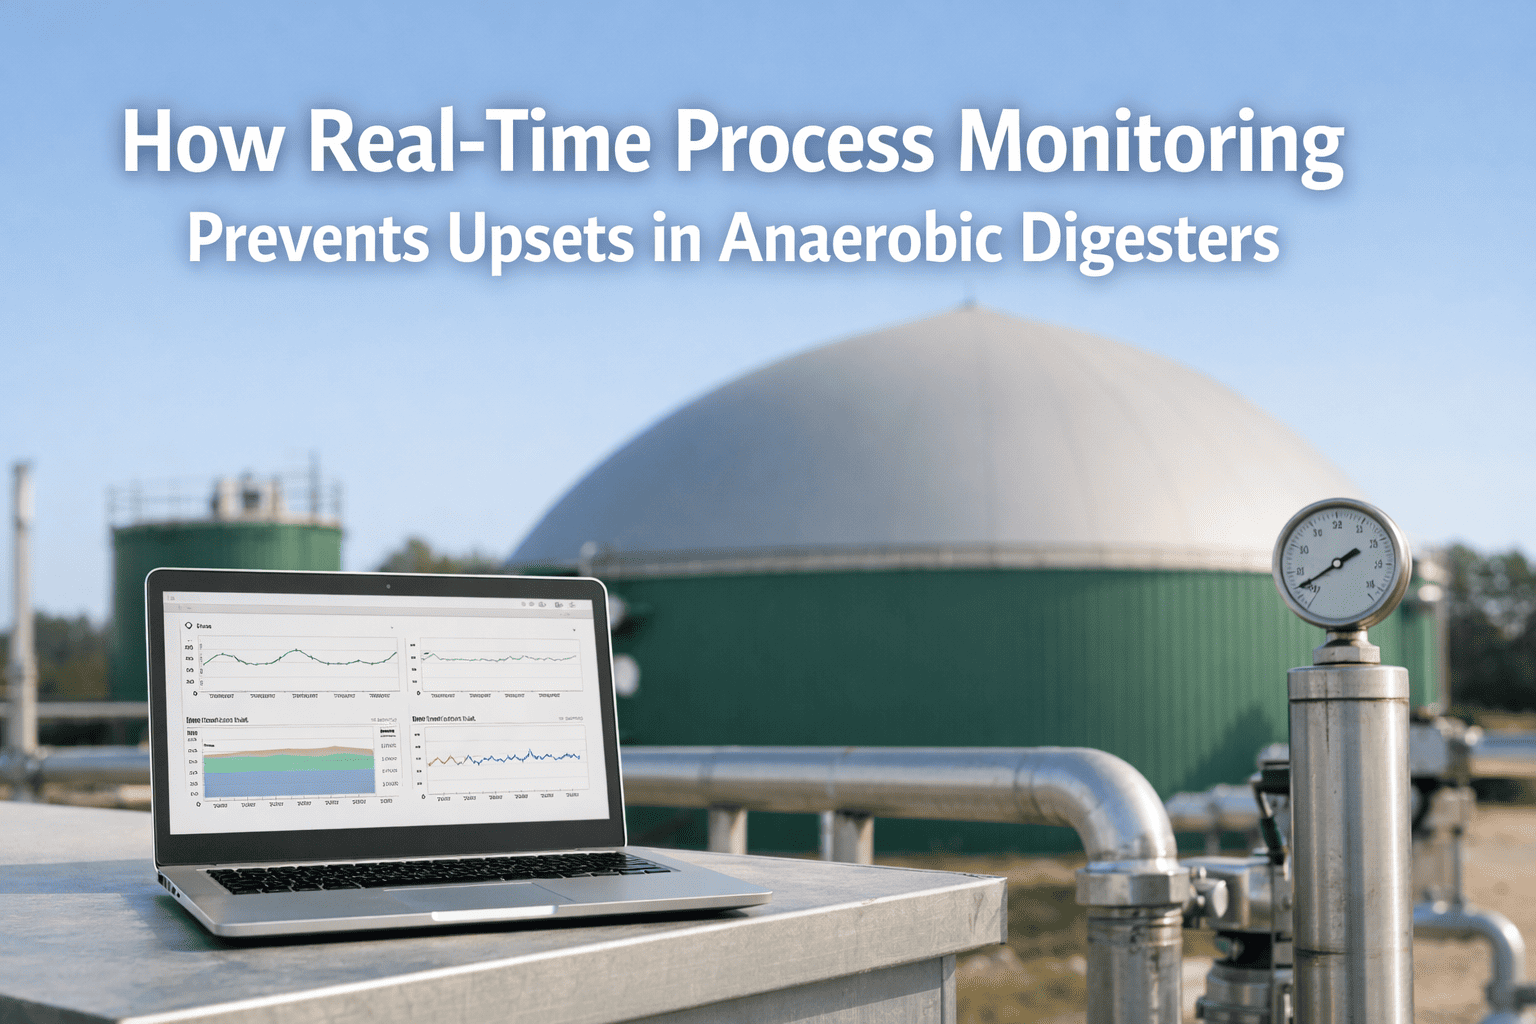
Every biogas plant operator knows the feeling: you pull the month-end report, and the numbers tell a story that the plant floor already lived two weeks ago. A digester temperature crept out of range on a Tuesday night, gas quality dipped below specification Thursday morning, and the CHP engine ran at reduced output all weekend — but none of it was visible until the spreadsheet caught up. A real-time operations dashboard eliminates that lag entirely. Instead of managing biogas production by looking in the rearview mirror, plant leadership gains a live operational view where yield, uptime, gas quality, and cost converge in one interface — updated continuously, visible from the control room to the boardroom, and connected to the SCADA, sensor, and maintenance data that is already being generated every shift.
What Spreadsheet-Based Biogas Monitoring Actually Costs You
Biogas plant operations are inherently dynamic. Feedstock composition shifts daily, digester biology responds on timescales of hours, gas quality fluctuates with temperature and retention time, and CHP engine performance degrades incrementally between maintenance intervals. Spreadsheet-based KPI reporting — whether updated daily, weekly, or monthly — creates a structural blind spot across every one of these dimensions. By the time the monthly OEE figure is calculated, the losses it reflects have already compounded through the balance sheet.
The six operational gaps below document what spreadsheet monitoring systematically misses — and the cost implication of each gap at a facility operating 2–5 MW of installed biogas capacity.
What a World-Class Biogas Real-Time Dashboard Must Show
Not all biogas dashboards are equal. A genuine real-time operations dashboard is not a set of SCADA screens wrapped in a modern UI — it is an integrated operational intelligence layer that pulls from process sensors, gas analyzers, energy meters, CMMS work orders, and feedstock intake logs simultaneously, and presents the combined picture in a format that is actionable at the operator level and reportable at the leadership level without manual data assembly.
The five dashboard modules below define the minimum capability that a biogas plant real-time operations dashboard must deliver to close the spreadsheet blind spots documented above.
Digester Health Module — Live Biological Performance Visibility
The digester health module provides continuous monitoring of the biological process variables that determine methane yield: temperature across multiple digester zones, pH (with automated alkalinity correlation), volatile fatty acid proxy signals from online sensors, organic loading rate against the operational target envelope, and hydraulic retention time calculated from real-time feedstock intake and digester volume data. Deviation alerts fire when any variable exits the operating envelope — not at the end of the shift. iFactory's platform connects to existing temperature transmitters, pH probes, and flow meters through standard industrial protocols, delivering live digester health visibility without sensor replacement.
Gas Quality Module — Real-Time Biogas Specification Tracking
The gas quality module integrates with online gas analyzers to provide continuous methane fraction, CO₂ fraction, H₂S concentration, and moisture content monitoring against the CHP engine fuel specification and grid injection standard. Trend visualization shows the direction and rate of quality change — enabling operators to identify whether a quality deviation is stabilizing or accelerating before committing to a corrective action. Automated alerts fire at configurable thresholds — typically at 80% of the engine H₂S specification limit — giving operators a pre-breach intervention window rather than a post-breach damage assessment. Book a Demo to see iFactory's gas quality monitoring module configured for your analyzer infrastructure.
CHP Performance Module — Engine Efficiency and Health Dashboard
The CHP performance module tracks electrical output versus rated capacity, heat recovery efficiency versus design curve, specific fuel gas consumption per kWh, oil pressure and temperature trends, and vibration signatures where accelerometers are installed. The module displays the CHP heat rate trend against the efficiency baseline established at the last major service — giving maintenance teams the data to distinguish normal wear curves from anomalous degradation that warrants early intervention. Predictive maintenance alerts fire when CHP health indicators trend toward the failure threshold, enabling planned intervention rather than reactive repair.Book a Demo
Energy Balance Module — Net Export and Parasitic Load Tracking
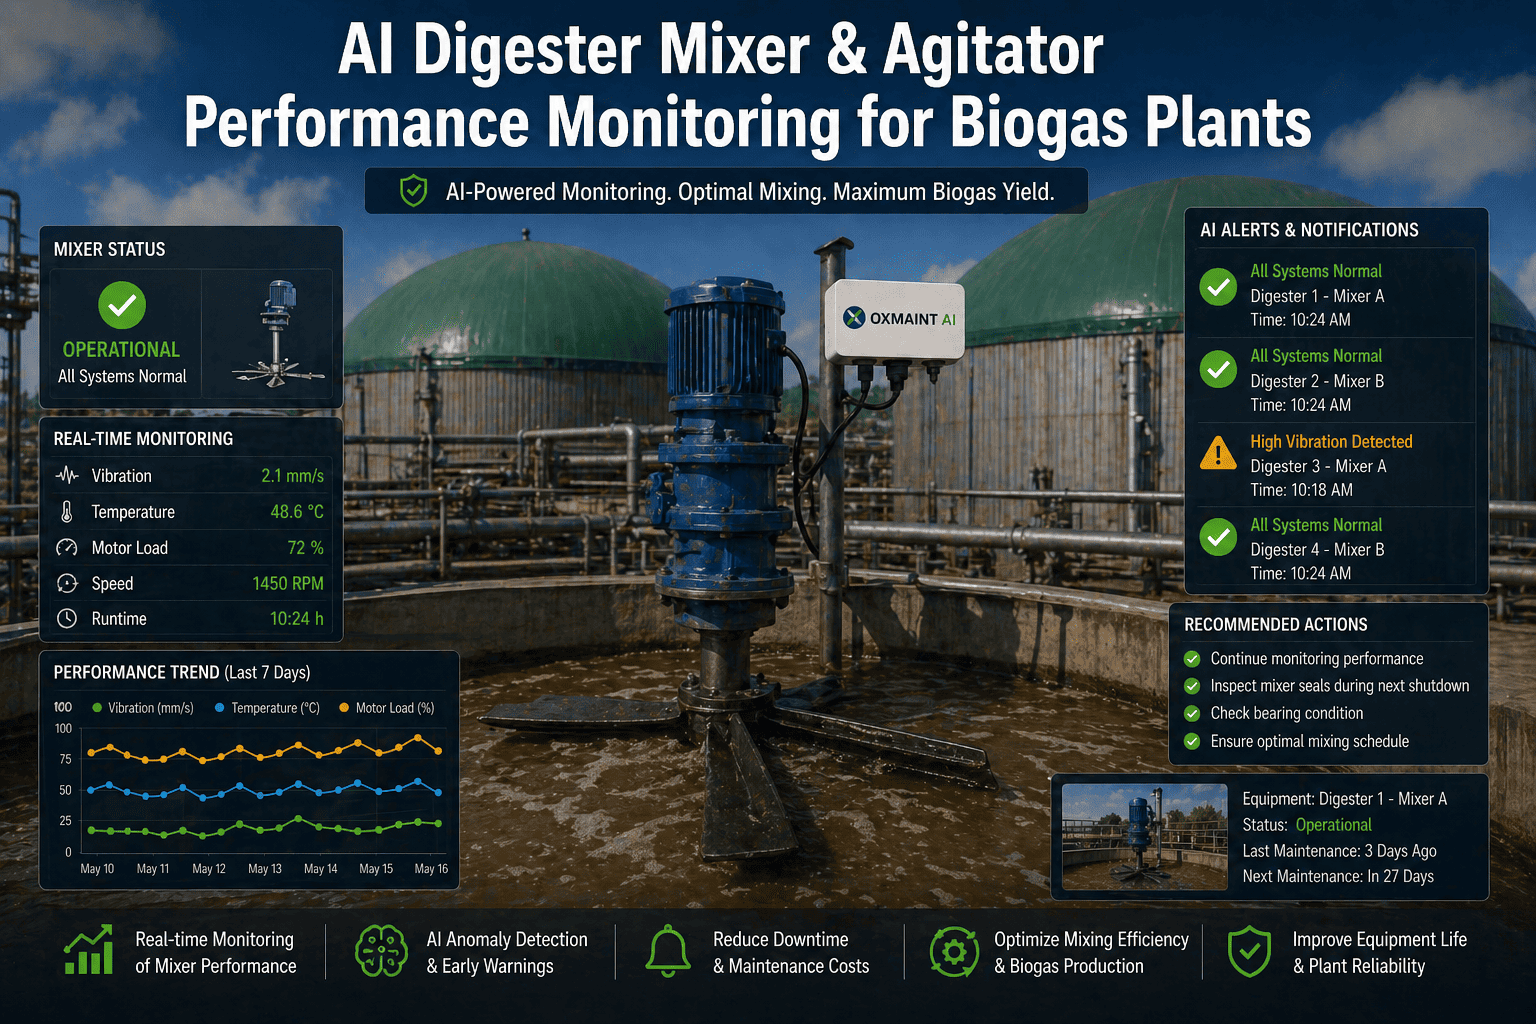
The energy balance module provides a live Sankey-style flow view of gross electrical generation, heat recovery, parasitic load by subsystem (pumps, mixers, compressors, heating), and net export to grid or thermal offtake. Subsystem-level consumption tracking enables operators to isolate efficiency degradation to a specific circuit — a mixer drawing 15% above baseline, a circulation pump with increasing amperage draw — and initiate maintenance before the anomaly accumulates into a measurable net export reduction. Monthly energy cost reporting is automated from the live balance data, eliminating manual spreadsheet assembly.
Spreadsheet KPIs vs. Real-Time Dashboard: The Operational Gap
The performance differential between biogas facilities running on end-of-shift spreadsheet reporting and those with integrated real-time dashboards is not marginal — it is structural. The comparison below documents the operational reality across every dimension of biogas plant management, from daily production decisions to regulatory compliance reporting.Book a Demo
- Digester temperature logged at shift handover — 8-hour blind spot between readings
- Gas quality sampled once or twice per shift — H₂S spikes invisible between samples
- CHP efficiency reviewed in monthly utility bill — degradation accumulates undetected
- OEE calculated weekly from manual downtime logs with recall error
- Feedstock loading adjusted by operator judgment, not live OLR tracking
- PM schedules on calendar basis — no runtime or condition-based triggers
- Energy balance assembled monthly — parasitic load anomalies identified retrospectively
- Regulatory compliance reports compiled manually from shift logs — 4–8 hours per report
- Temperature monitored continuously with automated alerts within 15 minutes of deviation
- Gas quality tracked live from online analyzers — H₂S alert fires before specification breach
- CHP heat rate visualized against efficiency baseline — degradation visible in days, not months
- OEE updated every 30 seconds from equipment signal data — not operator memory
- Live OLR dashboard with deviation alerts drives feedstock adjustment in real time
- PM triggers fire from runtime hours and condition signals — planned, not reactive
- Live Sankey energy balance isolates parasitic load anomalies within hours
- Compliance reports auto-generated from continuous data — 15 minutes, not 8 hours
The 12 Biogas KPIs That Belong on a Real-Time Operations Dashboard
A real-time biogas operations dashboard should not display every data point the SCADA system collects — it should surface the twelve KPIs that most directly determine plant profitability, equipment health, and regulatory compliance. The table below defines each KPI, its measurement source, its target benchmark for a well-operated facility, and the operational action triggered when the KPI moves outside the target range.
| KPI | Module | Measurement Source | Target Benchmark | Action Trigger |
|---|---|---|---|---|
| Methane Yield (Nm³/t VS) | Gas Production | Gas meter + feedstock VS analyzer | 300–450 Nm³/t VS (feedstock-dependent) | Feedstock blend adjustment |
| Digester Temperature (°C) | Digester Health | RTD/thermocouple array | 37–42°C mesophilic; 52–58°C thermophilic | Heating system check |
| H₂S Concentration (ppm) | Gas Quality | Online gas analyzer | <200 ppm (CHP spec); <6 mg/m³ (grid) | Desulfurization adjustment |
| Methane Fraction (%) | Gas Quality | Online gas analyzer | 55–70% (feedstock-dependent) | Feedstock or retention review |
| CHP Electrical Output (kW) | CHP Performance | Power meter / CHP controller | >90% rated capacity at full gas supply | Engine performance review |
| CHP Heat Recovery Rate (%) | CHP Performance | Heat meter + power meter | >85% total efficiency (electrical + thermal) | Heat exchanger inspection |
| Organic Loading Rate (kg VS/m³/d) | Digester Health | Feedstock intake meter + VS analysis | 2.0–4.0 kg VS/m³/d (mesophilic) | Feedstock flow adjustment |
| Net Electrical Export (kWh) | Energy Balance | Export meter | Plant-specific target (75–85% of gross) | Parasitic load audit |
| Digester pH | Digester Health | Online pH probe | 7.0–8.0 (stable methanogenesis) | Alkalinity dosing check |
| CHP Uptime (%) | CHP Performance | Engine controller / PLC | >95% scheduled runtime | PM schedule review |
| Gas Holder Level (%) | Gas Storage | Level transmitter | 40–80% operational range | Production/offtake balance |
| Parasitic Load per kWh Gross (%) | Energy Balance | Sub-metering per circuit | <15% of gross generation | Circuit-level audit |
See Every KPI Live — Digester Health, Gas Quality, CHP Performance, and Energy Balance in One Dashboard
iFactory's Real-Time Operations Dashboard connects to your existing SCADA, gas analyzers, and CMMS infrastructure — delivering the 12 biogas KPIs your team needs to act before losses accumulate, not after month-end reports confirm them.
A 60-Day Path to Real-Time Operations Visibility at Your Biogas Plant
Deploying a real-time operations dashboard at a biogas facility does not require replacing existing SCADA systems, installing new sensor infrastructure, or engaging a multi-year implementation program. iFactory connects to the data sources already present at the plant — process PLCs, gas analyzers, energy meters, and CMMS
Days 1–14: Data Connectivity and KPI Baseline
Connect iFactory's platform to existing SCADA historians, PLC data streams, gas analyzer outputs, and energy sub-meters through OPC-UA and MQTT protocols. Establish baseline values for the 12 primary KPIs from 90 days of historical data where available. Define alert thresholds for each KPI based on plant-specific operating specifications and equipment limits. Most facilities complete initial connectivity and live dashboard activation within the first 10 days of the deployment engagement.Book a Demo
Days 15–30: Alert Configuration and Operator Interface Deployment
Configure deviation alerts for digester health, gas quality, and CHP performance variables with tiered severity levels — advisory, warning, and critical — mapped to the operational response procedures already in place at the facility. Deploy the operator-facing dashboard interface on control room screens and mobile devices, enabling shift supervisors to monitor all 12 KPIs simultaneously without navigating multiple SCADA windows.
Days 31–45: CMMS Integration and Predictive Maintenance Activation
Integrate the CMMS work order system with the real-time dashboard so that CHP runtime hours, digester equipment condition signals, and gas handling system sensor data trigger PM work orders automatically against actual condition rather than calendar assumptions. Activate predictive maintenance alerts on the CHP engine using vibration, temperature, and efficiency trend data.
Days 46–60: Management Reporting Automation and Continuous Improvement Framework
Automate the monthly regulatory compliance reports, utility billing reconciliation, and operational KPI summaries from the continuous dashboard data — eliminating 8–15 hours of manual data assembly per reporting cycle. Facilities completing this sequence consistently achieve 10–18% methane yield improvement and 35–45% CHP downtime reduction within the first operating quarter. Book a Demo to build your site-specific deployment plan with iFactory's biogas team.
How Real-Time Dashboard Intelligence Transforms Biogas Plant Economics
Real-time operations visibility delivers compounding returns across three dimensions simultaneously — yield recovery, cost reduction, and compliance efficiency. The grid below maps the specific operational outcomes iFactory's Real-Time Dashboard delivers for biogas plant operators across each dimension.
Yield Recovery
- 12–18% methane yield improvement through real-time digester monitoring and early deviation correction
- Feedstock loading optimized continuously against live OLR targets — not daily averages
- Gas quality deviations corrected 6–8 hours earlier than end-of-shift sampling allows
Cost Reduction
- CHP unplanned downtime reduced 40% through predictive maintenance and live engine health monitoring
- Parasitic load anomalies isolated within hours — not identified in monthly utility bills
- Manual reporting labor reduced by 8–15 hours per reporting cycle through automated data assembly
Compliance Efficiency
- Regulatory compliance reports auto-generated from continuous data — 15 minutes versus 8 hours
- Continuous gas quality records eliminate sample-gap compliance risk
- Audit-ready data trail maintained automatically across all monitored parameters
Expert Perspective: What Real-Time Visibility Actually Changes at a Biogas Facility
The conversation about real-time dashboards in biogas operations tends to focus on the technology — the data connections, the visualization, the alerting. What practitioners understand, and what the technology vendors often understate, is that the transformation is fundamentally behavioral. When operators can see the digester temperature trend in real time, they do not wait for the shift handover to flag a deviation — they act when the trend line changes direction, not when it has already moved 3°C outside the target. When the gas quality dashboard shows H₂S trending upward at 8:00 AM, the desulfurization adjustment happens at 8:15 AM, not at 4:00 PM when the end-of-shift sample confirms what the trend already showed six hours earlier. The yield improvement is real, but it is secondary to the operational discipline change that real-time visibility enforces. Plants that implement a dashboard and continue to manage by shift-end summaries get 30% of the available benefit. Plants that reorganize their shift routines around the live data get the other 70%.Book a Demo
The technical integration delivers the data; the real-time dashboard interface delivers the behavior change; and the combination delivers the yield, uptime, and compliance outcomes documented in this article. Book a Demo to see how iFactory's platform would integrate with your facility's existing data infrastructure and operational workflows.
Real-Time Operations Dashboards Are the Operational Floor for Competitive Biogas Facilities
Biogas plants operating on spreadsheet KPIs are not just managing with less visibility — they are structurally unable to respond to the operational events that determine plant economics at the speed those events require. A digester temperature deviation managed 8 hours late instead of 15 minutes late costs yield that cannot be recovered. A gas quality spike that triggers an H₂S alarm instead of a pre-breach trend alert risks engine damage that a planned desulfurization adjustment would have prevented at zero cost
The 60-day deployment pathway described in this article connects iFactory's Real-Time Operations Dashboard to your existing plant data infrastructure — SCADA, gas analyzers, energy meters, CMMS — without replacing it. The result is live visibility across the 12 KPIs that determine biogas plant profitability, available to operators at shift level and to leadership at board level, generated automatically and continuously. Book a Demo with iFactory's biogas operations team to see the platform configured for your facility's specific data architecture and operational requirements.
Deploy Live Operations Intelligence Across Your Biogas Plant — Visibility in 60 Days
iFactory gives biogas plant operators live KPI dashboards, automated deviation alerts, predictive CHP maintenance, and compliance reporting automation — all connected to existing SCADA and gas analyzer infrastructure without replacement.
Biogas Real-Time Dashboard — Frequently Asked Questions
A comprehensive biogas real-time dashboard integrates with process PLCs and SCADA historians for digester temperature, pH, flow rates, and equipment status; online gas analyzers for continuous methane fraction, H₂S, and CO₂ data; energy sub-meters for CHP output and parasitic load by circuit; CMMS platforms for maintenance work order status and equipment runtime hours; and feedstock intake systems for organic loading rate calculation. iFactory connects to all of these through standard OPC-UA and MQTT protocols, without requiring replacement of existing SCADA or analyzer infrastructure.
iFactory's standard deployment pathway delivers initial data connectivity and a live KPI dashboard within the first 10–14 days of engagement for most biogas facilities with existing SCADA and PLC infrastructure. Full deployment — including CMMS integration, predictive maintenance alert configuration, and automated reporting — is typically complete within 60 days. Facilities without existing gas analyzers or energy sub-meters may require an additional 2–4 weeks for sensor installation before the full 12-KPI dashboard is active.
A real-time dashboard replaces the data compilation and calculation functions of manual shift logs — all KPI values, trend data, and deviation events are captured automatically from sensor and equipment signals. It does not replace the operator judgment and observation notes that shift logs also contain. iFactory's platform includes a digital shift logbook module that operators complete at handover, but the quantitative KPI data is pre-populated from the dashboard automatically — reducing shift log completion time from 20–40 minutes to under 5 minutes while improving data accuracy by eliminating recall error.
For a 2 MW biogas facility generating approximately 15–17 million kWh annually, a 12% methane yield improvement represents 1.8–2.0 million kWh of additional annual generation — worth $180,000–$220,000 at typical renewable energy contract rates. Combined with 40% CHP downtime reduction (eliminating 3–4 unplanned outages per year at $800–$2,400/hr each) and 8–15 hours of monthly reporting labor savings, the total annual benefit typically falls in the range of $250,000–$380,000 against a platform investment that delivers positive ROI within 6–9 months. Book a Demo to model your specific facility's ROI scenario with iFactory's biogas team.
Yes. iFactory supports three deployment architectures for biogas facilities at different automation maturity levels. For facilities with existing SCADA and PLC infrastructure, the platform connects as an intelligence overlay without modification. For facilities with PLCs but no SCADA historian, iFactory deploys edge gateway hardware that captures PLC data streams directly. For facilities with minimal automation, iFactory's IoT sensor kit provides the temperature, pressure, flow, and gas quality measurement infrastructure needed to build the live dashboard from scratch. The 60-day deployment timeline applies to all three architectures, though the sensor installation phase adds 2–4 weeks for the third scenario.