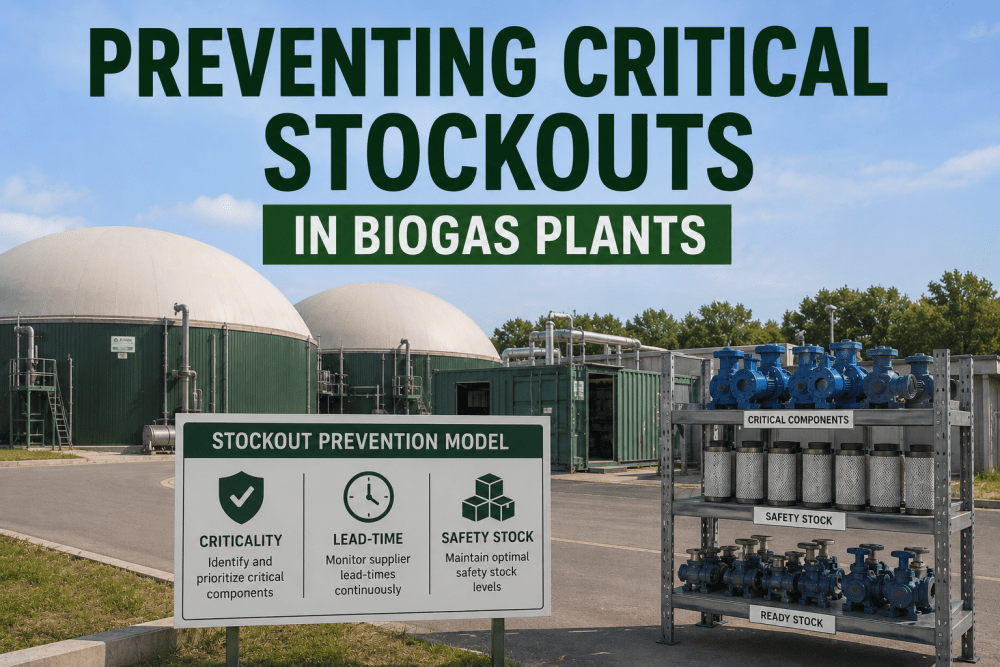
Biogas plants operate a unique inventory challenge: overstock generic consumables by 40 percent while running out of critical CHP engine spares during peak production. iFactory's AI platform brings predictive demand modeling and ABC-VED classification to biogas MRO management, helping procurement teams Book a demo to see how data-driven inventory optimization unlocks working capital while improving parts availability.
The Spare Parts Inventory Challenge in Biogas Operations
Why Generic MRO Strategies Fail in Anaerobic Digestion Environments
Biogas plants occupy a difficult position in the MRO landscape. They combine heavy industrial rotating equipment (CHP engines, compressors, feed pumps) with process-specific assets (digester mixing systems, gas treatment skids, membrane filtration) and standard facility equipment (HVAC, electrical, instrumentation). Operations teams that Book a demo of iFactory's MRO optimization module discover how the platform segments spare parts by criticality, lead time, and consumption velocity to build a tailored stocking strategy for each asset class.
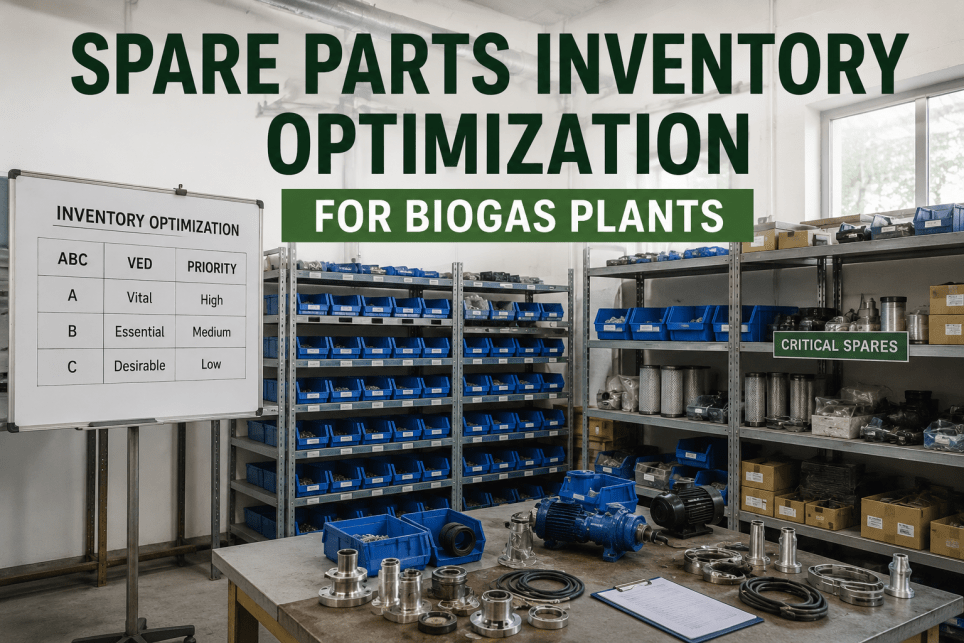
ABC-VED Analysis for Biogas MRO Optimization
A Combined Classification Framework for Spare Parts Prioritization
The most effective approach to biogas spare parts optimization combines two established classification methodologies. ABC analysis ranks parts by annual consumption value, while VED analysis ranks them by operational criticality (Vital, Essential, Desirable).Procurement teams that Book a demo see how iFactory automates this classification using live consumption data and asset criticality scores from the digital twin.
| VED \ ABC | A — High Value (Top 20% of spend) | B — Medium Value (Next 30%) | C — Low Value (Bottom 50%) |
|---|---|---|---|
| V — Vital | Maximum stock / Zero stockout tolerated / E.g. CHP injectors, cylinder heads | Moderate stock / Expedited delivery / E.g. Digester mixer seals, gas compressor valves | Low stock / Standard procurement / E.g. Critical gaskets, specialty lubricants |
| E — Essential | Calculated safety stock / Risk-based / E.g. Heat exchanger plates, pump impellers | Optimized reorder point / EOQ model / E.g. Drive belts, mechanical seals | Minimum stock / Just-in-time / E.g. Standard filters, basic seals |
| D — Desirable | Low stock / Long lead time acceptable / E.g. Upgrade kits, non-critical sensors | Minimal stock / Vendor-managed / E.g. General instrumentation, standard valves | Zero stock / Order on demand / E.g. Consumable hardware, standard fittings |
Key Performance Indicators for Spare Parts Optimization
The Metrics That Drive Biogas MRO Excellence
Effective spare parts inventory management requires tracking a balanced set of leading and lagging indicators that capture both cost efficiency and operational risk. Plants that optimize solely for inventory reduction often increase stockout risk, while those that optimize solely for availability accumulate excessive carrying costs. Engineering and operations teams that Book a demo get access to iFactory's MRO dashboard, which presents these KPIs in a single view with AI-driven recommendations for each metric.
A Five-Step Framework for Biogas MRO Optimization
From Inventory Assessment to AI-Driven Demand Forecasting
Deploying a structured spare parts optimization program follows a proven progression that builds data integrity and operational confidence at each stage. iFactory's implementation approach has been refined across dozens of renewable energy facilities, ensuring that each phase delivers measurable working capital and uptime improvements. Operations leaders who Book a demo receive a deployment roadmap tailored to their specific asset portfolio, current CMMS infrastructure, and organizational maturity.
Frequently Asked Questions
What is ABC-VED analysis and why is it relevant for biogas plants?
ABC-VED is a combined classification framework that ranks spare parts by both cost impact (ABC: High, Medium, Low annual consumption value) and operational criticality (VED: Vital, Essential, Desirable for production). For biogas plants, this dual classification is essential because a low-cost part like a CHP spark plug can be Vital for production while a high-cost part like a backup pump motor may be only Desirable. The 3x3 matrix produces distinct stocking strategies for each combination.
How much working capital can a biogas plant unlock through inventory optimization?
Typical biogas facilities using iFactory's optimization platform reduce total MRO inventory value by 25–35 percent within the first year. For a 1 MW plant carrying $280,000 in spares, this represents $70,000–$98,000 in released working capital. Additional savings come from reduced emergency shipping costs (typically 40–60 percent reduction) and lower carrying costs through elimination of obsolete inventory.
What data is needed to start AI-driven spare parts demand forecasting?
The foundational requirement is 12–24 months of CMMS work order history showing parts consumption, CHP engine operating hours, and digester run-time data. iFactory's platform integrates with leading CMMS systems including SAP, Maximo, and Maintenance Connection, as well as direct SCADA historians for equipment usage data. The AI model requires consumption history across at least two seasonal cycles to capture the full operating pattern of the biogas plant.
How does the platform handle CHP engine-specific spare parts with long lead times?
CHP engine spares are automatically classified as Vital-High Value (V-A) in the ABC-VED matrix, triggering the highest level of inventory protection. iFactory's predictive model uses engine operating hours, service interval data, and historical failure patterns to forecast consumption 90 days in advance. When stock levels for a V-A part drop below the calculated reorder point, the platform generates a purchase requisition with sufficient lead time buffer to avoid emergency shipping.
What is the typical payback period for implementing MRO inventory optimization?
Most biogas plants achieve full return on investment within 6–9 months of deploying iFactory's MRO optimization platform. The payback is driven by three primary sources: working capital release from inventory reduction, elimination of emergency shipping premiums, and reduced downtime from improved critical spare availability. Plants with larger inventories and higher CHP utilization rates typically see faster payback due to the compounding effect of multiple optimization levers.