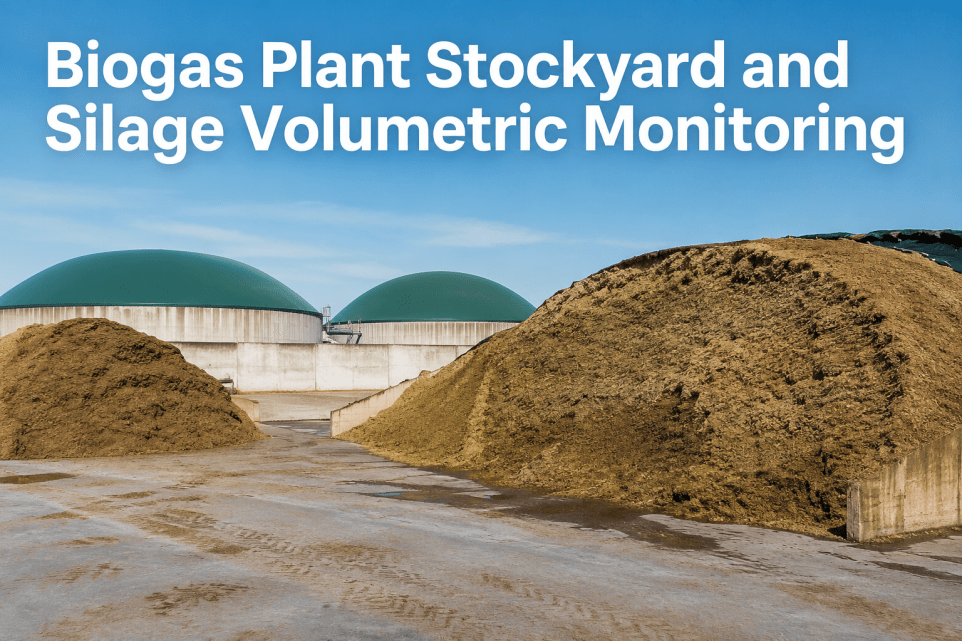
Biogas Plant Stockyard and Silage Volumetric Monitoring
By James Talon on June 12, 2026
Biogas plant stockyards hold hundreds of thousands of dollars in silage and solid feedstock inventory at any given moment — corn silage, grass silage, woody biomass, green waste, and digestate awaiting removal — yet most facilities still estimate stockpile volume using visual observation, loader bucket counts, or occasional weighbridge passes as feedstock is moved to the digester. Procurement and operations managers who Book a Demo discover how iFactory transforms stockyard inventory management from visual estimation into continuous volumetric intelligence.
85%
Average stockyard inventory accuracy without volumetric monitoring — compared to 98%+ accuracy with drone-based photogrammetric surveys and density mapping
20%+
Typical overestimation of available feedstock when relying on visual pile estimates rather than measured volumetric survey data
12K
Tons of silage that can decompose undetected in a 20,000-ton stockpile without proper density and temperature monitoring
40%
Reduction in feedstock spoilage achieved with regular drone-based volumetric monitoring and density mapping workflows
The Challenge of Inaccurate Stockyard Inventory in Biogas Operations
Most biogas plant operators can state the design capacity of their digester, their target methane yield, and their annual feedstock budget to within small margins. Far fewer can state within 10 percent the actual tonnage of silage sitting in their stockyard at the beginning of any given month — yet that number drives the most consequential operational decisions the plant makes. Operations managers who Book a Demo see how iFactory's stockyard module closes this gap with drone-based survey integration and automated volumetric analytics.
Visual Estimation Error
Stockpile volume estimated by operator visual assessment or loader bucket counting produces routine errors of 15–25 percent. Overestimation causes plants to delay procurement actions until feedstock shortages force emergency sourcing at premium prices.
HIGH RISK
Silage Spoilage From Overextended Storage
Without accurate volume tracking, silage piles remain in storage beyond optimal feedout windows. Surface spoilage, aerobic deterioration, and dry matter losses can exceed 15 percent of the stored tonnage before the degradation is visually apparent.
HIGH RISK
No Density Variability Tracking
Stockpile volume alone is insufficient for inventory management — density varies significantly with compaction method, feedstock type, moisture content, and storage depth. Without density mapping, volumetric data cannot be accurately converted to tonnage for procurement planning.
MEDIUM RISK
Feedstock Planning Based on Assumption
Seasonal feedstock procurement decisions made without accurate stockyard inventory data force plants to either over-contract (wasting working capital on unnecessary feedstock) or under-contract (creating mid-winter shortages at premium spot prices).
MEDIUM RISK
Disconnected Silo Data
Stockyard inventory data lives in loader operator logs, weighbridge records, and spreadsheet trackers that never reconcile with each other. Without a unified digital record, the plant manager cannot answer the simple question of how many tons of usable feedstock are actually available today.
MEDIUM RISK
Working Capital Trapped in Invisible Inventory
Silage and solid feedstock represent significant working capital that is effectively invisible when volume and quality are not measured. Overstocked piles of degraded material tie up capital that could be released through accurate inventory data and demand-aligned procurement.
MANAGED RISK
Volumetric Measurement Technologies for Biogas Stockyard Monitoring
Engineering and operations leaders who Book a Demo receive a stockyard technology assessment that maps their current measurement practices against the accuracy requirements of their feedstock planning and inventory management processes.
Technology
Measurement Method
Typical Accuracy
Survey Frequency
Operational Impact
Best Fit
Visual Estimation
Operator visual assessment of pile dimensions. Bucket count multiplied by estimated bucket volume.
75–85%
Daily or weekly
Minimal — operator estimates during normal operations
Baseline comparison only. Not recommended for procurement planning or spoilage tracking.
Ground-Based Photogrammetry
Handheld camera or tablet capture of pile images from multiple angles. Software generates 3D model and volume calculation.
90–95%
Weekly to monthly
Low — ground survey takes 30–60 minutes per pile
Facilities without drone capability. Lower-cost entry point for digital volumetric tracking.
Drone-Based Photogrammetry
Automated drone flight over stockyard captures overlapping georeferenced images. Point cloud processing generates digital surface model with sub-centimeter resolution.
97–99%
Weekly to monthly
Low — automated flight with pre-programmed waypoints. 15–30 minutes for a 5-acre stockyard.
Optimal technology for most biogas facilities. Combines high accuracy with low operational disruption and scalable survey coverage.
Terrestrial LiDAR Scanning
Ground-based laser scanner captures millions of measurement points per scan. Generates high-density point cloud with millimeter precision.
99%+
Monthly to quarterly
Moderate — requires 1–3 hours per pile with equipment setup. Pile surfaces must be accessible to scanner line of sight.
Facilities requiring highest accuracy for volumetric reconciliation. Useful for calibration of drone-based survey results.
Weighbridge Flow Tracking
Cumulative inbound and outbound tonnage tracked through weighbridge system. Stockyard inventory calculated as running balance.
88–92%
Continuous
Minimal — automated from weighbridge system
Essential complement to all volumetric methods. Weighbridge data provides mass flow verification for volume-to-tonnage conversion.
Evaluating stockyard volumetric monitoring technology for your biogas facility? Book a 30-minute Stockyard Assessment with iFactory's feedstock inventory analytics team.
Drone-Based Volumetric Survey Workflow for Biogas Stockyards
Implementing a systematic drone-based volumetric monitoring program follows a structured workflow that integrates survey planning, flight execution, point cloud processing, volume calculation, and inventory data integration into the plant's feedstock management system. iFactory's stockyard module manages each stage of this workflow — from automated flight planning based on the facility's stockyard layout to integrating calculated volumes with weighbridge mass flow data and feedstock quality records. Operations managers who Book a Demo receive a stockyard survey plan customized to their facility's layout and feedstock inventory management requirements.
01
Survey Planning and Flight Automation
iFactory's stockyard module generates automated flight waypoints based on the facility's stockyard dimensions, pile layout, and required survey resolution. The flight plan accounts for obstacle avoidance zones, regulatory flight altitude restrictions, and overlap requirements for photogrammetric processing. Surveys are scheduled weekly for active stockpiles and monthly for long-term storage areas.
02
Automated Aerial Image Capture
The drone executes the pre-programmed flight autonomously, capturing georeferenced overlapping images at 100–150 feet altitude with 70–80 percent forward and side overlap. Ground control points placed at fixed locations around the stockyard are captured in the survey for georeferencing accuracy. A 5-acre stockyard survey is completed in 15–20 minutes with no operator intervention required during flight.
03
Point Cloud Processing and Digital Surface Model Generation
Captured images are processed through photogrammetric software that generates a dense 3D point cloud with sub-centimeter resolution. The point cloud is filtered to remove vegetation, equipment, and structures — producing a bare-earth digital surface model of each stockpile. iFactory's platform processes survey data automatically and calculates volume against the pre-survey reference surface within 2–4 hours of flight completion.
04
Volume Calculation and Density-Adjusted Tonnage Conversion
Calculated stockpile volume is converted to estimated tonnage using feedstock-specific density curves that account for compaction, moisture content, and storage depth. For facilities with weighbridge mass flow data, iFactory continuously reconciles volumetric measurements against actual inbound and outbound tonnage — refining density assumptions and improving tonnage accuracy with each survey cycle.
05
Inventory Reconciliation and Procurement Planning Integration
Stockyard inventory data is integrated with the facility's feedstock procurement plan and digester feed schedule. iFactory's platform generates automated alerts when stockpile inventory falls below procurement lead-time thresholds, when silage age exceeds recommended feedout windows, or when the rate of inventory depletion deviates from the procurement plan. Historical inventory data feeds seasonal procurement planning models that optimize contract volumes against measured stockyard capacity and consumption patterns.
Every Ton of Silage You Cannot Measure Is a Procurement Decision You Are Making Blind.
iFactory's stockyard volumetric monitoring module integrates drone-based surveys, density mapping, and automated inventory analytics into a single feedstock management platform — converting stockpile geometry into procurement intelligence that protects digester feed continuity and reduces working capital tied up in invisible inventory.
Measurable Impact of Systematic Volumetric Monitoring on Biogas Plant Performance
Beyond the operational improvements in inventory accuracy and procurement planning, systematic stockyard volumetric monitoring delivers direct financial returns through reduced spoilage, optimized feedstock procurement, and working capital release. The following KPIs reflect aggregated performance data from biogas facilities using iFactory's stockyard volumetric monitoring platform.
98%+
Stockyard Inventory Accuracy
Drone-based photogrammetry with density-adjusted tonnage conversion achieves inventory accuracy exceeding 98 percent — compared to 75–85 percent under visual estimation methods.
40%
Reduction in Feedstock Spoilage
Regular volumetric monitoring combined with silage age tracking enables proactive feedout scheduling that minimizes dry matter loss and aerobic deterioration in silage stockpiles.
12%
Working Capital Release
Accurate inventory data enables optimized procurement contracting — reducing safety margin overstocking while maintaining full feed continuity through seasonal supply gaps.
20 min
Survey Time Per Flight
Fully automated drone survey of a 5-acre stockyard from takeoff to landing — no operator intervention required beyond initiating the pre-programmed flight mission.
100%
Stockpile Coverage
Every stockpile in the yard captured in every survey — no skipped piles, no inaccessible areas, no measurement gaps that create blind spots in inventory data.
7 Days
Deployment to First Survey
From platform deployment to first completed aerial survey with calculated stockpile volumes — including flight planning, ground control point setup, and point cloud processing configuration.
98%+
Volumetric Accuracy
Drone photogrammetry with ground control delivers sub-centimeter resolution and volume accuracy exceeding 98%
Auto
Flight Planning
Pre-programmed waypoints and obstacle avoidance for fully automated stockyard survey missions
2–4 hrs
Processing Time
From flight completion to calculated stockpile volumes integrated into feedstock management platform
Continuous
Mass Reconciliation
Weighbridge flow data continuously validates volumetric calculations and refines density assumptions
Evaluating stockyard volumetric monitoring technology for your biogas facility? Book a 30-minute Stockyard Assessment with iFactory's feedstock inventory analytics team.
What Biogas Operators Say About Systematic Stockyard Volumetric Monitoring
We had been running our 2.8 MW facility for six years on loader bucket counts and operator gut feel for stockyard inventory. Every fall we would contract for corn silage based on a rough estimate of what was left in the pile from the previous season — and every spring we would discover we had either over-contracted by 15 percent or come up short for the summer shoulder months. Our first drone survey with iFactory showed us that the silage pile we thought contained 18,000 tons actually held 14,200 tons. We had been operating on a 21 percent inventory error for years. In the twelve months since deploying regular monthly surveys, we have eliminated our seasonal feedstock shortfall, reduced our silage procurement volume by 12 percent without any reduction in digester throughput, and cut spoilage-related dry matter loss by nearly half. The drone pays for itself in avoided over-procurement alone.
Plant Manager and Feedstock Procurement Lead
2.8 MW Agricultural and Food Waste Biogas Facility, Upper Midwest USA
The biggest surprise for us was not the volume data — it was the density data. We knew that silage density varied across the pile, but we had no idea how much until iFactory started correlating our drone survey volumes with weighbridge records. The center of our bunker silos was compacting at almost 50 percent higher density than the outer edges, which meant our volume-based tonnage estimates were consistently undercounting the usable tonnage in the pile core. That changed how we approach both our compaction practices and our volume-to-tonnage conversion. We now use zone-specific density curves that adjusted our effective inventory by about 11 percent. The combination of accurate volume measurement and density-adjusted tonnage conversion has given us the most reliable feedstock inventory data we have ever had in 15 years of operation.
Operations Director
3.5 MW Agricultural Biogas and RNG Facility, Ontario, Canada
Implementation Considerations for Drone-Based Stockyard Monitoring
Drone Selection and Regulatory Compliance: Select a drone platform with GPS-grade RTK capability, obstacle avoidance, and automated flight planning. Verify FAA Part 107 compliance or equivalent local regulatory authorization for commercial drone operations over the facility.
Ground Control Point Installation: Install permanent ground control points at fixed locations around the stockyard perimeter for survey georeferencing accuracy. Minimum 5 control points for a typical 5–10 acre stockyard with annual survey-grade GPS verification.
Pre-Survey Reference Surface Definition: Establish the baseline bare-earth surface model of the empty stockyard as the reference for all future volume calculations. The reference surface must be resurveyed after any grade changes or stockyard reconfiguration.
Feedstock-Specific Density Curve Development: Develop density curves for each feedstock type and storage method — accounting for compaction method, pile height, moisture content range, and storage duration. Refine curves through weighbridge reconciliation during the first 6 months of deployment.
Survey Frequency and Trigger Definition: Establish survey schedule based on stockyard turnover rate. Weekly surveys recommended for active feedout piles during peak consumption. Monthly surveys sufficient for long-term storage. Additional surveys triggered by significant procurement events, extreme weather, or inventory reconciliation thresholds.
Integration With Feedstock Procurement and Digester Feed Systems: Connect stockyard inventory data to procurement planning models, digester feed rate scheduling, and silage age tracking workflows. Automated alerts for inventory below procurement lead-time thresholds and silage exceeding recommended feedout windows.
Weather and Seasonal Constraints: Plan survey windows around weather constraints — optimal survey conditions are overcast skies (minimizing shadows in photogrammetry) with wind speeds below 15 mph. Winter snow cover prevents accurate surface measurement; establish pre-snow baseline surveys and post-thaw verification protocols.
Data Archiving and Trending: Maintain historical survey archive for at least 3 years for procurement planning trend analysis, spoilage rate calculation, and density curve refinement. iFactory's platform stores all survey point clouds, calculated volumes, and reconciled tonnage data in a queryable time-series database.
Evaluating stockyard volumetric monitoring technology for your biogas facility? Book a 30-minute Stockyard Assessment with iFactory's feedstock inventory analytics team.
Conclusion: What Gets Measured Gets Managed in the Biogas Stockyard
The stockyard is the largest unmeasured variable in most biogas plant operations. Operators invested in sophisticated digester monitoring systems, CHP engine analytics platforms, and gas treatment process controls still manage their largest physical inventory asset — thousands of tons of silage and solid feedstock — through visual estimates and informal loader bucket counts. The gap between the intelligence applied to the digester and the intelligence applied to the stockyard represents the single largest opportunity for operational improvement at most facilities.
Closing that gap does not require replacing the stockyard with automated infrastructure. It requires adding a systematic volumetric measurement capability — drone-based photogrammetry, density-adjusted tonnage conversion, and inventory analytics — that converts the physical stockpile geometry into the same quality of decision data that the rest of the plant operates on. The technology is proven, the accuracy is validated at 98 percent or better, and the financial return from reduced spoilage, optimized procurement, and working capital release is measurable within the first procurement cycle.
iFactory's stockyard volumetric monitoring module delivers that capability in a single integrated platform — from automated drone flight planning through point cloud processing, density-adjusted tonnage conversion, and procurement planning integration. Operations and procurement teams across the United States and Canada are already using iFactory to achieve 98 percent inventory accuracy, reduce feedstock spoilage by 40 percent, and release working capital tied up in invisible stockyard inventory. Book a Demo to see your stockyard's current measurement accuracy and the volumetric monitoring framework that will eliminate your blind spots.
Frequently Asked Questions
In the United States, commercial drone operations require the remote pilot to hold an FAA Part 107 Remote Pilot Certificate. Operations team members can obtain this certification through a written knowledge test that typically requires 2–4 weeks of study. Many biogas facilities designate one or two operations staff as Part 107 certified pilots for stockyard survey duties. For facilities that prefer not to manage drone operations in-house, iFactory partners with local drone service providers who can perform surveys on a scheduled or on-demand basis. The survey data is uploaded to iFactory's platform for processing regardless of whether the flight was performed by in-house staff or by a third-party service provider.
Drone-based photogrammetry with properly placed ground control points and high-overlap image capture consistently achieves volume accuracy of 97–99 percent for stockpile applications — comparable to terrestrial LiDAR scanning for most stockyard geometries. LiDAR maintains a marginal accuracy advantage (99%+ vs. 97–99%) for stockpiles with uniform or low-texture surfaces where photogrammetric feature matching is more challenging. However, the operational advantages of drone-based surveys — faster coverage, no ground-based line-of-sight constraints, and lower equipment cost — make photogrammetry the preferred technology for routine stockyard monitoring at most biogas facilities. iFactory's platform can integrate data from either technology, so facilities can use photogrammetry for routine surveys and LiDAR for periodic calibration or high-accuracy reconciliation.
Volume-to-tonnage conversion uses feedstock-specific density curves that account for multiple variables: feedstock type (corn silage, grass silage, woody biomass, green waste), compaction method (bunker silo, pile, bag), storage depth (density increases with depth), moisture content (higher moisture = higher density), and storage duration (settling increases density over time). Initial density curves are established from published agricultural engineering data and industry benchmarks, then refined through weighbridge reconciliation — comparing calculated volumes against actual inbound and outbound tonnage recorded by the facility's weighbridge system. After 3–6 monthly survey cycles, iFactory's platform develops facility-specific density curves that achieve tonnage accuracy within 2–3 percent for most feedstock types.
While the primary function of drone-based monitoring is volumetric measurement, the imagery captured during surveys can be analyzed for visual indicators of silage quality — surface discoloration indicating aerobic spoilage, visible mold growth, and surface water accumulation that accelerates degradation. iFactory's platform can integrate thermal imaging payload data (optional on compatible drone platforms) to detect temperature differentials across stockpile surfaces that indicate active heating or aerobic deterioration.
Most biogas facilities achieve full return on investment within 8–14 months of deploying a drone-based stockyard monitoring program. The primary ROI drivers are threefold: reduced feedstock procurement costs through accurate inventory data that eliminates over-contracting (typically 8–14 percent reduction in annual feedstock spend), reduced spoilage losses through proactive feedout scheduling that minimizes dry matter loss (typically 30–50 percent reduction in spoilage-related losses), and working capital release from optimized safety margin reduction. For a typical 2–3 MW facility carrying $300,000–$500,000 in stockyard inventory, the combination of procurement cost reduction and spoilage avoidance typically delivers $40,000–$80,000 in annual savings against a drone system investment of $3,000–$8,000 and platform subscription costs of $15,000–$30,000 per year. The payback period is accelerated for facilities managing high-value feedstocks with significant spoilage risk or operating with thin procurement margins.
Close the Biggest Data Gap in Your Biogas Operation. Know Every Ton in Your Stockyard.
iFactory's stockyard volumetric monitoring module delivers drone-based survey automation, density-adjusted tonnage conversion, and procurement planning integration — giving biogas operators 98%+ inventory accuracy without ground-based measurement labor. Purpose-built for facilities managing energy crop silage, solid feedstock stockpiles, and seasonal procurement cycles.