A single missing scrubber media batch can stop a combined heat and power engine for days. A backordered CHP injector with a 10-week lead time can idle a 1 MW biogas plant at a cost of $4,000 to $8,000 per day in lost renewable energy credits and electricity revenue. iFactory's AI platform closes this gap by combining criticality classification, lead-time intelligence, and predictive demand modeling into a single stockout prevention framework. Operations teams that Book a demo discover how data-driven safety stock calculations and automated reorder triggers eliminate the "hope inventory" that passes for stockout prevention in most biogas operations.
The Stockout Risk Profile of Biogas Operations
Biogas plants face a stockout risk profile that differs fundamentally from conventional manufacturing or power generation. The combination of proprietary CHP engine components, digester-specific parts with limited suppliers, gas treatment media with unpredictable degradation curves, and the financial penalty of unplanned downtime creates a risk environment where traditional inventory management approaches consistently underperform. A stockout of a CHP spark plug — a $45 part with a 6-week lead time — can cost more in lost revenue than the annual salary of the procurement manager who forgot to reorder it.
The operator on the opposite shift does not check. The stockout happens between shifts, not between budget cycles. Procurement managers who Book a demo see how iFactory automates this critical link between usage patterns, lead times, and automated reorder triggers.
- Reorder points set informally — based on "what we usually keep" not data-driven safety stock calculations
- Emergency procurement triggered after stockout occurs — 3-5x premium pricing and 2-4 day expedited shipping
- No differentiation between Vital, Essential, and Desirable spares — all parts treated with equal priority
- Lead time variability unmonitored — supplier delays discovered only when parts fail to arrive on schedule
- CHP engine downtime events accepted as unavoidable — no causal link between stockout frequency and availability
- Safety stock calculated per SKU using lead time variability, consumption volatility, and criticality weight
- Automated reorder triggers generated 2-3 weeks before stockout risk exceeds threshold — standard procurement pricing preserved
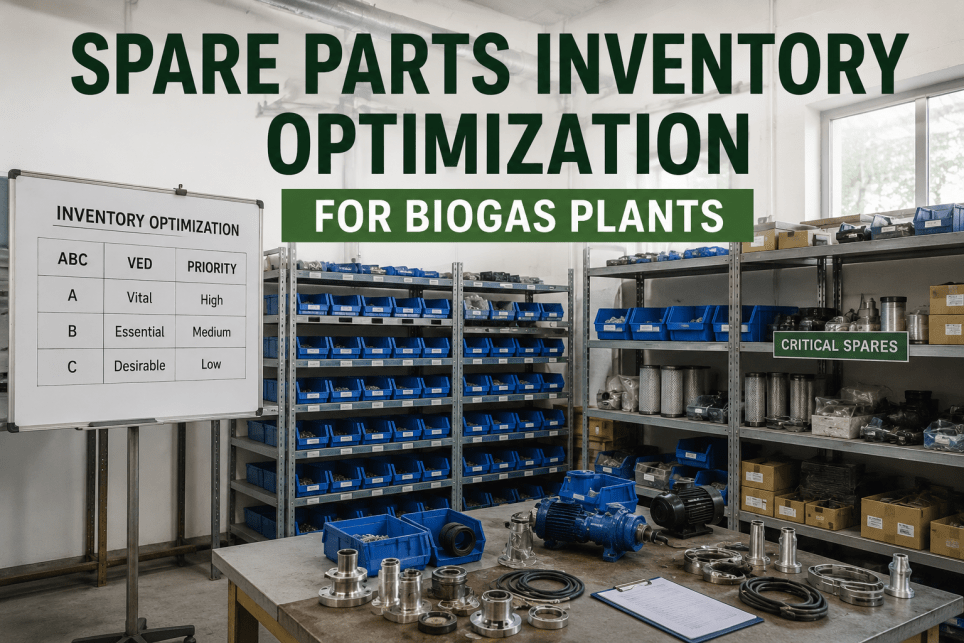
- ABC-VED classification segments 9 distinct stocking strategies — capital allocated where stockout consequence is highest
- Supplier lead time tracked and trended — proactive escalation when vendor performance degrades before parts are needed
- CHP availability linked to spare parts readiness score — stockout prevention quantified in uptime improvement targets
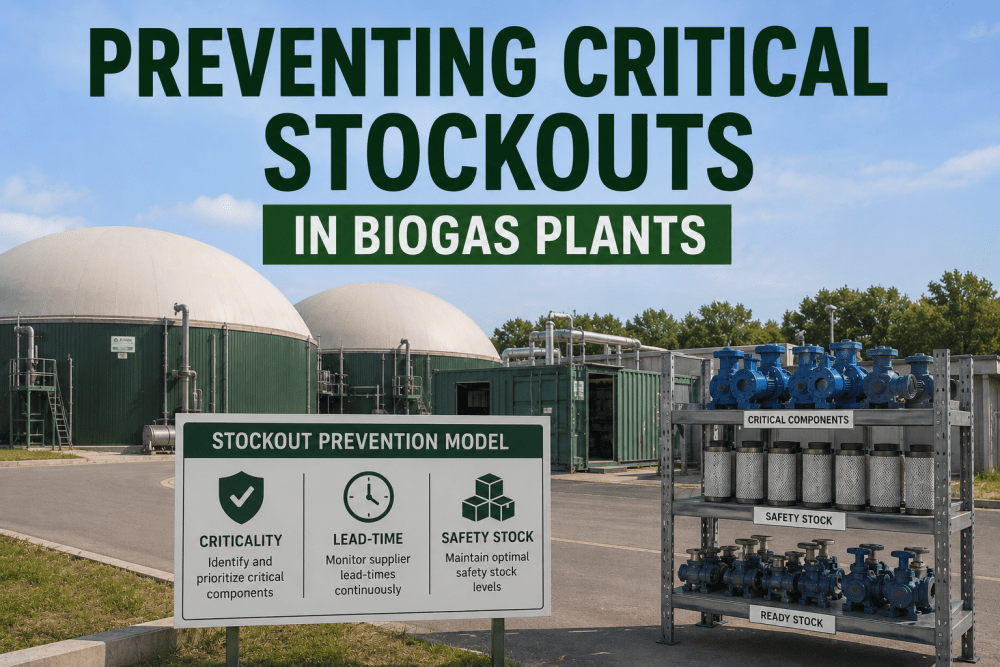
Criticality-Led-Time-Safety Stock Classification Framework
Effective stockout prevention requires a three-dimensional classification that goes beyond simple ABC analysis or VED criticality alone. This score directly drives the safety stock calculation — higher risk scores require deeper safety buffers and more frequent reorder point reviews. Engineering and procurement teams that Book a demo gain access to iFactory's stockout risk calculator, which quantifies the probability and financial impact of a stockout for every part in their inventory.
| Stockout Risk Category | Parts Criticality | Lead Time Risk | Safety Stock Target (Days) | Reorder Review Frequency | Example Biogas Parts |
|---|---|---|---|---|---|
| Critical-High | CHP engine stoppage / Safety hazard | > 6 weeks / Single supplier / High variability | 90–120 days | Weekly automated review | CHP injectors, cylinder heads, scrubber media |
| Critical-Medium | Production reduction > 50% | 4–6 weeks / Limited suppliers | 60–90 days | Bi-weekly automated review | Digester mixer seals, gas compressor valves |
| Essential-High | Production reduction > 20% | 3–5 weeks / Moderate variability | 45–60 days | Monthly review | Heat exchanger plates, pump impellers |
| Essential-Medium | Quality impact / Efficiency loss | 2–4 weeks / Multiple suppliers | 30–45 days | Monthly review | Drive belts, mechanical seals, sensors |
| Desirable-Low | Convenience / Minor cost impact | < 2 weeks / Commodity availability | 15–30 days | Quarterly review | Standard filters, fittings, consumable hardware |
Expert Perspective: What Changes When Stockout Prevention Becomes Systematic
We had accepted a certain level of CHP downtime as unavoidable maintenance risk. When we deployed iFactory and ran the stockout risk analysis for the first time, we discovered that 40 percent of our unplanned CHP stoppages were directly caused by parts stockouts — not mechanical failures. We simply did not have the right spare on hand when the failure occurred. In the twelve months since implementing the platform's safety stock framework and automated reorder system, we have not had a single stockout-related CHP outage. Our CHP availability improved from 91 percent to 96.5 percent, and our total inventory value actually decreased by 22 percent because we stopped carrying insurance stock on low-criticality parts and redirected that capital to the Vital spares that matter.
Key Performance Indicators for Stockout Prevention
Measuring stockout prevention effectiveness requires tracking a balanced set of leading and lagging indicators.Lagging indicators — like stockout frequency and emergency procurement premium — confirm whether the prevention framework is working. Maintenance and procurement leaders that Book a demo see how iFactory's MRO dashboard consolidates these metrics into a single stockout prevention scorecard.
Stockout Prevention Workflow: From Risk Assessment to Automated Reorder
Implementing a systematic stockout prevention program follows a structured progression that builds data integrity at each stage. iFactory's deployment approach ensures that each phase delivers measurable risk reduction while setting the foundation for the next level of automation. Operations leaders who Book a demo receive a deployment plan mapped to their specific asset portfolio and current inventory management maturity.
Frequently Asked Questions: Biogas Stockout Prevention
Safety stock is the quantity of a spare part held above expected consumption to protect against lead time variability and demand volatility. The reorder point is the stock level at which a new purchase order should be placed to ensure the part arrives before safety stock is depleted. In iFactory's framework, safety stock is calculated based on the part's criticality-lead time-volatility risk score, while the reorder point is safety stock plus expected consumption during the replenishment lead time. For Vital-critical parts with long lead times, the reorder point may be set as high as 90 days of consumption to ensure the part arrives well before stockout risk materializes.
iFactory's stockout prediction model combines three data streams in real time: current inventory level, forecasted consumption based on historical usage patterns and planned maintenance schedules, and supplier lead time performance with variability factors. The model calculates a stockout probability score for each SKU on a daily basis — expressed as a percentage likelihood of stockout within the next 30, 60, and 90 days. When any SKU's probability exceeds a configurable threshold (typically 15 percent for Vital parts, 25 percent for Essential parts), the platform generates an automated reorder alert that includes the recommended order quantity and required delivery date to avoid stockout.
The foundational data requirement is 12 months of parts consumption history from your CMMS or maintenance records — showing which parts were used, when, and on which assets. Additionally, current inventory levels for each SKU and supplier lead time data (or reasonable estimates) are needed to establish the baseline safety stock calculations. iFactory's platform integrates with leading CMMS systems and can also ingest data from spreadsheets for facilities without a formal CMMS.
Yes — and this is where iFactory's AI adds the most value over traditional min-max systems. CHP engine parts typically exhibit sporadic consumption driven by failure events rather than scheduled replacement, which makes standard forecasting methods unreliable. iFactory's machine learning model distinguishes between wear-driven consumption (predictable based on engine operating hours) and event-driven consumption (unpredictable but patternable based on historical failure modes). The model builds separate consumption forecasts for each pattern type and aggregates them into a composite stockout risk assessment that accounts for both the probability of wear-out and the probability of random failure during the lead time window.
Most biogas plants achieve full return on investment within 4 to 8 months of deploying iFactory's stockout prevention module. The primary ROI drivers are threefold: elimination of emergency procurement premiums (typically 3-5x standard pricing), reduction in CHP downtime costs from stockout-related stoppages, and working capital release from right-sizing safety stock levels. A typical 1 MW biogas plant carrying $250,000 in MRO inventory can expect to release $50,000–$70,000 in working capital while reducing stockout-related downtime costs by 60–80 percent. The combination of capital release and cost avoidance typically delivers payback within a single budget cycle.