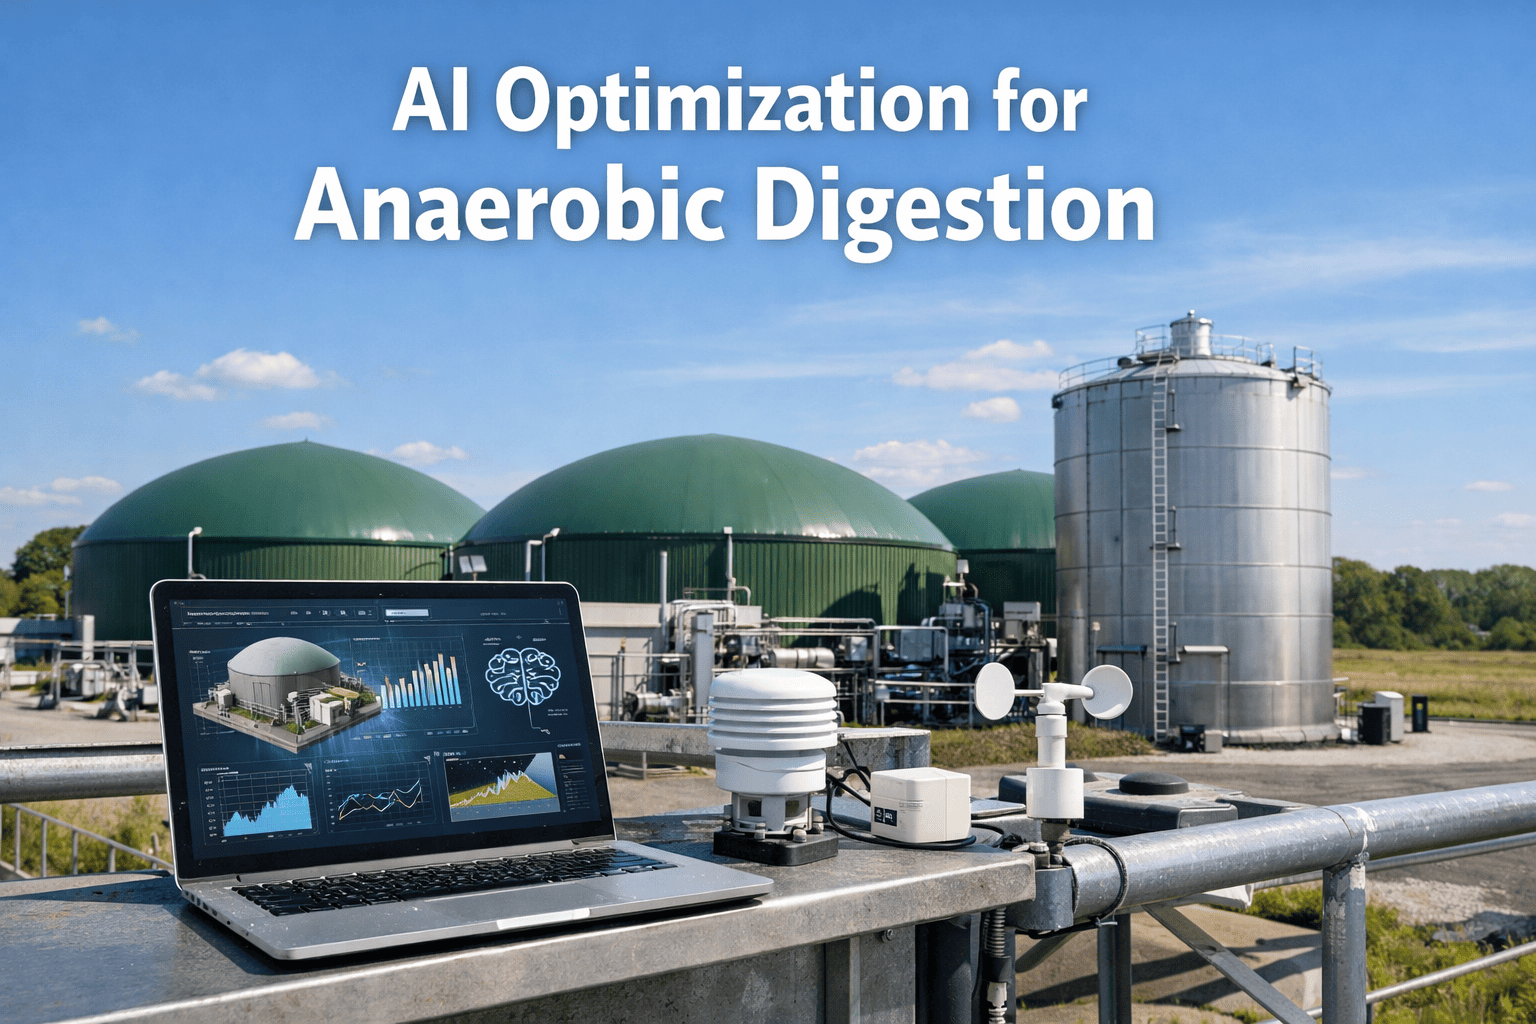
Before changing your biogas plant's feedstock mix, increasing the organic loading rate, or shifting from mesophilic to thermophilic operation, there is one question that separates a profitable optimization from an expensive experiment: what does the model predict will happen? iFactory's digital twin platform brings this simulation capability to biogas plant operations by building a physics-informed, data-calibrated model of each digester that can run thousands of scenarios per day. Operations teams that Book a demo
Why What-If Scenario Modelling Is the Missing Layer in Biogas Optimization
The fundamental challenge in biogas process optimization is the time constant of the system. Anaerobic digesters operate on hydraulic retention times of 15 to 60 days, depending on feedstock and temperature regime. When an operator adjusts the feedstock mix or changes the organic loading rate, the full effect of that change on gas yield, methane concentration, digester pH, and volatile fatty acid (VFA) levels will not be observable for at least one full retention time. In a 30-day HRT plant, that means five weeks between action and feedback. Five weeks of operating blind, hoping the change is beneficial, with no way to detect a developing process upset until the VFA-to-alkalinity ratio has already crossed the instability threshold.
- Operational changes tested directly on live digester — risk of process upset with every adjustment
- Feedback delayed by 15–60 days (one full HRT cycle) — slow optimization cycles
- Optimal feedstock blend determined by trial and error — costly suboptimal ratios persist for weeks
- Temperature shifts evaluated by annual seasonal adjustment, not real-time process response
- Co-substrate opportunities evaluated only when a new feedstock supplier approaches the plant
- Process upset detection reactive — VFA accumulation identified only after gas production declines
- All operational changes simulated first on digital twin — zero risk to live production
- Feedback in minutes — 50+ scenarios evaluated per operator shift, not per HRT cycle
- AI-recommended feedstock blend updated daily based on actual digester performance and feedstock availability
- Temperature setpoint optimized continuously against gas yield and heating energy cost curves
- Co-substrate screening automated — 100+ potential feedstock combinations tested per week
- Process upset prediction 48–72 hours ahead from VFA trend simulation — proactive intervention possible
6 Key Scenario Variables Every Biogas Operator Should Model
The number of potential scenarios in a biogas plant is combinatorially large — feedstock type and ratio, organic loading rate, temperature, retention time, mixing intensity, trace element supplementation, and more. The practical approach is to focus on the six variables that drive the majority of yield variability and process risk. iFactory's scenario engine allows operators to adjust any combination of these variables and see the predicted impact on gas yield, methane percentage, VFA profile, and process stability index within seconds. Plant managers who Book a demo receive a personalized model calibration using their plant's historical data.
Scenario Types: What Biogas Operators Simulate Most
The value of a scenario modelling platform is determined by the range of what-if questions it can answer. Different operational decisions require different modelling approaches, and the most useful platform supports multiple scenario types within a single modelling environment. The tabs below show the three most frequently run scenario categories across iFactory's biogas deployment base. Process engineers who Book a demo typically bring their plant's current operational data to the session and run live scenarios during the walkthrough.
Feedstock scenario modelling answers the most common operational question in biogas: what happens to my gas yield if I change the feedstock blend? iFactory's feedstock scenario engine incorporates the specific methane potential (SMP) of each substrate, the degradation kinetics (fast vs slow fractions), and the interaction effects between co-substrates — because the methane yield of a blend is not always the weighted average of its components.
OLR and temperature are the two most operationally sensitive variables in anaerobic digestion — small changes in either can produce outsized impacts on gas yield or trigger process instability. iFactory's loading and temperature scenario module models the combined effect of OLR and temperature changes on the microbial community's specific growth rate, substrate utilization efficiency, and VFA production-consumption balance.
Hydraulic retention time and solids retention time are the design parameters that determine a digester's volumetric gas production rate and its destruction efficiency. Reducing HRT increases throughput — more feedstock processed per day — but reduces the time available for microbial degradation, lowering the destruction efficiency and potentially reducing gas yield per unit of volatile solids fed.
The Simulation Workflow: From Scenario Design to Operational Decision
Running what-if scenarios is not an end in itself — the value is realized when simulation results are translated into operational decisions with confidence. iFactory's scenario platform follows a structured workflow that moves from parameter definition to ranked recommendations in a continuous cycle, enabling operators to test, refine, and implement changes at a pace that was previously impossible in biogas operations.Book a demo
How Scenario Modelling Improves Key Biogas Performance Metrics
The impact of what-if scenario modelling is measurable across the full set of biogas plant performance indicators. When operators can test changes before implementing them, they make better decisions more frequently — and the compounding effect of those better decisions is visible in the plant's core metrics within a single quarter.
| Performance Metric | Traditional Operation | With Scenario Modelling | Improvement Range | Primary Driver |
|---|---|---|---|---|
| Methane Yield | 9,500–10,500 m³/day | 11,200–12,800 m³/day | +18–22% | Optimized feedstock blend |
| Specific Gas Production | 0.38–0.45 m³/kg VS | 0.48–0.56 m³/kg VS | +15–26% | OLR and HRT optimization |
| Process Upset Events | 3–5 per year | 0–1 per year | –80% | Pre-shift VFA prediction |
| Feedstock Cost | $28–$35/ton | $22–$27/ton | –18% | Least-cost blend optimization |
| CHP Runtime Efficiency | 7,800–8,200 hrs/yr | 8,400–8,700 hrs/yr | +6–8% | Stable gas quality from stable process |
| Revenue per MMBtu | 85–92% of potential | 96–99% of potential | +8–12% | Optimal dispatch + credit stacking |
Expert Perspective: What Digital Twin Modelling Changes in Biogas Operations
Before iFactory, every feedstock blend change we made was a leap of faith. We'd calculate the theoretical C:N ratio, check the published methane potential values, and then just commit to the new blend and wait 25 days to see what happened. If the yield dropped, we had burned through five weeks of production at suboptimal performance before we even knew we had a problem. We made maybe four or five blend adjustments per year because the feedback cycle was so punishing. In the first three months with iFactory's scenario modelling, we tested 40 different blend ratios, identified three that outperformed our existing mix by 15% or more, and implemented the best one with full confidence because the model predicted a yield increase of 22% and the actual increase was 19%. The discrepancy between prediction and actual was within the model's stated accuracy range — and we had captured that improvement in days rather than months Book a demo .
Frequently Asked Questions: Biogas What-If Scenario Modelling
iFactory requires a minimum of 90 days of historical operational data to calibrate a physics-informed digital twin — including daily feedstock volumes and composition, gas production and methane concentration, digester temperature and pH, and organic loading rate. The more historical data available, the more accurate the model becomes, but 90 days is sufficient to achieve prediction accuracy within ±8% on gas yield. For plants with less than 90 days of data, iFactory provides a pre-calibrated model using industry-standard degradation kinetics that can be refined as data accumulates. A data readiness assessment is available at no cost to determine your current data adequacy.
iFactory's digital twin achieves a gas yield prediction accuracy of ±6–8% for established digesters with at least six months of calibration data. The model's accuracy is highest for feedstock blend scenarios (+6%) and slightly wider for temperature and HRT scenarios (+8%) due to the additional biological variables involved. The model is self-correcting: each time a scenario is implemented in the live process, the actual vs predicted performance comparison is used to refine the model parameters, so prediction accuracy improves over time as more operational data is collected.Book a demo
Yes — multi-feedstock co-digestion modelling is the most frequently used capability in iFactory's scenario platform. The model incorporates the specific methane potential (SMP) and degradation kinetics of each individual feedstock, as well as the documented interaction effects between co-substrates — because the methane yield of a blend is often higher or lower than the weighted average of its components due to synergistic or antagonistic effects on the microbial community. Operators can define up to six feedstocks in a single scenario, adjust each ratio from 0% to 100%, and receive the predicted yield, VFA impact, and C:N ratio for every blend combination tested.
Process stability prediction is integrated directly into every scenario run. iFactory's model tracks the VFA production-consumption balance, alkalinity buffering capacity, and pH trajectory for each simulated scenario — producing a process stability index (0–100) alongside the gas yield prediction. Scenarios that predict yield improvements but show a stability index below 70 are flagged as high-risk, preventing operators from pursuing yield gains that could trigger a process upset. The stability prediction window extends 72 hours beyond the scenario execution date, giving operators advanced warning before VFA levels cross the alarm threshold.
iFactory's scenario modelling deployments typically reach full cost recovery within 4 to 8 months, driven by three primary value streams: increased methane yield from optimized feedstock blending (typically +15–22%), reduced process upset events (80% reduction), and lower feedstock costs through least-cost blend optimization (10–18% reduction). For a 1 MW biogas plant processing 25,000 tons of feedstock annually, a 15% yield improvement at typical RNG pricing represents $180,000–$280,000 in additional annual revenue. Book a demo to receive a personalized ROI projection using your plant's specific production data.
Conclusion: Stop Operating Blind. Start Simulating with Confidence.
The biogas plants that achieve the highest methane yields, the lowest operating costs, and the fewest process upsets are not necessarily the ones with the newest digesters or the most advanced feedstock preprocessing equipment. They are the ones with the clearest understanding of how their process will respond to change before that change is made — and that understanding comes from systematic what-if scenario modelling, not from intuition or published literature values.