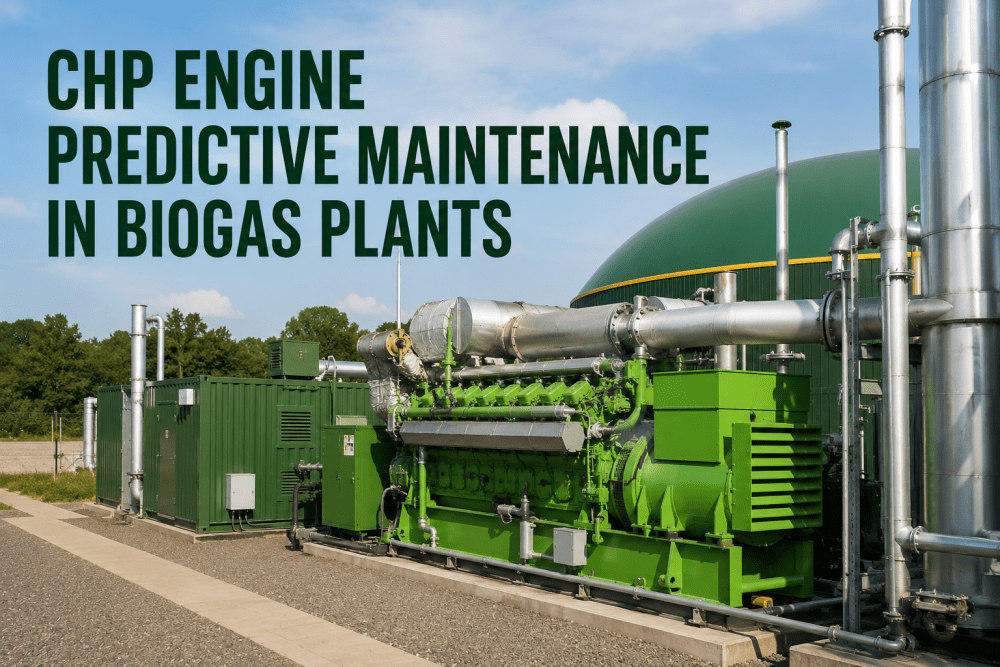
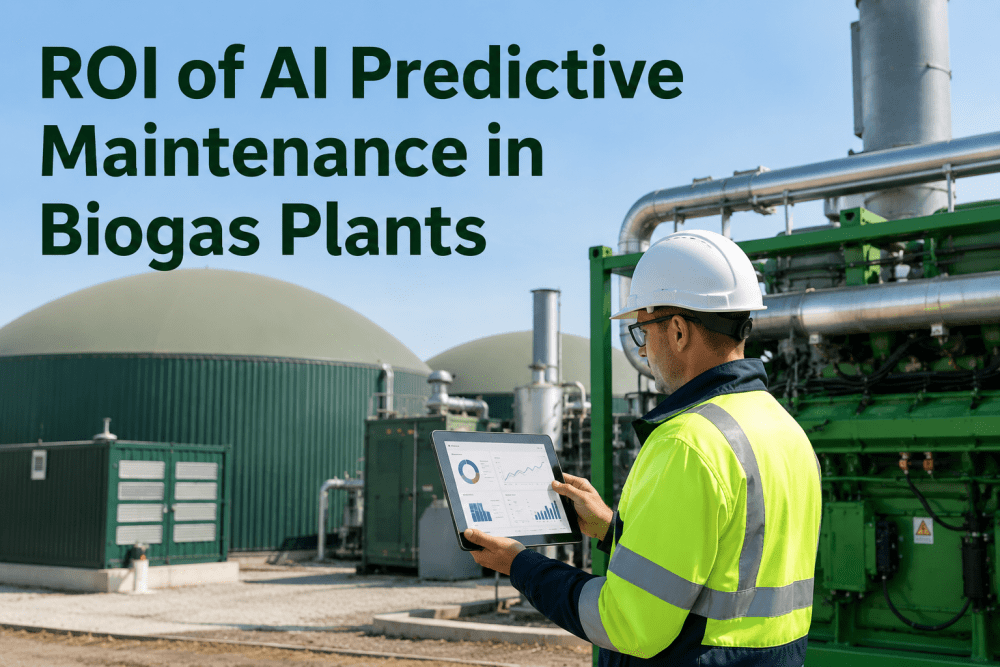
A plant engineer at a 3.2 MW biogas CHP facility in Bavaria started every Monday the same way — manually pulling engine performance data from the PLC historian, cross-referencing oil analysis results emailed from the lab on Friday, and building a trend report in a spreadsheet that was already outdated by the time he emailed it to the plant manager. When the first signs of cylinder imbalance appeared on Engine 2 — a 12°C exhaust temperature deviation on cylinder — it took his team eight days to confirm the trend. By then, the pre-chamber had sustained thermal damage requiring a $38,000 top-end overhaul that a real-time CHP predictive analytics platform would have flagged two weeks earlier.
iFactory CHP Engine Intelligence
CHP Engine Predictive Maintenance for Biogas Plants
The predictive analytics platform that turns cylinder-level sensor data, vibration signatures, and oil analysis trends into a single live view your entire maintenance team can act on — before combustion drift becomes catastrophic failure
87+
Sensor points monitored per CHP engine
47 days
Average failure foresight window
82%
Reduction in unplanned CHP downtime
$38K
Average cost of a top-end overhaul event
Why CHP Maintenance Teams Are Flying Blind
The average biogas CHP engine generates more performance data in a single combustion cycle than most maintenance teams can analyse in a week. The problem is not data scarcity — it is data fragmentation. When cylinder exhaust temperatures live in the OEM's proprietary portal, vibration data sits in a separate handheld collector, oil analysis results arrive as PDFs from the lab, and operational logs are handwritten in a notebook, no single person has a complete picture of engine health at any given moment. Cylinder imbalance, turbocharger degradation, and oil contamination all leave detectable signatures in sensor data weeks before they cause a shutdown — but only if someone is looking at all the signals together.
Cylinder Monitoring
Exhaust temperature per cylinder, combustion pressure, knock detection, ignition timing deviation
Vibration Analysis
Bearing vibration, turbocharger speed, shaft alignment, casing acceleration, frequency spectra
Oil Condition
Oil viscosity, TAN/TBN, wear metals, oxidation, nitration, glycol contamination, soot content
Performance Metrics
Electrical efficiency, heat recovery rate, fuel consumption, lambda, boost pressure, intake air temp
Cooling & Lube
Jacket water temp, oil temperature, oil pressure, coolant pressure, thermostat cycling, pump flow
Operating Context
Runtime hours, starts/stops, load profile, fuel gas quality, ambient temperature, maintenance history
Anatomy of a CHP Predictive Maintenance Platform
A CHP predictive maintenance platform is not just a dashboard — it is the operational nerve centre of your engine reliability program. It unifies every engine data stream into a single, role-specific, real-time interface that transforms raw sensor signals into maintenance decisions. Here are the seven layers that make it work.
01
Cylinder-Level Combustion Monitoring
Live exhaust temperature per cylinder with deviation tracking. When any cylinder drifts more than 5% from the bank average, the platform flags cylinder imbalance — the earliest detectable signature of injector fouling, pre-chamber degradation, or valve seat wear. Knock detection and ignition timing deviation alerts catch combustion anomalies before they cause mechanical damage.
02
Vibration Signature Analysis
Continuous tri-axial vibration monitoring on main bearings, turbocharger, and generator ends. AI pattern recognition identifies developing bearing fatigue, gear mesh wear, and shaft misalignment 30–60 days before threshold-based alarms would trigger. Frequency spectrum analysis isolates specific failure modes — inner race defects, outer race spalling, cage degradation.
03
Oil Health and Wear Debris Trending
Integration with oil analysis lab results and real-time oil condition sensors. The platform tracks TAN/TBN (acid-neutralising capacity), wear metals (iron, copper, lead, tin), oxidation/nitration levels, and the all-critical glycol contamination that signals a coolant leak. Trend acceleration alerts identify when oil degradation rate shifts from normal wear to impending failure.
04
Thermal and Efficiency Performance
Real-time tracking of electrical efficiency, thermal recovery rate, and specific fuel consumption against baseline. A 2% efficiency drop that persists for 48 hours triggers an investigation — not a maintenance action at the next scheduled service. The platform correlates efficiency drift with combustion parameters to isolate the root cause.
05
Turbocharger and Air Handling Health
Turbocharger speed, boost pressure, intake air temperature, and charge air cooler performance monitored for compressor wheel fouling, bearing degradation, and intercooler fouling. A gradual boost pressure decline combined with increased turbo speed signals compressor fouling that needs cleaning before efficiency loss accelerates.
06
Cooling and Lube System Integrity
Jacket water temperature stability, thermostat cycling frequency, coolant pressure trends, oil temperature and pressure. The platform detects deteriorating heat exchanger performance, failing thermostat elements, and developing pump impeller wear before they cause overheating events that trip the engine offline.
07
Maintenance Forecast and Spare Parts Optimization
AI-generated maintenance forecasts with 180-day horizon showing predicted remaining useful life for every critical component. The platform cross-references forecasted failures against spare parts inventory and lead times, generating automated procurement recommendations so the right part arrives before the planned maintenance window — never after a failure.
Want to see these seven layers working together on a live biogas CHP engine? Book a personalised demo.
The CHP Engine KPIs That Matter Most
A predictive maintenance platform is only as valuable as the metrics it tracks. These are the twelve KPIs that leading biogas plant operators monitor in real time — and the benchmarks that separate best-in-class CHP reliability from average.
Role-Based Views — One Platform, Every Perspective
A CHP predictive maintenance platform that shows the same screen to everyone serves no one well. The power of a unified system is that it provides role-specific views — giving each person exactly the information they need to make decisions at their level, without noise.
Sees: CHP availability across all engines, efficiency trends, maintenance cost per MWh, unplanned downtime trajectory, forecasted overhaul timing, month-over-month reliability improvement velocity
Decides: Overhaul timing decisions, capital allocation for engine rebuilds, staffing priorities, RNG revenue protection strategies
Sees: Cylinder-level temperature deviation alerts, vibration trend acceleration, oil analysis wear metal trends, predicted remaining useful life per component, open work orders and pending inspections
Decides: Intervention priority, root cause investigation assignments, service scope planning, spare parts requisition timing
Sees: Live engine status dashboard, active alerts requiring immediate attention, inspection checklist for current shift, critical parameter trends for the last 24 hours, pass/fail status of daily engine checks
Decides: Immediate engine load adjustments, coolant/oil top-up actions, minor parameter corrections, escalation of abnormal readings to engineering team
Sees: Cross-engine failure mode patterns, MTBF trends by component type, predictive model accuracy scores, historical vibration and oil data archives, root cause analysis repository
Decides: OEM specification changes, preventive interval adjustments, training requirements for technicians, design modifications for chronic failure modes
From Sensor Reading to Maintenance Decision — How Fast?
The value of a CHP predictive maintenance platform is measured in the gap between a developing fault and someone knowing about it. Here is how response times compare between traditional calendar-based maintenance and an AI-powered predictive platform.
Cylinder imbalance detected
4-8 hours (next manual log review)
Bearing degradation identified
1-3 weeks (vibration survey cycle)
Continuous spectrum analysis
Root cause isolated
5-14 days (cross-system analysis)
Correlated data in minutes
Maintenance work order created
1-3 days (manual workflow)
Auto-triggered at prediction
Overhaul report compiled
3-7 days (manual data gathering)
One-click automated report
Calendar-Based / Manual
AI Predictive Platform
Ready to close the gap between sensor reading and maintenance action? Book a demo.
Frequently Asked Questions
What CHP engine OEMs and models does the platform support?
iFactory's platform is OEM-agnostic and supports all major biogas CHP engine manufacturers including INNIO Jenbacher, MWM (Caterpillar Energy Solutions), Rolls-Royce MTU, 2G Energy, GE Jenbacher, MAN Energy Solutions, Guascor, and Waukesha. The platform connects via the engine's standard data interface (Modbus, CAN bus, OPC-UA, or proprietary Gateway) and maps the OEM-specific data points into a unified engine health model. For older engines without digital interfaces, iFactory deploys retrofittable sensor kits that add full cylinder-level monitoring capability without requiring OEM controller modifications.
What specific failure modes can the platform predict on a biogas CHP engine?
The platform's AI models are trained to detect and predict over 25 distinct failure modes on biogas CHP engines, including: cylinder exhaust temperature deviation (pre-chamber fouling, injector degradation, valve seat wear), main bearing fatigue, connecting rod bearing failure, turbocharger compressor wheel fouling, turbocharger bearing degradation, spark plug fouling and pre-ignition, piston ring wear and blow-by, oil cooler fouling, thermostat failure, coolant pump impeller wear, liner scuffing, crankshaft torsional vibration, generator bearing degradation, and charge air cooler fouling. Model detection accuracy improves continuously as the platform accumulates more operating hours and failure event data.
What sensors are required and how much does the hardware cost?
Most biogas CHP engines already have the primary sensors required — cylinder exhaust thermocouples, vibration transducers on main bearings, oil temperature/pressure sensors, and engine speed/load signals — connected to the OEM controller. iFactory ingests these existing signals through the engine's data interface. Additional sensors recommended for maximum predictive coverage include: tri-axial accelerometers on each main bearing (typically $600-$1,200 per sensor), turbocharger speed sensor, and oil condition sensor (dielectric constant, viscosity). Total additional sensor hardware cost typically ranges from $8,000-$25,000 per engine depending on existing instrumentation and desired coverage depth. The platform also ingests off-line data sources like oil analysis lab results and borescope inspection images.
How long before the AI models can make accurate failure predictions?
The platform begins generating actionable alerts within 2-4 weeks of live data collection as statistical baselines are established for each sensor channel. Initial model accuracy reaches approximately 70-80% within 60 days, based on historical failure pattern recognition from the broader iFactory CHP fleet (1,200+ engines monitored globally). Accuracy improves to 90-95% after 6-12 months as the models learn the specific operational characteristics, fuel gas quality variations, and load profile patterns unique to your engines.
Can the platform integrate with our existing CMMS for automated work order creation?
Yes. iFactory features bidirectional integration with all major CMMS and EAM platforms including SAP, Oracle EAM, IBM Maximo, Maintenance Connection, Fiix, UpKeep, and ManagerPlus. When the platform detects a developing failure mode at a confidence level above the configured threshold, it automatically generates a work order in your CMMS with the predicted failure mode, affected component, recommended repair procedure, required parts and tools, estimated labor hours, and recommended intervention window. The integration closes the loop between predictive analytics and maintenance execution without any manual data entry.
What is the typical ROI for CHP predictive maintenance?
iFactory customers typically achieve a full return on investment within 6-10 months through three primary value streams: (1) Eliminated unplanned downtime — avoiding 6-12 engine trips per year at $15K-$50K per event in lost RNG revenue and repair costs; (2) Extended overhaul intervals — optimized top-end and major overhaul timing based on actual component condition rather than fixed hours, adding 3,000-6,000 operating hours between major services; (3) Improved efficiency — recovering 1-3% efficiency loss from combustion drift and air handling degradation, which alone can represent $25,000-$60,000 per year in additional RNG revenue on a 1 MW engine. A detailed plant-specific ROI model is provided during the
live demo session.
Predict Before Failure. Protect Your Revenue.
Your CHP Engine Data Already Exists. The Insights Do Not. Fix That Today.
iFactory's CHP predictive maintenance platform unifies every cylinder temperature, vibration signature, oil analysis trend, and performance metric into a single real-time engine health dashboard. From shift technician to plant manager, everyone sees the truth — and acts on it before combustion drift becomes a $40,000 top-end overhaul.
Real-Time
Cylinder-level monitoring across all engines
12 KPIs
Tracked continuously per engine
47 Days
Average failure foresight window
2-4wk
To first predictive alerts