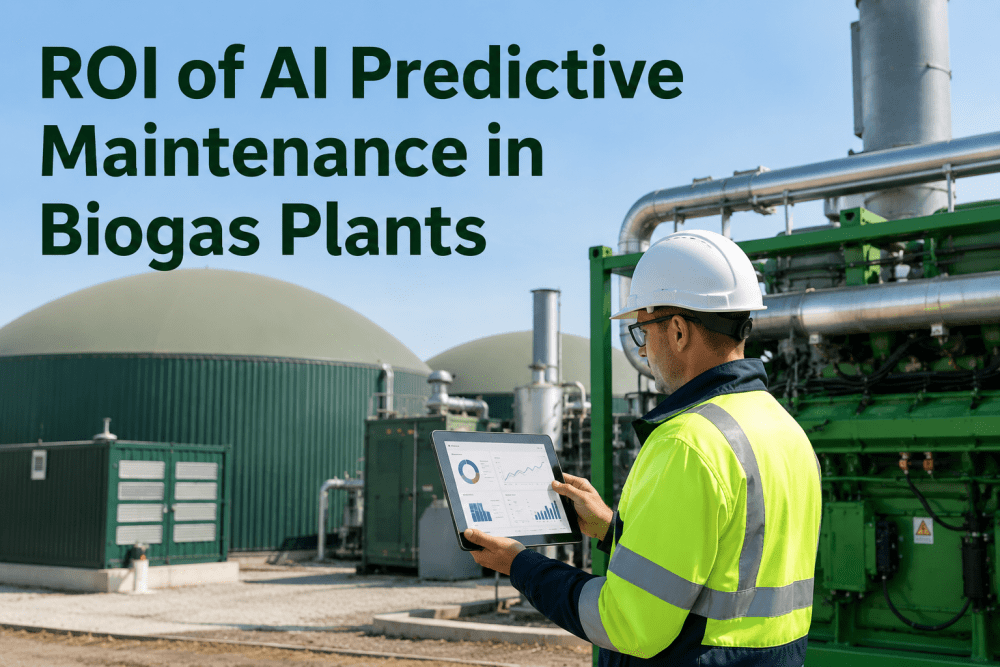
Maintenance represents approximately one-third of total operating expenditure at a typical North American biogas facility — yet most AD plants still manage maintenance activities through fixed-interval schedules, calendar-based overhauls, and reactive repairs that treat every asset the same regardless of its actual condition. AI-driven predictive maintenance changes this economic equation fundamentally by shifting the maintenance decision from time-based to condition-based, from reactive to predictive, and from uniform treatment of all assets to asset-specific reliability strategies tuned to each component's actual degradation trajectory. Book a Demo to see how iFactory's AI predictive maintenance platform delivers measurable ROI at operating biogas facilities within the first quarter of deployment.
33%
Maintenance cost as share of total biogas plant OPEX — the largest controllable cost category in AD operations
$380K
Average annual savings from prevented CHP forced outages and optimized overhaul timing at operating AD facilities
6–9 mo
Typical payback period for AI predictive maintenance platform deployment at biogas plants of 1–5 MW capacity
42%
Reduction in unplanned downtime achieved across monitored biogas assets using AI-driven PdM programs
Ready to calculate the specific ROI of AI predictive maintenance for your biogas facility? Book a demo of iFactory's biogas PdM platform and receive a facility-specific ROI assessment within one week.
The Maintenance Cost Burden at Biogas Plants
Biogas plants operate under a maintenance cost structure that is fundamentally different from conventional power generation. The feedstock quality variability that defines AD operations creates accelerated and unpredictable degradation patterns across every major asset class — CHP engines ingesting biogas with fluctuating H₂S and siloxane concentrations, digesters experiencing biological stress events that manifest as mechanical loading changes, and gas handling equipment cycling through moisture and contaminant loads that vary with every substrate blend change. These conditions make time-based maintenance schedules inherently suboptimal, producing both over-maintenance (servicing assets that still have useful remaining life) and under-maintenance (missing degradation signals that lead to preventable failures).
CHP Engine Overhaul Costs
Major CHP engine overhauls at 30,000–40,000 hours run $150,000–$400,000 per event depending on engine size and scope. Facilities running time-based overhaul schedules typically replace components with 15–25 percent useful life remaining, wasting $30,000–$80,000 per overhaul cycle in premature replacement cost.
Digester Process Upset Recovery
A single digester process upset — triggered by undetected feedstock quality variation, temperature excursion, or mixing system degradation — costs $50,000–$120,000 in lost gas production during the 3–7 day recovery period, plus the labor cost of accelerated testing, manual process adjustments, and potential restabilization additives.
Gas Handling Equipment Failures
Gas booster compressors, H₂S scrubbers, and siloxane removal vessels fail with limited warning when degradation is invisible in daily operational data. A gas compressor failure at a 2 MW facility costs $40,000–$90,000 in lost generation revenue during the 5–14 day repair window, plus $25,000–$55,000 in emergency repair premiums and expedited parts.
Unplanned Downtime Revenue Loss
Each unplanned downtime event at a 3 MW biogas facility operating at $0.08/kWh PPA pricing costs $5,760 per day in lost generation revenue. A typical forced outage duration of 8–14 days results in $46,000–$80,000 in direct revenue loss before repair costs, premium labor, or penalty clauses are included.
Emergency Repair Premiums
Emergency maintenance events at biogas plants carry 40–80 percent cost premiums over planned maintenance — overtime labor at 1.5–2x standard rates, expedited shipping for replacement parts, and contractor call-out fees that add $8,000–$25,000 per event beyond the base repair cost. AI PdM converts emergency events to planned interventions, eliminating these premiums entirely.
Extended Asset Lifecycle Costs
Assets operated beyond their optimal replacement window without condition-based monitoring accumulate accelerated degradation that reduces remaining useful life by 20–35 percent. A CHP engine retired 5,000 hours early due to undetected bearing degradation represents $200,000–$500,000 in premature capital replacement cost across a 5 MW biogas facility.
Predictive Maintenance Cost Comparison: Reactive vs Preventive vs AI-Driven
The economic advantage of AI-driven predictive maintenance over traditional approaches is not incremental — it represents a fundamental change in the relationship between maintenance spending and asset reliability. The following comparison table maps the cost, downtime, and asset life outcomes across the four maintenance approaches commonly used at North American AD facilities, based on operating data from biogas plants ranging from 1 MW to 10 MW capacity.
Maintenance Approach
Annual Cost per MW
Unplanned Downtime
Asset Life Extension
Maintenance Labor Efficiency
ROI Timeline
Reactive (Run-to-Failure)
$65,000–$95,000
12–18% of operating hours
None — assets operated until failure, often with secondary damage
30–40% — majority of labor spent on emergency response
Negative — highest total cost of ownership
Preventive (Time-Based)
$45,000–$70,000
6–10% of operating hours
5–15% — regular servicing extends life but over-maintenance limits gains
55–65% — scheduled work improves planning but fixed intervals waste capacity
3–5 years — over-maintenance costs offset reliability gains
Condition-Based Monitoring
$35,000–$55,000
4–7% of operating hours
15–25% — manual data review catches degradation before failure
80–90% — AI prioritizes work orders, team focuses on execution
6–9 months — avoided failure costs exceed platform cost in first quarter
Compare the projected ROI of AI predictive maintenance against your current maintenance spend. Book a demo for a facility-specific cost analysis and payback projection.
Building the ROI Business Case for AI Predictive Maintenance
A credible ROI business case for AI predictive maintenance at a biogas plant is built on four categories of measurable financial impact: avoided failure costs, optimized maintenance spend, production revenue protection, and asset lifecycle extension. Each category produces independently verifiable savings that compound when the platform covers multiple asset classes. The following framework maps the specific calculations and data requirements that maintenance and financial teams should use when building their PdM investment case.
ROI Business Case Framework for Biogas AI Predictive Maintenance
Avoided CHP Forced Outage Cost: Document the last 2–3 CHP engine forced outages at your facility — including repair cost, lost generation revenue, and PPA penalty exposure. AI PdM provides 3–14 day advance warning of degradation patterns that precede these failures.
Planned vs Emergency Maintenance Ratio: Calculate current ratio of planned to emergency maintenance spend. Facilities using AI PdM shift from 40:60 to 85:15 planned-to-emergency ratio, saving 40–80 percent in emergency cost premiums.
Overhaul Optimization Savings: Review CHP engine overhaul history — most facilities replace components with 15–25 percent useful life remaining under time-based schedules. AI condition monitoring extends overhaul intervals by 2,000–6,000 hours without increasing failure risk.
Digester Stability Improvement: Document process upset events over the past 12 months — causes, duration, and production impact. AI models trained on digester sensor data detect leading indicators of instability 12–48 hours before conventional alarms.
Labor Productivity Gain: Estimate engineering hours currently spent on manual data review, report generation, and reactive troubleshooting. AI PdM automates 60–70 percent of data analysis work, freeing reliability engineers for value-added intervention planning.
PPA Penalty Avoidance: Review power purchase agreement terms for availability guarantees, forced outage allowances, and penalty structures. Each PPA penalty event at a 3 MW facility typically costs $12,000–$35,000 in reduced revenue and contract compliance deductions.
Spare Parts Inventory Optimization: Calculate current inventory carrying cost for critical spares — CHP engine components, gas compressor parts, instrumentation. AI PdM provides 14–30 day advance failure prediction, enabling just-in-time parts procurement and 20–35 percent inventory cost reduction.
Asset Lifecycle Extension Value: Calculate annualized capital replacement cost for major assets. Extending CHP engine replacement from 60,000 to 75,000 operating hours reduces annualized capital cost by 20 percent — equivalent to $40,000–$80,000 per year for a 3 MW facility.
6–9 mo
Average AI predictive maintenance platform payback period across operating biogas facilities of 1–10 MW
$3.20
Average ROI per dollar invested in AI predictive maintenance — measured across all monitored asset classes at deployment facilities
85:15
Planned-to-emergency maintenance ratio achieved by facilities using AI PdM, versus 40:60 average at time-based facilities
How Predictive Maintenance Deployment Delivers Returns
AI-driven predictive maintenance does not deliver ROI through a single capability or model — it delivers through a systematic deployment process that progressively unlocks savings as each asset class comes under AI monitoring and each maintenance workflow is converted from time-based to condition-based execution. The following deployment sequence maps the typical 10–14 week implementation that produces measurable financial returns from week six onward at operating biogas facilities.
01
Data Integration and Asset Hierarchy Definition (Weeks 1–2)
iFactory's deployment team connects to the facility's existing SCADA historian, CMMS database, and sensor networks — typically pulling 12–24 months of historical operational data. The asset hierarchy is defined in the platform, mapping each monitored component to its sensor streams, maintenance history, and failure mode profile. No new sensors or infrastructure are required for standard deployment.
02
Model Training and Baseline Establishment (Weeks 3–4)
AI models are trained on historical data to learn the normal operating envelope of each asset — temperature profiles, vibration signatures, pressure trends, electrical characteristics. The models establish baseline degradation patterns for each failure mode identified in the asset hierarchy. Model training runs in parallel with ongoing operations and requires no plant downtime.
03
Real-Time Monitoring and Alert Activation (Weeks 4–5)
Live monitoring begins with AI models generating real-time asset health scores and degradation trend lines. The platform delivers its first set of actionable alerts — typically identifying 3–8 assets with active degradation patterns that were invisible in the data before model deployment. Maintenance teams receive prioritized work order recommendations with specific degradation descriptions and recommended intervention timing.
04
First Intervention Cycle and Value Capture (Weeks 6–8)
The first round of AI-identified interventions is executed — condition-based maintenance actions that replace time-based or reactive responses. A facility typically captures $25,000–$80,000 in avoided failure costs and optimized maintenance spend in this first cycle, which often exceeds the total platform implementation cost. The avoided failure events and cost savings are documented for the ROI tracking dashboard.
05
Model Refinement and Asset Expansion (Weeks 8–10)
Models are refined based on intervention outcomes — learning which degradation signatures preceded actual failures versus false positives. Additional asset classes are brought under monitoring following the same deployment sequence. The platform's predictive accuracy improves with each intervention cycle as the models learn facility-specific degradation patterns that generic models cannot capture.
06
Continuous ROI Tracking and Program Optimization (Ongoing)
The platform continuously tracks and reports ROI across all asset classes — avoided failure costs, maintenance spend reduction, production revenue protected, and asset life extension value. Monthly ROI reports are automatically generated for facility management and financial stakeholders. The models continuously learn from new data, improving prediction accuracy and intervention timing recommendations with each operating month.
Proven AI Predictive Maintenance ROI for Biogas Plants — Deployed in 10 Weeks
iFactory's AI predictive maintenance platform delivers measurable financial returns from week six of deployment — combining SCADA data integration, automated degradation detection, and prioritized work order generation into a single system purpose-built for biogas CHP engines, digesters, and gas handling assets.
What Maintenance Teams Should Demand From an AI PdM Vendor
The AI predictive maintenance market has expanded rapidly, and not all platforms claiming AI-driven capability deliver the specific outcomes that generate biogas plant ROI. Generic industrial AI platforms trained on manufacturing or refining data do not transfer effectively to AD operations — the failure modes, operating patterns, and data characteristics of biogas assets are fundamentally different. Maintenance teams evaluating PdM platforms should use the following evaluation criteria to distinguish platforms that will deliver measurable biogas plant ROI from those that will require months of customization before producing actionable results.
Biogas AI Predictive Maintenance Platform Evaluation Checklist
Does the platform have pre-trained models for biogas-specific assets — CHP engines on digester gas, AD process parameters, H₂S scrubbers, gas booster compressors — or does it require custom model training from scratch for each deployment?
How quickly does the platform produce actionable alerts after data integration — measured in weeks, not months? Platforms requiring 3–6 months of model training before producing alerts do not capture the early failure avoidance value that drives ROI.
Does the platform integrate directly with the facility's existing SCADA historian and CMMS — without requiring new sensor deployment, additional data infrastructure, or replacement of the existing maintenance management system?
Can the platform provide documented ROI outcomes from operating biogas facilities — not general industrial case studies, but specific CHP engine, digester, and gas handling ROI data from AD plants with comparable capacity and feedstock profiles?
Does the platform offer a quantifiable ROI guarantee or payback commitment — specifying the expected savings per asset class and the timeline for achieving positive return on the platform investment?
How does the platform handle model retraining and continuous improvement — are models updated automatically with new operating data, or does retraining require vendor intervention and additional service fees?
What is the total cost of deployment including platform subscription, data integration services, model training, and ongoing support — and how does the annual cost compare to a single prevented CHP forced outage event at your facility?
Does the vendor provide a facility-specific ROI projection as part of the evaluation process — using your facility's actual historical maintenance data, asset configuration, and operating parameters — before requiring any purchase commitment?
10 Wks
Full Deployment Timeline
From SCADA data integration to live AI monitoring across all asset classes at facility scale
No Sensors
Required
Platform works with existing SCADA, CMMS, and sensor data — no new field instrumentation needed
3+ Yrs
CHP Life Extension
Average asset life extension achieved through condition-based overhaul timing and degradation detection
100%
CMMS Integration
Platform auto-creates work orders in existing CMMS — no workflow disruption for maintenance teams
See what AI predictive maintenance ROI looks like for your specific facility configuration. Book a demo and receive a detailed ROI projection based on your facility's historical maintenance data and asset profile.
Expert Review: What Biogas Maintenance Teams Should Know About AI PdM ROI
The single biggest mistake I see biogas maintenance teams make when evaluating AI predictive maintenance is treating the financial case as a future projection rather than a documented reality. They ask vendors for general ROI estimates instead of demanding data from facilities that match their own operating profile — similar CHP engine model, comparable feedstock mix, equivalent capacity range. The variance in PdM ROI between a 1 MW food waste AD facility and a 5 MW dairy lagoon operation is enormous, and a vendor that cannot show you specific outcomes from a facility like yours is not ready to deliver predictable returns at your site.
Biogas Asset Management and Reliability Consultant
AD Operations and Maintenance Practice, 20 Years — CMRP
I have worked with over 40 biogas facilities on maintenance program improvement, and the most consistent pattern I see is that CHP engine maintenance consumes 50–60 percent of total maintenance spend but receives the least sophisticated condition monitoring. Facilities track oil analysis results and operating hours but do not connect those data streams to generate a continuous asset health score. The ROI of AI PdM on CHP engines alone is so clear that it should be the entry point for any biogas facility considering the technology — a single prevented valve recession or bearing failure on a 1 MW engine pays for the entire platform cost for 12–18 months.
CHP Engine and Gas Handling Reliability Specialist
Biogas Maintenance Optimization, 16 Years
Frequently Asked Questions
The typical payback period for AI predictive maintenance platform deployment at biogas plants ranges from 6 to 9 months for facilities of 1–5 MW capacity, with smaller facilities at the longer end of the range and larger facilities achieving faster payback due to higher asset density and greater avoided failure cost potential. Payback is driven primarily by prevented CHP forced outage events — a single avoided major CHP failure at a 2 MW facility with PPA exposure of $0.08/kWh typically saves $150,000–$250,000, which exceeds the total first-year platform cost for most facility configurations.
iFactory's AI platform deploys using the data your facility already generates. The primary data requirements are: SCADA historian access with 12–24 months of historical process data at minimum 5-minute polling frequency — covering CHP engine parameters (temperatures, pressures, vibration, electrical output, oil analysis results), digester parameters (temperature, pH, volatile fatty acids, gas production rate, methane content), and gas handling parameters (H₂S concentration, siloxane levels, compressor operating data). Secondary data sources that enhance model accuracy include CMMS work order history, maintenance records, and asset specification documentation.
Biogas plants operate under fundamentally more variable conditions than natural gas power generation or industrial manufacturing — feedstock quality changes by season and by supplier, digester biology responds to temperature and loading shifts, and CHP engine inputs vary with gas composition. iFactory's AI models are specifically designed for this variability. Rather than comparing current readings against fixed thresholds (which would trigger false alarms under normal variable operation), the models learn the dynamic normal operating envelope of each asset across all operating conditions — including load changes, feedstock transitions, and seasonal ambient temperature shifts. A deviation from the learned normal envelope at current conditions is flagged as a potential degradation signal, while a reading that would be abnormal at steady state but is normal during a feedstock transition is correctly classified as expected behavior. The models continuously update their normal envelope as new operating data is collected, ensuring that gradual changes in feedstock profile or operating strategy do not produce false alerts. This adaptive approach is the key technical difference between AI PdM platforms trained on biogas data versus generic industrial AI platforms.
Yes — iFactory's platform is designed to integrate with existing CMMS systems rather than replacing them. When the AI models detect a degradation pattern exceeding the actionable threshold, the platform automatically creates a work order in the facility's existing CMMS with asset identification, degradation description, recommended intervention type, suggested timing window, and priority classification. The maintenance team executes the work order through their existing workflow — no new system adoption is required.
The total cost of iFactory's AI predictive maintenance platform for a biogas facility varies with facility size, number of monitored asset classes, and CMMS integration scope, but the typical annual investment ranges from $42,000 to $88,000 for facilities of 1–10 MW capacity. This includes the platform subscription with SCADA data integration, AI model training and deployment, automated work order generation, and continuous model improvement across all monitored asset classes.
AI Predictive Maintenance for Biogas Plants — Measurable ROI from Week Six
iFactory's AI predictive maintenance platform delivers documented financial returns across CHP engine, digester, and gas handling asset classes at operating North American biogas facilities — with typical 6–9 month payback, 42% unplanned downtime reduction, and $380K average annual savings at deployed sites.
Conclusion: The ROI of AI Predictive Maintenance Is Not Theoretical
The financial case for AI-driven predictive maintenance at biogas plants is built on documented outcomes, not vendor projections. One prevented CHP forced outage pays for the platform. One avoided digester process upset covers the implementation cost. One season of extended gas handling equipment runtime without unplanned failure generates positive net ROI for the entire monitoring program. These are not hypothetical scenarios — they are the average outcomes measured across operating biogas facilities using iFactory's AI predictive maintenance platform, and they are achievable at any AD facility with existing SCADA data and a maintenance team ready to shift from reactive response to condition-based intervention.
The math is straightforward and the evidence is available. Maintenance is one-third of biogas plant OPEX. AI-driven predictive maintenance reduces that cost by converting emergency repairs to planned interventions, extending asset life through optimized overhaul timing, and preventing the highest-cost failure events before they occur.