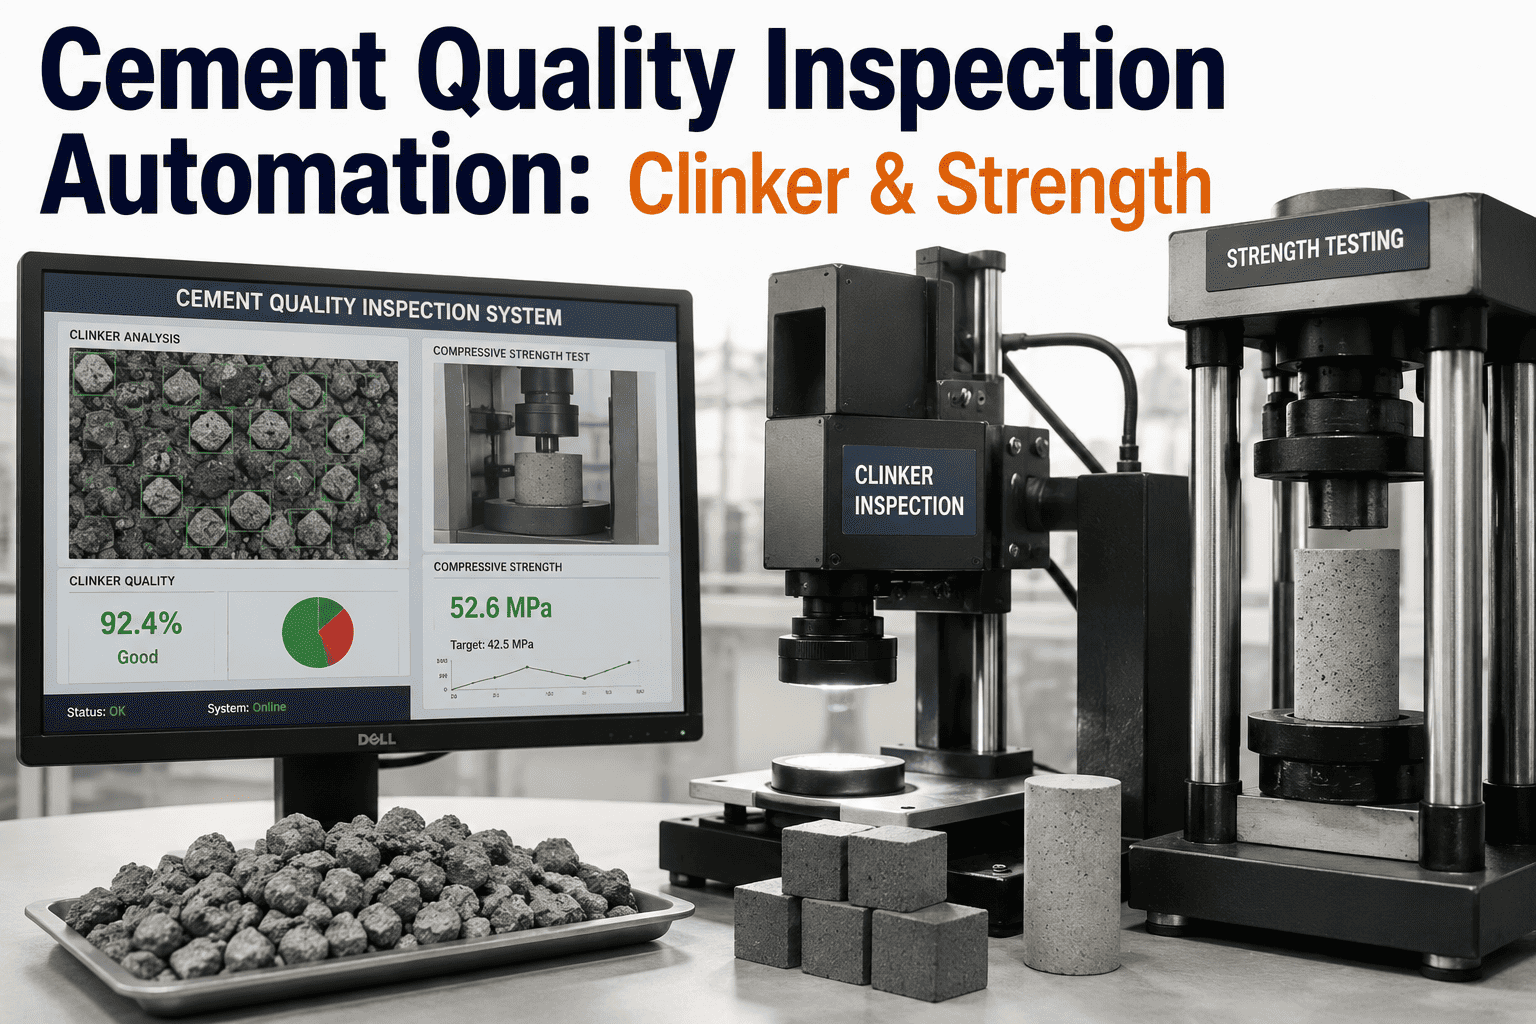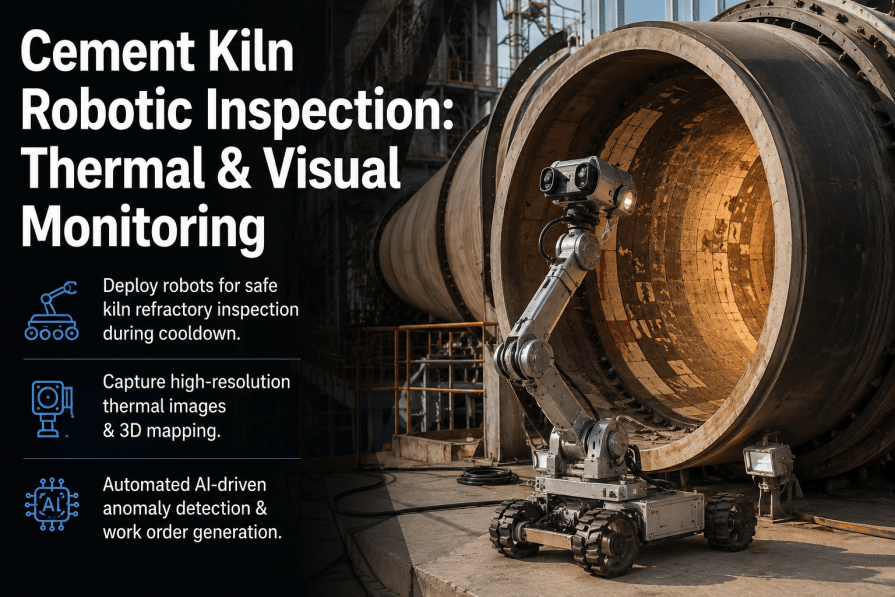
Clinker quality has always been judged the same way at most cement plants: a shift chemist glances at a tray of nodules under a hood light, checks the colour against memory, eyeballs the size spread, and calls it normal, hard-burnt, or reject. That judgment call happens every two to four hours, depends entirely on who is standing at the discharge point that day, and arrives long after several hundred tonnes of clinker have already moved past the sampling point into storage. AI vision cameras mounted at kiln discharge and clinker cooler transfer points remove that guesswork by scoring colour, size distribution, and surface texture on every pass, continuously, and comparing each reading against a plant-specific quality baseline instead of a chemist's memory. Plants that book a demo with iFactory typically start with a two-week baseline capture before moving to live grading.
Grade Every Batch of Clinker the Moment It Leaves the Kiln
iFactory's AI vision cameras classify clinker colour, nodule size distribution, and surface texture at the discharge chute in real time, replacing subjective visual grading with objective, repeatable quality scoring that never takes a break.
Why a Human Eye Cannot Keep Up With Clinker Variability
Clinker colour and size are not cosmetic details. Colour shifts toward lighter grey typically point to a higher alumina modulus and a different C3A to C4AF balance, while a darker, glassy appearance often signals a reducing atmosphere in the burning zone that leaves excess free lime trapped inside the nodule. Size matters just as much: healthy clinker nodules generally fall in a 3 to 25 millimetre range, and oversized lumps abrade the kiln shell and refractory lining every time they tumble through the cooler grate. None of this is visible on a control room trend screen, because none of it is currently being measured continuously. It is measured by eye, occasionally, by whoever is closest to the discharge hood.
Colour Judgment Drifts Between Shifts
Every operator carries a slightly different mental reference for what normal clinker looks like. A new hire and a twenty-year veteran will describe the same tray differently, and that inconsistency means quality drift can run for hours before anyone flags it.
Sampling Misses the Interval Between Checks
Manual grab samples happen every few hours at best. A burning zone upset that starts and partially corrects itself between two sampling rounds never gets recorded, even though it may have produced tonnes of off-spec clinker.
Size Distribution Is Rarely Quantified
Oversized nodules and excessive fines are usually noted qualitatively — "a bit chunky today" — rather than measured as a percentage distribution that can be tracked, trended, and tied back to kiln operating parameters.
Root Cause Takes Hours to Trace
By the time a lab free-lime result confirms a quality problem, the kiln feed rate, fuel mix, and cooler airflow have all changed several times, making it difficult to pin the deviation to a specific operating window.
Manual Grading vs AI Vision Classification
The table below lines up the same four clinker quality parameters as they are typically handled today against how an AI vision camera evaluates them at the discharge point, continuously and without operator involvement.
| Quality Parameter | Traditional Manual Method | Typical Check Frequency | AI Vision Method | Detection Speed |
|---|---|---|---|---|
| Clinker colour | Visual comparison under hood lighting | Every 2 to 4 hours | RGB and greyscale colour histogram scoring | Every camera frame |
| Nodule size distribution | Rough visual estimate, occasional sieve check | Once per shift | Automated particle boundary detection and sizing | Continuous |
| Surface texture and porosity | Hand-break test on sample nodules | Once per shift | Surface texture and edge-sharpness analysis | Continuous |
| Dust and fines carryover | Noted informally by discharge operator | Irregular | Fines percentage estimated from frame coverage | Continuous |
| Oversized lump flagging | Operator judgment during walk-past | Irregular | Automatic bounding-box flag with size in millimetres | Real time |
How the Classification Model Works at the Discharge Point
The camera does not replace your lab. It closes the gap between lab results that arrive hours later and what is actually leaving the kiln right now, giving your process team a continuous quality signal to react to instead of a single point-in-time reading.
Camera Capture at the Discharge Chute
An industrial-rated camera housed for high heat and dust is positioned at the clinker discharge or cooler transfer point, capturing continuous frames of the falling clinker stream under consistent lighting.
Nodule Isolation and Feature Extraction
The model isolates individual nodules within each frame and extracts colour histogram, edge boundary, and surface texture features for every visible piece of clinker.
Classification Against Plant Baseline
Extracted features are scored against a baseline built from your own historical good-quality clinker, not a generic industry reference, so the grading reflects your raw mix and kiln profile.
Alert and Trend Delivery
Deviations in colour, size, or texture trigger an alert to the control room within seconds, while every reading is logged to build a rolling trend line that correlates with kiln feed, fuel, and cooler air changes.
Bring Objective Clinker Grading to Your Kiln Line
Our engineers can review footage from your existing discharge camera, or help you plan camera placement if you don't have one yet, before any commitment is made.
Clinker Vision Classification — Frequently Asked Questions
Does AI vision classification replace free-lime lab testing?
No, and it isn't meant to. Free-lime titration remains the definitive chemical measurement of burning quality. What the camera adds is a continuous visual signal between lab samples, so operators can see colour and size drift developing in real time rather than waiting two to four hours for the next result. Many plants that book a demo use the vision data specifically to decide when an off-cycle lab sample is worth pulling.
How does the camera handle the heat and dust at a kiln discharge point?
Cameras are installed in industrial housings rated for the ambient heat, dust loading, and vibration typical of a discharge chute or cooler transfer zone, with air purge or cooling jackets specified based on the exact mounting location. Lens cleaning cycles and housing placement are planned during the site survey so image quality holds up over months of continuous operation, not just during a demo period.
What causes clinker to come out lighter or darker than the plant's normal shade?
Colour is influenced primarily by the alumina modulus and by whether the burning zone atmosphere is oxidising or reducing. A higher alumina modulus generally produces a lighter clinker, while a reducing atmosphere caused by incomplete fuel combustion tends to darken the nodule and trap free lime inside it. The AI model doesn't diagnose the chemistry itself, but its colour trend line gives your process engineers an early, continuous signal of when those conditions may be shifting, which they can then confirm through lab testing and support resources at ifactoryapp.com/support.
Can the system flag oversized clinker lumps before they damage the kiln shell?
Yes. The model draws a size boundary around every visible nodule and flags anything above your defined oversize threshold, tagging the frame with an estimated dimension in millimetres. Oversized lumps are a known contributor to refractory and kiln skin wear, so plants use this flag to catch a drift toward coarser clinker before it becomes a pattern rather than an isolated event.
How long does it take to get a working baseline for our specific clinker?
Most plants run a two to three week capture window during normal, known-good operation to build a colour, size, and texture baseline specific to their raw mix and kiln profile. Once that baseline is set, live classification and alerting can go active immediately, and the baseline is refined further as more seasonal and fuel-mix variation is captured over the following months.
Stop Grading Clinker Quality by Memory
iFactory's AI vision cameras give your discharge point a continuous, objective quality signal that catches colour and size drift long before a lab sample ever confirms it — so corrective action starts sooner and off-spec clinker gets caught earlier.