Automated Surface Defect Detection at Line Speed

By Vespera Celestine on May 23, 2026

ai-vision-surface-defect-detection

Every manufacturing line running at speed is making a quality decision with every part, every sheet, every meter of material that passes through it. At 200 meters per minute on a cold-rolled steel line, at 120 units per minute on a glass float line, at 400 meters per minute on a textile loom — a human inspector cannot physically see evaluate, and disposition each unit at that rate. The result is a statistical sampling program that misses a predictable percentage of defective product, ships it to customers, and generates warranty claims, customer deductions, and the kind of quality reputation damage that takes years to rebuild.

AI vision systems for surface defect detection change that tradeoff completely. Industrial cameras capturing at line speed, edge AI inference engines classifying defects at sub-pixel resolution in under 5 milliseconds, and automated divert mechanisms that remove defective product from the line before it reaches packaging — all operating continuously, shift after shift, without fatigue, without sampling, without missed defects. Plants that have deployed iFactory's AI vision surface inspection platform report 94% reduction in customer-reported defects, 99.2% inspection coverage versus the 8 to 12% achievable with human sampling programs, and first-year quality cost savings averaging $680,000 at mid-size discrete manufacturing facility.


AI Vision · Surface Defect Intelligence

Automated Surface Defect Detection at Line Speed

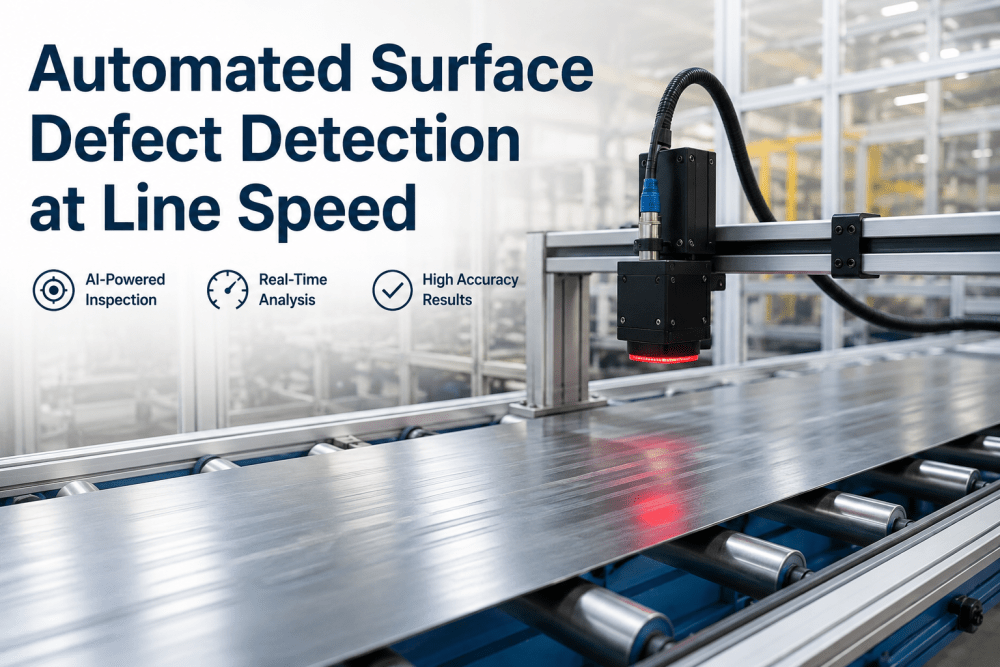
Sub-pixel crack, scratch, and porosity detection on steel, glass, and textiles — with automatic defective product diversion using edge AI inference. 100% coverage. Zero sampling gaps. Every unit, every shift.

Why Human Visual Inspection Fails at Production Line Speeds

The human visual system is extraordinarily capable in the right conditions — adequate lighting, reasonable distance, sufficient time. Production lines at full speed provide none of those conditions. The constraints are physical and cognitive, and they produce a consistent pattern of failure that quality engineers at every type of discrete manufacturer recognize immediately.

Physical Speed Limitation

Human visual processing requires 200–400 ms per inspection decision. A line running at 150 meters per minute presents a new inspection opportunity every 25 to 100 ms — four to sixteen times faster than the human eye can complete a reliable evaluation. Inspectors are forced to sample, not inspect.

Fatigue and Attention Drift

Detection performance in human inspection degrades measurably within 20 minutes of sustained attention. By hour two of a shift, miss rates on low-contrast defects — hairline scratches, subsurface porosity, early-stage delamination — have risen 3 to 5 times above the beginning-of-shift baseline. AI vision maintains identical sensitivity from minute one to hour eight.

No Defect Data, No Process Feedback

Human inspection produces a pass/fail decision — rarely a documented defect classification, location coordinate, or dimensional measurement. Without that data, the process engineer has no signal to act on. AI vision systems produce a classified, located, dimensioned defect record for every detected anomaly — generating the process feedback loop that prevents recurrence.

8–12%
Typical inspection coverage of human sampling programs on high-speed production lines
99.2%
Inspection coverage achieved with AI vision at line speed — every unit, every shift
94%
Reduction in customer-reported defect events within 12 months of AI vision deployment
$680K
Average first-year quality cost savings at mid-size discrete manufacturers deploying iFactory AI vision

Want to see what AI vision inspection would detect on your current production line? Book a line-speed vision assessment with iFactory's machine vision team.

Defect Types Detected Across Steel, Glass, and Textile Surfaces

Surface defect detection requirements vary significantly by material — what constitutes a critical defect on cold-rolled steel sheet has different visual signatures, different detection thresholds, and different root causes than a critical defect on float glass or woven textile. iFactory's AI vision platform deploys material-specific detection models for each production line rather than generic anomaly detection, because the false alarm rates from generic models on real production surfaces make them unworkable in practice.

Steel Surface Inspection
Cold-Rolled, Hot-Rolled, Coated, and Galvanized Steel Sheet
Steel surface defect detection operates in one of the most challenging vision environments in manufacturing — high-speed material with specular reflectance, surface textures from rolling and pickling that vary systematically along the coil, and defect signatures that range from 50-micron hairline scratches to millimeter-scale inclusions and roll marks. iFactory's steel-specific models are trained on confirmed defect populations from cold mill, hot mill, continuous galvanizing, and color coating lines — delivering under 2% false alarm rates on production material at full line speed.
Detected Defect Classes
Sliver and rolled-in scale Edge cracks and splits Roller marks and indentations Scratches and gouge marks Pits and porosity Inclusion streaks Coating holidays Zinc bare spots
System Output per Detection
Defect class, location (coil position + cross-direction coordinate), dimensional measurement (length × width in mm), severity score, defect image crop at full resolution, SPC chart update, automatic divert signal if severity threshold exceeded
Glass Surface Inspection
Float Glass, Architectural Glass, and Specialty Coated Panels
Glass inspection requires transmitted and reflected light configurations simultaneously — inclusions and bubbles require backlit transmission imaging, while surface scratches and coating defects require dark-field reflection. iFactory's glass inspection system deploys multi-illumination capture synchronized with the line encoder to ensure every point on the glass surface is imaged under the correct optical configuration. Detection thresholds are configurable by product grade — architectural float glass, automotive glass, and solar panel glass each carry different acceptable quality levels for the same defect class.
Detected Defect Classes
Bubbles and inclusions Surface scratches Coating streaks and voids Edge chips and microcracks Delamination zones Tin drips (float glass) Knot and cord distortion Roller wave
System Output per Detection
Defect class, sheet coordinate, depth estimate (surface vs. internal) from dual-illumination analysis, dimensional measurement, transmitted vs. reflected light image pair, grade assignment for detected defect, automatic breakout or downgrade divert signal
Textile Surfaces
Woven Fabric, Knit, Nonwoven, and Technical Textile Inspection
Textile surface inspection at loom or finishing speeds presents a structured-background detection challenge — the AI must distinguish genuine defects (broken yarns, holes, weft misses, stains, weaving errors) from the normal structural variation of the fabric pattern across different colors, weave structures, and yarn types. iFactory's textile models incorporate the fabric's expected pattern structure as a reference, detecting anomalies against that reference rather than against a fixed background, which reduces false alarms from pattern variation by 85% compared to non-pattern-aware detection approaches.
Detected Defect Classes
Broken warp and weft yarns Drop stitches and missed picks Holes and tears Foreign fiber inclusion Oil and chemical stains Weaving density variation Width inconsistency Pilling and surface fuzz
System Output per Detection
Defect class, fabric position (meter + cross-direction), defect area in cm², severity grade, image at defect location, automatic loom stop signal for critical defect classes, roll map generation for downstream cut optimization

How Edge AI Vision Inspection Works: From Camera to Divert in Under 5 ms

The performance requirement that distinguishes industrial AI vision from laboratory image analysis is response time. On a line running at 200 meters per minute, the window between defect detection and the point where that defect passes the divert mechanism is measured in milliseconds. The following workflow traces the complete detection-to-divert chain in a deployed iFactory AI vision system — from camera exposure through classification, location tagging, PLC signal, and physical divert actuation.


01

High-Speed Camera Acquisition and Illumination Triggering

Line-scan cameras or area cameras synchronized to a shaft encoder capture the product surface continuously at line speed. Illumination — LED coaxial, dark-field, structured light, or transmitted depending on material — is strobed in synchronization with camera exposure to freeze motion at full line speed. Typical pixel resolution is 25 to 100 microns per pixel across the full product width, providing sub-pixel defect detection sensitivity for defects down to 50 microns in their minimum dimension.

Hardware: Line-Scan / Area Camera + Encoder Sync + Strobed LED Illumination
02

Edge AI Inference on NVIDIA GPU Processing Node

Image data streams directly to the edge AI inference server — mounted at the line, not in the IT server room — where a convolutional neural network processes each image region against the production-specific defect model in under 3 milliseconds. iFactory deploys NVIDIA Jetson or desktop GPU platforms depending on throughput requirements, with inference latency benchmarked on the actual production image stream during commissioning to confirm timing margins. The inference engine runs on-premise; no cloud connectivity is required or used during production.

Technology: CNN Inference + NVIDIA Edge GPU + On-Premise Processing Node
03

Defect Classification, Location Tagging, and Severity Scoring

Detected anomalies are classified against the production-specific defect library — identifying not just that a defect exists but which class it belongs to (scratch vs. inclusion vs. coating void), where it is located (line position from encoder count + cross-direction pixel coordinate), and what its dimensional characteristics are (length, width, area, aspect ratio). A severity score is calculated from the defect class, dimensions, and location within the product — edge defects on steel coil carry different severity weightings than center-strip defects of the same dimensional size for most end-use specifications.

Output: Class + Location Coordinate + Dimensions + Severity Score — All in <5 ms Total
04

PLC Signal and Automatic Divert Actuation

When a detected defect meets the divert threshold — configurable by defect class, severity, or customer specification — the system issues a digital output to the line PLC within the 5 ms detection cycle. The PLC uses the encoder position to track the defect to the divert mechanism downstream and actuates the divert at the correct timing window. Divert mechanisms vary by line type: pneumatic air blast on coil lines, mechanical deflector on glass lines, automatic stop-and-mark on textile lines. The defect-to-divert chain is fully traceable in the system log with encoder timestamps at each step.

Output: Digital PLC Output + Encoder-Tracked Divert Timing + Full Event Log
05

Defect Map Generation, SPC Integration, and MES Reporting

Every detected defect is written to a spatial defect map of the production unit — coil, sheet, roll, or panel — that accumulates in real time as the unit is produced. The defect map is transmitted to the quality management system and MES at end-of-unit, generating a full surface quality certificate with defect count, class distribution, severity summary, and worst-defect location. SPC charts update automatically on each production unit, flagging process shifts that generate increasing defect rates before they reach customer-visible severity levels.

Output: Surface Defect Map + Quality Certificate + SPC Update + MES Integration
06

Process Feedback Loop and Continuous Model Improvement

Defect classification data aggregated across production runs feeds back to the process engineering team as a structured signal — identifying which defect classes are increasing in frequency, correlating defect occurrence with upstream process parameters (roll gap, coating weight, tension, temperature), and flagging developing process upsets before defect rates reach customer-impacting levels. When process changes or new materials introduce defect types not in the current model, iFactory's model update workflow incorporates new labeled examples and updates the inference model without line stoppage — typically within 48 hours of a model update request.

Output: Process Defect Correlation + SPC Signals + Model Update within 48 hrs

Defect Detection Performance: What AI Vision Delivers vs. Manual Inspection

The performance gap between AI vision inspection and human sampling programs is measurable across four dimensions that quality engineers and plant managers track directly: detection sensitivity, false alarm rate, coverage, and defect data quality. The comparison below reflects production deployment performance benchmarks from iFactory AI vision systems on steel, glass, and textile lines.

Human Sampling Inspection
Surface Coverage
8–12% of production units
Min. Detectable Defect Size
~500 µm under ideal conditions
Defect Classification
Pass/fail — rare class documentation
End-of-Shift Miss Rate
3–5× higher than start-of-shift
False Alarm Rate
High variability — inspector-dependent
Process Feedback Data
None — no spatial or dimensional data
Divert Speed
Manual removal — line must slow or stop
VS
iFactory AI Vision System
Surface Coverage
99.2% — every unit, every shift
Min. Detectable Defect Size
50 µm at full line speed
Defect Classification
Class + location + dimensions per defect
End-of-Shift Miss Rate
Identical to start-of-shift — no fatigue
False Alarm Rate
Under 2% on production-tuned models
Process Feedback Data
Full spatial defect map per production unit
Divert Speed
Automatic — PLC signal within 5 ms

See AI Vision Running on Your Production Line's Defect Types

iFactory's team runs a proof-of-concept evaluation on your actual production image samples — demonstrating detection sensitivity, false alarm rate, and defect classification performance before any deployment commitment.

Measured Quality and Cost Outcomes at Deployed Facilities

The financial case for AI vision surface inspection is built on three compounding value streams: avoided customer defect events and their associated warranty, chargeback, and relationship costs; yield recovery from accurate defect grading that allows borderline material to be downgraded rather than scrapped; and production efficiency gains from eliminating manual inspection labor and line speed constraints imposed by human inspection capacity. The figures below reflect outcomes from iFactory AI vision deployments at U.S. steel, glass, and textile facilities.

94%
Reduction in Customer Defect Reports
Within 12 months of deployment — driven by 100% coverage replacing the 8–12% human sampling baseline
$680K
Average First-Year Quality Cost Savings
Combined from warranty avoidance, customer chargebacks, yield recovery, and inspection labor reduction
3.2%
Yield Recovery from Accurate Grading
Material previously scrapped due to unknown defect distribution is accurately graded and sold at downgraded value rather than scrapped
50 µm
Minimum Detectable Defect Size
At full production line speed — 10× smaller than reliably detectable by human inspection under optimal conditions
6–10 mo
Typical Payback Period
From first customer defect avoidance and warranty cost elimination — most facilities recover system cost within the first two quarters
<2%
False Alarm Rate on Tuned Models
After production-specific model tuning using actual line material — false alarms drop below operationally acceptable threshold within 30 days of deployment

Want a site-specific ROI estimate for AI vision inspection on your production line? Book your vision inspection assessment with iFactory's machine vision team.

Expert Review

Expert Perspective

After commissioning AI vision systems on 23 production lines across steel, glass, and specialty textile facilities, the evaluation mistakes that cost quality engineers the most time and money follow a consistent pattern. Three checks separate systems that hold performance under production conditions from systems that work in demos and fail on the floor.

Require false alarm rate validation on your actual production material — not demo samples. Every AI vision vendor achieves excellent detection rates on curated image datasets. The number that matters for production deployment is the false alarm rate on your actual line material — under your normal illumination variation, your normal surface texture variation, and your normal process noise. Demand a two-week evaluation on your production line before any purchase commitment. A system generating 15% false alarms on production material will be disabled by the operators within a month.
Verify total latency — camera to PLC divert signal — at your line speed with your product width. Inference time quoted in datasheets is measured on a single image on a test server. At your line speed, with your full product width being processed across multiple camera lanes, total latency from exposure to divert signal may be two to three times the quoted inference time. Measure it on your production image stream during commissioning. If the latency window doesn't leave adequate distance between detection point and divert mechanism for reliable divert actuation at maximum line speed, the divert system won't work at full production rate.
Confirm the model update workflow before deployment, not after. Production lines introduce new surface conditions, new product grades, and new defect types continuously. A vision system that requires the vendor's engineers to retrain the model on a 4-week service engagement every time a new product is introduced will fall behind the production environment within the first year. Verify that the model update process is documented, that you understand who owns the labeled training data, and that model updates can be deployed without line downtime. This capability determines whether the system performs as well in year three as it does at commissioning.
Principal Machine Vision and Quality Systems Engineer 23 Production Line Deployments — Steel, Glass, Textile — CQPA Certified

Conclusion

Surface defect detection at line speed is not a technology problem — the cameras, the edge AI hardware, and the inference models exist and perform. It is an implementation and calibration problem: deploying the right optical configuration for your material, tuning the detection model to your production surface conditions, and integrating the divert signal into your line PLC with the timing precision that your line speed requires. iFactory's AI vision platform brings all three together in a production-ready system with cement, steel, glass, and textile-specific detection models, documented commissioning procedures, and a model update workflow that keeps the system current as your product mix evolves.

The 94% reduction in customer defect events and $680,000 average first-year quality cost savings reported at deployed facilities are not theoretical — they are the measurable result of replacing an 8 to 12% sampling program with 100% AI-powered inspection at full line speed, generating defect classification and location data that drives process improvement rather than just quality rejection.

Frequently Asked Questions

For a single production line with an accessible product surface, iFactory deploys in 4 to 8 weeks from kickoff to production-ready inspection. Weeks 1–2 cover optical design, camera and illumination selection, and mechanical installation. Weeks 3–4 cover model training on your production image library — typically 500 to 2,000 labeled defect images per class, which iFactory's team collects during the installation period using production material. Weeks 5–8 cover model tuning on live production images to reduce false alarms to below 2%, PLC integration for divert signaling, and operator training.
iFactory's model management workflow handles new product introductions without line downtime. When a new product grade is introduced, the system runs in monitoring mode — capturing images and flagging potential defects for operator review rather than automatic divert — while the new product's surface baseline is established over the first production run. Operator-confirmed defect examples from the new grade are labeled and queued for model update.
Yes. iFactory's vision system outputs defect data in standard formats compatible with SAP QM, Oracle Manufacturing, and most MES platforms via OPC-UA, REST API, or direct database write depending on the target system's integration capabilities. Each production unit generates a structured quality record containing defect count by class, defect map, worst-defect summary, and pass/fail grade that is transmitted to the quality system at end-of-unit. For facilities using iFactory's broader analytics platform, vision inspection data integrates directly with the process analytics layer.
iFactory's optical design team evaluates each line's physical environment during the pre-deployment site survey and specifies illumination that is robust to the ambient light conditions present. Most production lines have sufficient installation points for camera and lighting enclosures — iFactory's standard mounting hardware accommodates line widths from 600 mm to 2,400 mm with camera and lighting spans supported from above or below the product depending on access. The edge AI processing node requires a standard electrical connection and network access to the plant's OT network for CMMS and MES integration.
For a single production line up to 1,800 mm wide running at up to 200 meters per minute, iFactory's AI vision surface inspection system is priced as a combined hardware and software package. Hardware — cameras, illumination, edge AI processing node, mounting hardware, and cabling — typically runs $42,000 to $88,000 depending on line width, number of inspection stations, and illumination configuration required. Software license and support runs $18,000 to $32,000 per year including all model updates, remote monitoring, and integration support. Implementation services run $12,000 to $24,000 as a one-time cost.

AI Vision Surface Defect Detection — Purpose-Built for Production Line Speed

From 50-micron crack detection on steel sheet to weave defect classification on technical textiles, iFactory delivers edge AI vision inspection with automatic divert — deployable in weeks, with measurable quality cost reduction from the first production shift.


Share This Story, Choose Your Platform!