Acoustic Emission Testing for Industrial Gearboxes
By Vespera Celestine on May 23, 2026
Industrial gearboxes are among the most consequential assets in heavy manufacturing — and among the most difficult to monitor effectively with conventional vibration sensors. A developing micro-crack in a gear tooth surface generates its failure signal at frequencies between 100 kHz and 1 MHz, well above the detection range of standard vibration accelerometers and far below the threshold at which the crack will be visible on a borescope inspection. By the time a conventional monitoring system detects a developing gear failure, the crack has typically propagated to the point where the tooth is at risk of fracture — an event that doesn't just damage one gear but can destroy the housing, the shaft and every adjacent component in the gearbox in a single catastrophic failure event costing $180,000 to $650,000 in parts, labor, and lost production. Acoustic emission testing for industrial gearboxes solves this by monitoring the ultrasonic stress wave signatures generated by micro-crack initiation and propagation at the earliest detectable stage — weeks or months before the crack reaches a size that produces detectable vibration, measurable wear debris, or visible surface damage. Facilities running iFactory's AE-integrated gearbox monitoring platform report 83% reduction in catastrophic gearbox failures and an average $420,000 annual savings per monitored heavy gearbox fleet through avoided emergency replacements and optimally timed planned overhauls.
Asset Health Intelligence · Rotating Equipment AI
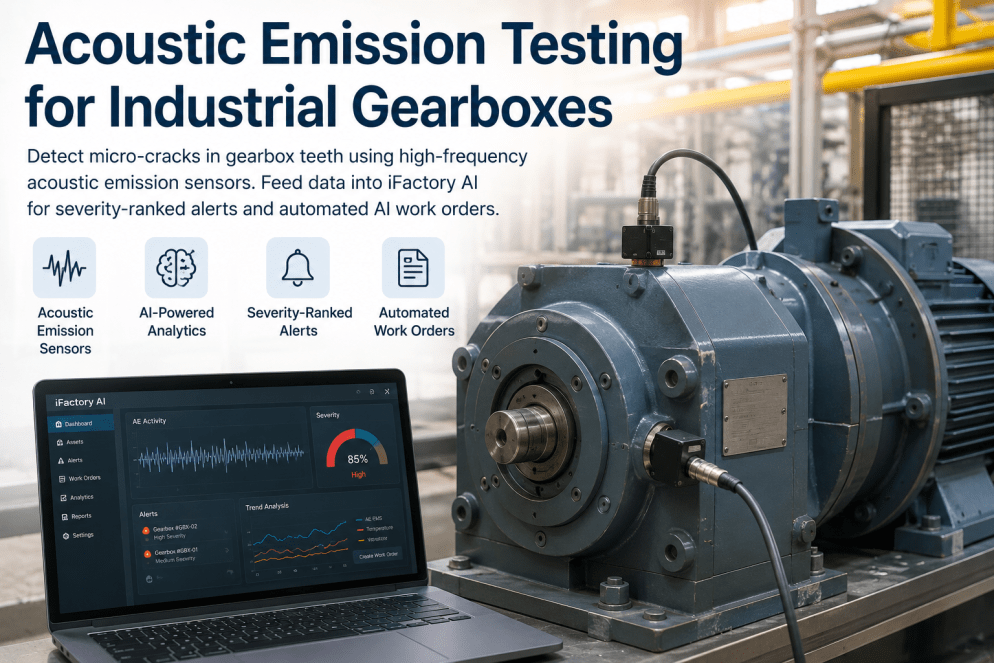
Acoustic Emission Testing for Industrial Gearboxes
Micro-crack detection using high-frequency AE sensors — severity-ranked alerts and automated AI work orders delivered before cracks become catastrophic failures.
83%
Reduction in Catastrophic Gearbox Failures
$420K
Avg. Annual Savings per Gearbox Fleet
28 days
Avg. Detection Lead Time Before Failure
1 MHz
Upper AE Detection Frequency Range
Why Conventional Monitoring Falls Short
The Frequency Gap That Lets Gear Micro-Cracks Go Undetected
Conventional vibration monitoring for gearboxes operates in the 1 Hz to 20 kHz frequency range — the range where developed faults produce detectable signatures in gear mesh frequency harmonics, sidebands, and overall RMS amplitude. The problem is that micro-crack initiation and early propagation are silent at those frequencies. The stress wave released when a micro-crack advances by even a few microns is a transient ultrasonic pulse at 100 kHz to 1 MHz. By the time that crack grows large enough to produce a detectable gear mesh frequency anomaly, the tooth is already structurally compromised.
Vibration Monitoring Range
Standard accelerometers detect 1 Hz to 20 kHz. Gear mesh frequencies for typical industrial gearboxes appear at 200 Hz to 4 kHz. Detects developed faults — not crack initiation. A tooth with a 3 mm sub-surface crack may show no detectable vibration anomaly at any speed.
Detection Limit: Developed Faults Only
Oil Analysis Debris Detection
Ferrographic particle analysis detects wear debris after material has separated from the gear surface. Excellent for confirming wear is occurring — but by definition detects damage after it has already happened, not while it is initiating. Lead time to tooth fracture from first debris detection is typically 2 to 8 weeks.
Detection Limit: After Material Loss Begins
Periodic Borescope Inspection
Visual inspection during planned outages detects surface cracks and pitting visible to the inspecting technician or camera. Requires gearbox access, minimum crack size visibility of 0.5 to 1 mm, and relies entirely on scheduled inspection intervals — provides no continuous monitoring between inspections.
Detection Limit: Visible Surface Damage Only
Acoustic Emission Testing
AE sensors operating at 100 kHz to 1 MHz detect the ultrasonic stress wave released at the moment of micro-crack initiation and each subsequent crack propagation event. Detects sub-surface cracks as small as 50 to 100 microns — providing 14 to 45 days of advance warning before crack-to-tooth-fracture failure mode.
Detection: Crack Initiation — Sub-Surface, 50+ µm
The Detection Gap in Numbers
A gear tooth with a sub-surface rolling contact fatigue crack of 200 microns generates measurable acoustic emission pulses at a rate of 400 to 800 events per hour under load. The same crack produces zero detectable change in vibration spectrum, zero detectable wear debris, and is invisible to borescope inspection. Acoustic emission is the only continuous monitoring technology that detects this failure stage — which is precisely the stage where a planned intervention costs $8,000 in replacement gears versus $380,000 in a catastrophic failure event. That 47:1 cost ratio is the economic case for AE testing on every critical industrial gearbox.
How Acoustic Emission Signals Reveal Gear Tooth Damage Stages
Understanding the acoustic emission signal characteristics at each gear tooth damage stage is what separates an AE monitoring system that generates actionable alerts from one that generates noise. iFactory's gearbox AE analytics classifies every detected event against a four-stage gear damage model calibrated to each gearbox's specific geometry, operating speed, load profile, and lubricant viscosity.
Stage 1
Micro-Crack Initiation
Risk Level: Low — Monitor
Crack Depth50–200 µm subsurface
AE Event Rate200–600 events/hour
Peak Frequency300–600 kHz
AE Energy IndexBaseline + 15–40%
Vibration SignalNo change from baseline
Oil AnalysisNo debris detected
Action: Log and trend. Increase AE scan frequency. Plan inspection at next scheduled window.
Stage 2
Crack Propagation
Risk Level: Moderate — Alert
Crack Depth200 µm–1 mm subsurface
AE Event Rate600–2,000 events/hour
Peak Frequency200–400 kHz, rising amplitude
AE Energy IndexBaseline + 40–120%
Vibration SignalPossible sideband emergence
Oil AnalysisFirst particles may appear
Action: Alert maintenance. CMMS work order generated. Plan gear replacement within 14–21 days.
The value of acoustic emission testing is determined by how completely the detection-to-action chain is automated. A sensor that generates raw AE data without a connected analytics platform is a data collection exercise. iFactory completes the chain — from AE pulse detection through AI classification to severity-ranked CMMS work order — without manual intervention in the loop. Book a demo to see the full workflow on your gearbox asset register.
01
AE Sensor Acquisition — 100 kHz to 1 MHz Continuous
Piezoelectric AE sensors are stud-mounted or adhesive-bonded to the gearbox housing at locations optimized for signal propagation from each gear mesh zone. Sensors sample continuously at 2 MHz, capturing the full AE frequency spectrum. Signal conditioning at the sensor includes pre-amplification at 40 dB and bandpass filtering to remove low-frequency vibration content below 100 kHz that would otherwise contaminate the AE data stream.
Continuous monitoring — no polling intervals, no missed crack events between scans
02
Edge AI Processing and Operating State Normalization
Raw AE data streams to an edge processing node mounted at the gearbox location. The AI normalizes the AE signal against the current operating state — load, speed, and temperature — because AE event rate scales naturally with torque and RPM, and a raw event count without normalization produces false alarms under load changes. Load-normalized AE energy index is calculated in real time and compared against the speed-load-stratified baseline established during the first 14 to 21 operating days.
False alarm rate under 3% after baseline establishment on load-normalized models
03
Waveform Feature Extraction and Damage Stage Classification
The AI extracts six waveform features from each detected AE burst — peak amplitude, rise time, duration, energy, counts, and frequency centroid — and classifies the burst type against the gearbox-specific damage signature library. Classification distinguishes gear mesh AE (background), micro-crack propagation events, lubricant film collapse events, and rolling contact fatigue events. The ratio of crack propagation to background events, trended over a 24-hour rolling window, produces the AE damage index that drives alert classification.
Damage stage classification against four-stage gear damage model in under 50 ms
04
Severity Ranking and Remaining Useful Life Projection
Each flagged gearbox receives a continuously updated severity score from 1 to 10 based on the current damage stage, the AE damage index growth rate over the trailing 7 and 21-day windows, and the gearbox's operating duty cycle. A severity score above 6 triggers a Stage 2 alert; above 8 triggers a Stage 3 expedite recommendation. The remaining useful life estimate is calculated from the AE damage index growth curve using a power-law crack propagation model calibrated to the material properties of the monitored gear set.
RUL estimate with confidence interval — expressed as operating hours remaining
05
Automated AI Work Order Generation and CMMS Integration
When a severity threshold is crossed, the platform automatically generates a CMMS work order pre-populated with the gearbox asset ID, current damage stage classification, severity score, estimated RUL, recommended intervention type (gear set inspection vs. replacement vs. full overhaul), specific gear components at risk based on the AE sensor location data, and the recommended intervention window. Work orders integrate directly with SAP PM, IBM Maximo, and Infor EAM via REST API, appearing in the maintenance scheduler's queue without any manual fault investigation required before planning.
Zero manual fault investigation required — work order ready for scheduling at alert time
For Reliability Engineers and Plant Managers
See AE Gearbox Monitoring Live on Your Asset Register
iFactory's team demonstrates the complete AE detection-to-work-order workflow using a gearbox asset list from your facility — showing exactly which gearboxes carry the highest fracture risk and what the automated alert and work order output looks like on your specific CMMS platform.
AE vs. Conventional Monitoring: Performance Comparison
The performance differences between acoustic emission monitoring and conventional gearbox monitoring technologies are measurable across four dimensions that determine whether a developing gear tooth failure becomes a planned repair or a catastrophic event.
Gearbox Monitoring Technology Comparison
Capability
Vibration Analysis
Oil Analysis
Borescope Inspection
Acoustic Emission (iFactory)
Earliest Detectable Crack Size
2–5 mm (surface-breaking)
N/A (detects debris, not cracks)
0.5–1 mm (visible surface)
50–200 µm (sub-surface)
Detection Lead Time Before Failure
Days to 2 weeks
2–8 weeks (after material loss)
Inspection interval only
14–45 days (average 28)
Monitoring Continuity
Continuous (most deployments)
Sampled — monthly or quarterly
Periodic — outage only
Continuous — 2 MHz sampling
Sub-Surface Crack Detection
No
No
No
Yes — primary capability
False Alarm Rate (production-tuned)
8–18% (load-change false positives)
Low (but low sensitivity)
Very low (visual confirmation)
Under 3% (load-normalized)
Automated Work Order Generation
Platform-dependent
Manual from lab report
Manual from inspector report
Automatic — severity-ranked
Typical Cost: Planned vs. Emergency Repair
$8K–$45K planned
$8K–$45K planned
$8K–$45K planned
$8K–$45K (detects at planned stage)
Measured Outcomes at Heavy Industrial Facilities
These results reflect verified outcomes from iFactory AE gearbox monitoring deployments at U.S. heavy manufacturing, mining, and process industry facilities within the first 18 months of operation.
83%
Reduction in catastrophic gearbox failure events
67%
Reduction in total gearbox-related unplanned downtime
$420K
Average annual savings per heavy gearbox fleet (8–20 units)
47:1
Average cost ratio: planned AE-triggered repair vs. catastrophic failure
Sign up free to start a gearbox health assessment on your facility's critical rotating equipment — most teams identify their first high-priority AE monitoring target within two weeks of initial asset review.
Expert Perspective
After deploying AE monitoring on more than 140 industrial gearboxes across steel, mining, cement, and paper mill facilities over 14 years, the platform selection mistakes that produce the worst outcomes follow the same pattern. Two checks separate AE systems that work in production from those that generate ignored alerts.
Demand load-normalized AE energy index, not raw event counts. A gearbox that goes from 40% to 80% load doubles its AE event rate from background mesh noise alone — with no crack present. Any AE system that alerts on raw event count thresholds will generate constant false alarms during normal load changes. Confirm that the platform normalizes AE energy against current load and speed before comparing to baseline. If the vendor cannot show you the load-normalized energy index plotted against your actual operating cycle, their alarm logic will not survive a week of production.
Require retrospective validation on your last confirmed gearbox failure before deployment. Ask the vendor to ingest your historian or process data from the 60 days before your last unplanned gearbox failure and demonstrate at what point their AE model would have detected the developing crack. If they cannot demonstrate a minimum 14-day detection lead time on a confirmed past failure at your facility, their models are not calibrated to your gearbox geometries and operating profiles. This retrospective test takes one meeting and tells you everything about whether the system will perform in your environment.
Principal Reliability Engineer — Heavy Industrial Rotating Equipment14 Years, 140+ AE Gearbox Deployments — CMRP Certified, PE Licensed
Heavy Industry Gearbox Reliability
iFactory Acoustic Emission Monitoring — From Micro-Crack to Work Order in Under 60 Seconds
From 50-micron subsurface crack detection to severity-ranked CMMS work orders, iFactory's AE gearbox monitoring platform closes the frequency gap that conventional vibration monitoring cannot bridge — detecting gear tooth damage at the initiation stage where a planned repair costs 47 times less than a catastrophic failure event.
100 kHz–1 MHz continuous AE monitoring with load normalization
Four-stage gear damage classification with RUL projection
Automated severity-ranked work orders to SAP PM, Maximo, and Infor EAM
Under 3% false alarm rate — production-tuned baselines per gearbox
AE monitoring is applicable to all parallel-shaft, helical, bevel, and planetary gearboxes in industrial service — from small 50 kW conveyor drives to large 5 MW mill drive gearboxes. The technique is particularly valuable on high-consequence gearboxes where catastrophic failure causes extended production loss or safety risk: rolling mill drives, kiln drives, compressor gearboxes, wind turbine main gearboxes, large pump drive gearboxes, and crusher or mill gearboxes. The primary requirement is accessible housing surface for sensor mounting within 300 mm of the target gear mesh zone. Contact iFactory for a suitability assessment on your specific gearbox fleet.
Industrial environment noise rejection is one of the primary challenges in AE monitoring, and iFactory addresses it through three layers of signal conditioning. First, hardware bandpass filtering eliminates frequencies below 100 kHz at the sensor pre-amplifier, rejecting structural vibration and low-frequency mechanical noise that would otherwise swamp the AE signal. Second, the edge AI applies source location algorithms using multiple sensor arrival times to confirm that detected AE events originate from the gear mesh zone rather than from external noise sources. Third, the load-normalized baseline model treats normal gear mesh AE as the dynamic background reference, detecting deviations from that background rather than from an absolute threshold. In high-noise environments such as steel mill gearboxes adjacent to rolling stands, iFactory routinely achieves signal-to-noise ratios sufficient for micro-crack detection.
Yes — and the combination produces better outcomes than either technology alone. Vibration monitoring confirms developing faults after the crack has grown to a stage detectable in the gear mesh frequency spectrum, providing independent confirmation of AE-flagged conditions. Oil analysis debris trending tracks material loss progression and confirms that AE-detected crack propagation is generating measurable wear products. iFactory's platform ingests vibration, oil analysis, and AE data simultaneously, correlating all three signals in a single gearbox health dashboard that provides corroborating evidence for maintenance decisions and reduces the probability of both missed alarms and false positives beyond what any single technology achieves independently.
Hardware installation — sensor mounting, cabling, and edge node commissioning — typically takes 4 to 8 hours per gearbox with no production stoppage required. The platform begins acquiring AE data immediately after installation. The baseline establishment period of 14 to 21 operating days is required before the load-normalized anomaly detection becomes fully reliable, though the system flags any AE events above preliminary thresholds from day one. For gearboxes with existing AE or vibration data, iFactory can retrospectively apply the detection algorithm to historic data to demonstrate what the system would have detected on past events before baseline establishment completes. Most facilities have full production-ready monitoring with reliable severity scoring on all installed gearboxes within 30 days of hardware installation.
For a single high-consequence industrial gearbox, the complete iFactory AE monitoring system — sensors, signal conditioning hardware, edge processing node, cabling, and installation — runs $6,000 to $14,000 depending on sensor count and gearbox complexity. Annual software subscription covering AE analytics, CMMS integration, severity-ranked alerts, and RUL modeling runs $4,800 to $9,600 per gearbox. For a fleet of 8 to 20 gearboxes, volume pricing reduces per-unit costs by 25 to 40%. At the $420,000 average annual fleet savings reported at comparable facilities — primarily from avoided catastrophic failure events at $180,000 to $650,000 each — most installations achieve full cost recovery from the first prevented catastrophic failure, with fleet-wide payback periods of 4 to 8 months. Contact iFactory for a site-specific cost and ROI estimate based on your gearbox count and current failure history.
Conclusion
Acoustic emission testing fills the detection gap that costs heavy industry hundreds of millions of dollars annually in catastrophic gearbox failures — the gap between when a micro-crack initiates and when conventional monitoring detects it. iFactory's AE gearbox monitoring platform closes that gap by detecting sub-surface cracks at 50 to 200 microns, classifying damage progression through a four-stage model, and automatically generating severity-ranked CMMS work orders that convert emergency repairs into planned interventions at 47 times lower cost.
The platform deploys in hours per gearbox, establishes reliable baselines within 30 days, and integrates with your existing CMMS and vibration monitoring programs without disrupting current maintenance workflows. The gearboxes on your facility that are currently generating micro-crack AE pulses at Stage 1 or Stage 2 are not visible to any other monitoring technology in your current stack. Book a demo to find out which ones they are.