Blaine fineness is the single most influential quality parameter in cement grinding operations — determining compressive strength development, water demand, setting characteristics, and market-grade classification simultaneously. Yet in most cement plants, fineness is controlled reactively: an operator adjusts separator speed after a lab result arrives 45–90 minutes after the fact, then waits another cycle to see whether the correction was sufficient. The result is a grinding circuit that perpetually chases specification rather than holding it. Consistent Blaine fineness control — achieved through a combination of separator calibration, real-time monitoring, and process discipline — is both a quality imperative and a direct path to energy savings. Every 100 cm²/g of unnecessary excess fineness above specification represents approximately 1.5–2.0 kWh/tonne of avoidable electrical waste. At scale, that is significant margin, recoverable immediately with the right monitoring infrastructure in place.
What Is Blaine Fineness and Why Does It Define Cement Quality?
Blaine fineness — measured as specific surface area in cm²/g (or m²/kg in the SI system) using the Blaine air permeability method (IS 5516, EN 196-6, ASTM C204) — quantifies the total surface area of cement particles available to react with water during hydration. Higher fineness means more surface area, faster hydration, higher early strength, and faster setting times. Lower fineness means slower strength development, reduced water demand, and typically lower early-age compressive strength results.
The relationship is not linear. Excessively high fineness beyond the optimum for a given cement type creates its own problems: increased water demand that requires higher water-cement ratios for workability, greater susceptibility to shrinkage cracking, and a significant increase in grinding energy consumption that erodes production economics. Request a fineness control assessment to understand where your plant's Blaine variability is highest and what it is costing you per tonne.
Blaine Fineness Standards by Cement Grade: What Your Grinding Target Means
Different cement grades and standards define different minimum Blaine fineness requirements. The table below summarizes typical fineness targets and their quality implications — the basis for setting separator and mill parameters in each grinding campaign. Understanding the specification range (not just the minimum) is critical: grinding to minimum specification wastes nothing, but grinding to a conservative internal target 200–300 cm²/g above minimum specification wastes significant electrical energy in every tonne produced.
| Cement Grade / Type | Standard | Min Blaine (cm²/g) | Typical Plant Target | Key Strength Implication |
|---|---|---|---|---|
| OPC 43 Grade | IS 8112 | 2250 | 3000–3400 | 43 MPa at 28 days (min) |
| OPC 53 Grade | IS 12269 | 2250 | 3400–3800 | 53 MPa at 28 days (min) |
| PPC (Portland Pozzolana) | IS 1489 Part 1 | 3000 | 3200–3600 | 33 MPa at 28 days (min) |
| PSC (Portland Slag) | IS 455 | 4000 | 4000–4400 | 33 MPa at 28 days (min) |
| SRC (Sulphate Resistant) | IS 12330 | 2250 | 3000–3400 | C3A <5%, low heat |
| White Cement (WPC) | IS 8042 | 3200 | 4000–4800 | High brightness, early strength |
Particle Size Distribution: What the Bell Curve Tells Your Mill Operator
Blaine fineness is a single-point summary of a complex particle size distribution (PSD). Two cement samples with identical Blaine fineness can have very different PSD profiles — and therefore different strength development rates, water demands, and performance characteristics. Understanding PSD shape, not just the Blaine number, is what separates reactive quality control from truly controlled grinding. The chart below shows a representative PSD for well-controlled OPC versus over-ground OPC — where the peak has shifted left (toward finer particles) and the proportion of ultrafine particles (<3μm) has increased, raising water demand without further strength benefit.
Over-ground cement shows a leftward peak shift with elevated ultrafine fraction (<5μm) — increasing water demand and energy consumption without proportional strength benefit.
Key Factors Affecting Blaine Fineness in Cement Grinding Operations
Blaine fineness in a cement grinding circuit is the output of multiple interacting process variables. Changing any one of them shifts the fineness result, which is why sustainable fineness control requires systematic understanding of the full interaction map — not just adjusting separator speed when the lab reports an out-of-spec result. Book a demo to see how iFactory maps fineness sensitivity to individual process variables in your specific grinding configuration.
Dynamic Separator Rotor Speed
Separator rotor speed is the primary control variable for Blaine fineness in circuits equipped with dynamic (third-generation) separators. Higher rotor speed increases centrifugal force on particles, returning more coarse particles to the mill and increasing product fineness. The relationship between rotor RPM and Blaine is approximately linear within the operating range, but the slope depends on separator feed loading and mill ventilation airflow — variables that iFactory tracks continuously to make the relationship predictable and exploitable.
Mill Ventilation Airflow Rate
Mill ventilation airflow controls both the transport of fines out of the grinding chamber and the effective cut size of the air classifier. Insufficient airflow causes over-grinding as material remains in the mill too long. Excessive airflow increases coarse material bypass and reduces separator efficiency. In ball mills, mill outlet temperature and mill differential pressure are the key indicators of ventilation adequacy — parameters that iFactory monitors in real time as fineness proxies.
Grinding Media Charge and Condition
The mass, size distribution, and wear condition of grinding balls directly determines the grinding efficiency at any given specific power input. Depleted grinding media charge reduces fineness at constant separator settings, misleading operators into compensating via separator adjustment when the root cause is mechanical. Tracking specific electrical consumption per unit of Blaine produced — available in iFactory's mill analytics module — flags grinding media degradation before it becomes a quality problem.
Feed Rate, Clinker Temperature, and Additives
Clinker grindability varies with temperature and mineral composition — hot clinker (above 80°C) is harder to grind and produces coarser product at constant settings. Mill feed rate affects residence time and therefore fineness; higher feed rates produce coarser product. Addition rates of fly ash, slag, or gypsum change the grinding dynamics significantly, with fly ash increasing fineness and slag typically reducing it. iFactory correlates fineness results with all these input variables to identify the dominant causes of fineness excursions in your specific mill configuration.
Separator Tuning: How Rotor Speed and Airflow Drive Fineness Control
The dynamic separator is the precision fineness control instrument in modern cement grinding circuits. Its operating point — defined primarily by rotor speed and secondary air flow — determines the cut size of the classification process and therefore the Blaine fineness of the product. The column chart below illustrates how separator rotor speed settings (at constant airflow) translate to Blaine fineness outcomes in a typical closed-circuit ball mill grinding OPC 53 Grade. Understanding this curve for your specific separator model, at your feed loading, is the foundation of systematic fineness control.
Low speed
Typical
High speed
Values are indicative. The specific RPM-to-Blaine curve for your plant must be calibrated with at least 20 matched data points capturing separator speed, mill load, ventilation, and Blaine result simultaneously. iFactory automates this calibration correlation continuously.
Common Fineness Problems in Cement Grinding — and Their Root Causes
Persistent fineness problems in cement grinding operations are almost always systematic, not random. Each failure mode has a characteristic data signature that, when captured continuously, becomes predictable and preventable. The following are the most frequently encountered fineness quality problems in operating cement mills, with their root causes and the corrective action framework that iFactory supports with real-time process data. Talk to our engineers about how we configure fineness deviation alerts for your specific cement grade slate.
Persistently High Blaine — Overgrinding
Symptom: Blaine fineness consistently 200–400 cm²/g above grade specification. Root causes: conservatively high separator rotor speed setpoints, excessive specific power input due to depleted grinding media charge, or low mill throughput rate relative to installed power. Corrective action: validate the RPM-to-Blaine curve for current mill conditions, reduce rotor speed setpoint in 20 RPM increments while monitoring strength development, and cross-check specific electrical consumption to identify media charge depletion as a contributing factor. iFactory flags overgrinding episodes automatically using the grade-specific Blaine upper control limit.
High Fineness Variability — Inconsistent Quality
Symptom: Blaine fineness fluctuating ±300–500 cm²/g around target within a single shift. Root causes: unstable mill feed rate due to inconsistent clinker extraction, variations in gypsum or additive addition rate, mill ventilation fluctuations from dirty bag filters, or manual separator adjustment based on irregular lab sample timing. Corrective action: stabilize feed rate with level-controlled extraction, automate gypsum dosing, schedule filter cleaning during planned maintenance, and implement statistical process control (SPC) charting for fineness — available natively in iFactory.
Low Blaine at Specification Limits — Quality Risk
Symptom: Blaine result approaching or below minimum specification for the grade — creating product release risk and potential for customer complaints. Root causes: sudden increase in mill feed rate, clinker with unusually low grindability (high free lime, dense nodulization), separator bypass or mechanical damage reducing classification efficiency, or process upset causing mill throughput spike. Corrective action: reduce mill feed rate, check separator mechanical condition, verify clinker quality from the kiln, and establish automated product hold alerts when Blaine approaches the lower control limit — a standard iFactory alert configuration.
Grade Changeover Fineness Excursion
Symptom: Extended off-specification production period during transition from one cement grade to another — for example, switching from OPC 43 to OPC 53, or from OPC to PPC. Root causes: delayed separator setpoint change, residual product mixing in silos and transport systems, and absence of a validated changeover procedure with confirmed sample collection timing. Corrective action: develop grade-specific separator setpoint tables (available in iFactory's product configuration module), enforce confirmed fineness testing before rerouting product to grade silo, and track changeover loss per event.
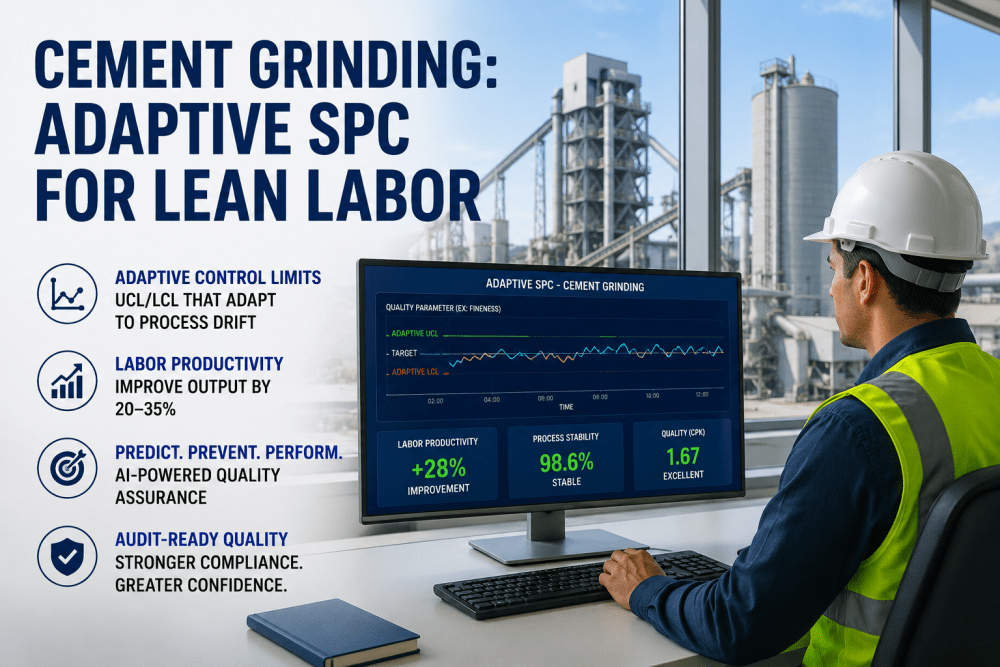
How iFactory's Platform Delivers Automated Blaine Fineness Control
Manual fineness control — a lab result arriving 60 minutes after sample collection, reviewed by a process engineer who then calls the mill operator to adjust separator speed — is a 1990s workflow being applied to 2020s quality demands. Cement customers today require tighter grade-to-grade consistency, more comprehensive test documentation, and faster quality release confirmation. Meeting those requirements with manual workflows requires unsustainable levels of manual effort. iFactory eliminates the lag by connecting quality data to process decisions in real time.
iFactory integrates directly with your in-line or laboratory Blaine measurement equipment, capturing fineness results as they are produced and immediately correlating them against the real-time process state — separator speed, mill power draw, feed rate, and ventilation airflow — at the moment the sample was taken. This correlation map, built automatically over weeks of operation, gives your process engineers the evidence to identify exactly which process variables are driving fineness excursions and predict fineness drift before it crosses a specification limit. No general-purpose analytics platform offers this level of cement grinding process integration out of the box.
Implementing Consistent Fineness Control: A 5-Phase Approach
Moving from reactive fineness management to systematic, data-driven fineness control is a structured implementation process. The following phases apply to any cement grinding circuit — ball mill, vertical roller mill, or horizontal roller press hybrid — and have been validated across multiple cement plant configurations where iFactory has been deployed. Schedule a consultation to build a fineness control roadmap specific to your mill type and grade portfolio.
Baseline Fineness Variability Assessment
Collect a minimum of 6–8 weeks of matched Blaine fineness and process parameter data to establish baseline fineness variability by grade. Calculate Cpk (process capability index) for each cement grade — a Cpk above 1.33 indicates capable fineness control; below 1.0 indicates a systematic control problem. Map fineness variability against time of day, shift pattern, and process variable changes to identify the dominant sources of inconsistency. This assessment is the foundation of every subsequent control improvement.
Separator Calibration and RPM-to-Blaine Curve Development
For each cement grade, develop a validated separator rotor speed versus Blaine fineness response curve under representative mill conditions. Conduct controlled tests varying rotor speed in 50 RPM increments with 3 matched samples per setpoint. Document the curve with confidence intervals and define the operating setpoints for target Blaine center and upper/lower control limits per grade. Update the curve quarterly or after any significant changes to mill feed composition or grinding media charge.
Real-Time Fineness Monitoring Deployment with iFactory
Deploy iFactory's quality monitoring module to capture Blaine fineness results in real time, correlate them with continuous process parameters (separator speed, mill kW, feed rate, temperature), and activate automated deviation alerts when results approach control limits. Configure SPC charts (X-bar, R-chart) for fineness by grade to replace manual Excel-based quality tracking. Establish automated product hold and release logic integrated with your silo routing system.
Grade-Specific SOPs and Operator Training
Develop standard operating procedures for each cement grade that specify separator setpoints, sampling frequency requirements, deviation response actions, and changeover protocols. Train mill operators on the RPM-to-Blaine response curve for each grade, the significance of SPC control limit breaches, and the escalation procedure for persistent deviation. Standardize procedures are the mechanism that sustains fineness control improvements through shift and personnel changes.
Monthly Fineness KPI Review and Continuous Refinement
Conduct monthly fineness quality reviews using iFactory's fineness performance reports — tracking Cpk by grade, overgrinding frequency, fineness-related product holds, and energy consumption per unit of Blaine achieved. Use these reports to identify the next round of improvement opportunities (media top-up timing, ventilation filter maintenance, separator wear inspection intervals) and refine separator setpoints as mill conditions evolve. Continuous refinement, not one-time calibration, is what separates best-in-class fineness control from adequate fineness control.
What Cement Grinding Teams Are Saying About iFactory
Our OPC 53 Grade Blaine fineness was running at an average of 3820 cm²/g against a target of 3500 — we were systematically overgrinding by over 300 units because operators were always erring on the high side to stay out of trouble. With iFactory's real-time dashboard and automatic SPC alerts, we could see fineness developing in near-real-time and make separator corrections proactively. Within four months we had reduced our average fineness to 3530 cm²/g — within 30 units of target — and our mill electrical consumption dropped by 2.7 kWh per tonne. That's a saving we measure every month now.
Frequently Asked Questions: Cement Blaine Fineness Control
What is a good Blaine fineness for OPC 53 Grade cement?
The IS 12269 standard for OPC 53 Grade specifies a minimum Blaine fineness of 2250 cm²/g, but virtually no cement plant grinds to this minimum in practice. Typical operational targets for OPC 53 Grade are 3400–3800 cm²/g, balancing strength performance requirements (53 MPa at 28 days) with grinding energy efficiency. World-class plants operating with tight fineness control target a setpoint of 3500 cm²/g with a ±50 cm²/g standard deviation — delivering specification compliance without systematic overgrinding above the upper control limit.
How does separator rotor speed affect Blaine fineness in a closed-circuit ball mill?
In a closed-circuit ball mill with a dynamic (third-generation) separator, increasing rotor speed raises the centrifugal force on particles in the separator zone, causing more particles to be rejected as tailings back to the mill feed. This increases the proportion of fine particles passing through to the product, raising Blaine fineness. The relationship is approximately linear within the normal operating range (700–1400 RPM for typical separators), with a typical sensitivity of 200–350 cm²/g per 100 RPM increment depending on separator design, feed loading, and airflow rate.
What is the energy cost of overgrinding in cement production?
Each 100 cm²/g of excess Blaine fineness above the target specification consumes approximately 1.5–2.0 additional kWh per tonne of cement produced, depending on grinding circuit type (ball mill, VRM, roller press) and clinker grindability. In a plant producing 3000 tonnes per day and running 250 cm²/g above optimal specification, the avoidable electrical waste is approximately 4,500–7,500 kWh per day. Over a full year at typical Indian industrial electricity tariffs, this represents a substantial and fully recoverable energy cost that iFactory's fineness monitoring quantifies in real time.
Can iFactory integrate with online Blaine or PSD analyzers?
Yes. iFactory is designed to integrate with both laboratory Blaine measurement instruments and in-line or cross-belt particle size analyzers from major suppliers. Laboratory results are typically captured via LIMS integration or direct instrument data connection with a 2–5 minute result reporting latency. In-line PSD analyzers (gamma-ray or laser diffraction-based) can feed results to iFactory in real time for continuous process correlation. For plants without in-line analyzers, iFactory's process proxy model estimates fineness from separator speed, mill power, and feed rate parameters while awaiting lab confirmation.
How often should Blaine fineness be sampled during a grinding campaign?
For best-in-class fineness control, Blaine fineness should be measured on a minimum 2-hour frequency during normal production, with increased frequency during product grade changeovers (every 30–60 minutes) and after any significant process adjustment (separator speed change, feed rate change, or mill restart). In plants with in-line PSD analyzers, near-continuous measurement eliminates the sampling frequency debate. iFactory tracks sample frequency compliance and alerts when the sampling interval exceeds the configured maximum — ensuring quality monitoring discipline is maintained across all shifts.
What is the difference between Blaine fineness and 45-micron sieve residue as quality indicators?
Blaine fineness measures total specific surface area (cm²/g) using air permeability and is most sensitive to the fine particle fraction of the distribution. The 45-micron (No. 325) sieve residue measures the coarse fraction of the PSD — particles that pass through a 45-micron sieve are expressed as a percentage retained. For cement quality control, Blaine fineness is the primary specification parameter in most standards, but sieve residue provides complementary information particularly relevant to strength development and reactivity. High Blaine with high sieve residue indicates a bimodal PSD — a mix of very fine and very coarse particles — that iFactory's PSD correlation tracks distinctly.
How does hot clinker affect fineness control in cement grinding?
Clinker entering the mill at temperatures above 80–90°C creates multiple fineness control challenges. Hot clinker increases mill internal temperature, accelerating gypsum dehydration (converting gypsum to hemihydrate or anhydrite) — which affects cement setting behaviour independently of fineness. Higher clinker temperatures also reduce grinding efficiency by promoting coating of grinding media and mill internals, requiring higher specific power input to achieve the same fineness. iFactory tracks mill outlet temperature, mill feed clinker temperature (where sensors are available), and correlates these with fineness drift to flag hot clinker episodes before they cause specification excursions.
What SPC tools does iFactory provide for fineness quality control?
iFactory's quality analytics module includes industry-standard statistical process control charts specifically configured for cement quality parameters. For Blaine fineness, the platform generates Individuals and Moving Range (I-MR) charts for continuous fineness monitoring, calculates real-time Cp and Cpk indices by cement grade with upper and lower control limits set at ±2σ and ±3σ, tracks specification exceedance frequency by grade, and generates automated alerts when fineness breaches the upper or lower control limit for the current production grade. All SPC charts are exportable in both digital and PDF formats for quality documentation and external audit use.