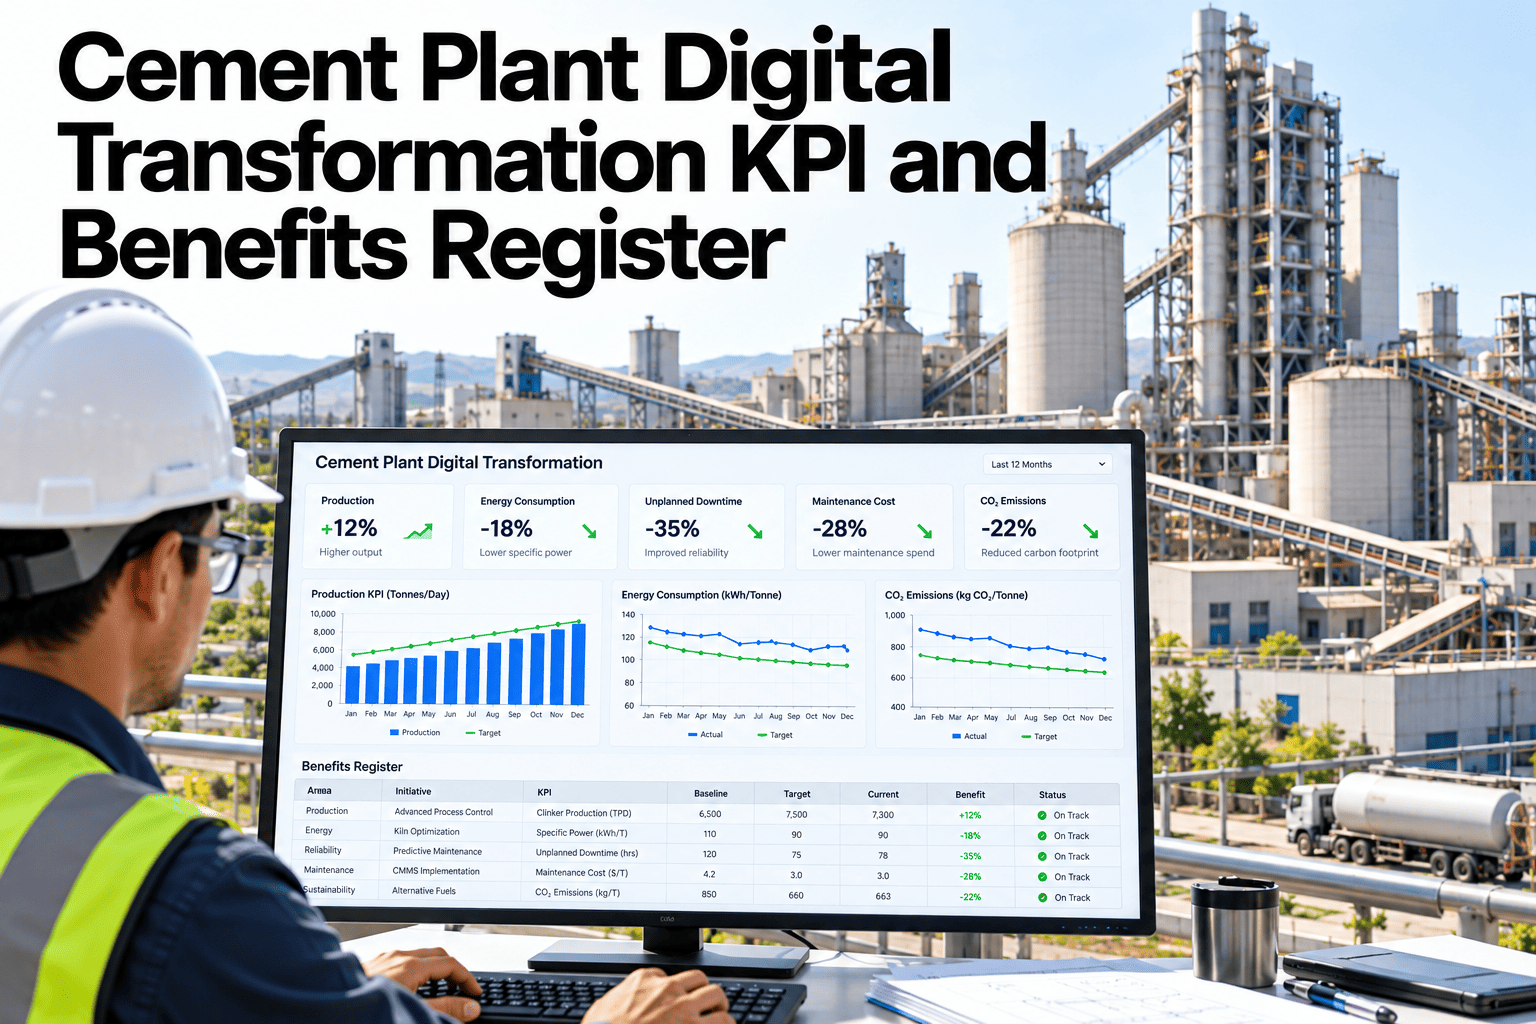
A cement plant digital transformation program that cannot show its financial results within twelve months of go-live is a program that will be defunded. The benefits register is the management tool that prevents this outcome — by defining what will be measured before the program begins, assigning KPI ownership to specific roles, specifying the evidence source for each benefit claim, and scheduling the review cadence that keeps leadership informed and investment justified. Without a register, claimed benefits cannot be distinguished from noise in the production data. With one, the program builds a documented case that survives budget cycles and leadership changes. iFactory AI provides the operational data that populates the register's evidence column. Discuss how to structure the KPI register for your cement plant program.
Cement Plant Digital Transformation KPI and Benefits Register
Baseline definitions, KPI ownership, benefit calculation, evidence source, review cadence, and realization status — the management framework that makes digital investment accountable.
Part 1 — Baseline Definitions
The baseline is the most important entry in the benefits register and the most frequently neglected. Without a clear pre-program baseline, any result can be claimed as improvement and any poor result can be blamed on external factors.
Part 2 — KPI Register Template
The register covers production, energy, maintenance, and digital adoption KPIs with their baseline value, target, evidence source, and current realization status.
| KPI | Baseline Value | Target | Owner | Evidence Source | Review Cadence |
|---|---|---|---|---|---|
| Unplanned downtime hours/month | Enter baseline | 30–50% reduction | Maintenance Lead | CMMS work order log | Monthly |
| Specific heat consumption (MJ/t clinker) | Enter baseline | 3–5% reduction | Process Engineer | DCS historian + fuel meter | Monthly |
| Electrical energy (kWh/t cement) | Enter baseline | 4–8% reduction | Energy Manager | Power meter / billing data | Monthly |
| Free lime variance (σ) | Enter baseline | Cpk improvement to 1.33 | Process Engineer | Lab results / DCS | Monthly |
| Planned vs. unplanned maintenance ratio | Enter baseline | Target 70:30 or better | Maintenance Lead | CMMS work order classification | Quarterly |
| Operator adoption rate (%) | 0% at go-live | 80%+ within 6 months | Digital Lead | iFactory AI dashboard usage log | Monthly |
| Model prediction accuracy (%) | Established at validation | Maintain validated level | Digital Lead | iFactory AI model monitoring | Monthly |
Part 3 — Benefit Calculation
Each KPI improvement must be converted to a financial figure using a documented calculation method that is agreed before the program begins — not constructed after the result is known.
Build the Benefits Register Your Cement Program Needs
iFactory AI provides the operational data, model performance metrics, and adoption tracking that populate the evidence column of your benefits register automatically. Book a session to map the register to your program's KPIs.
Part 4 — Review Cadence and Benefit Realization Status
The review cadence converts the register from a document into a management process. Benefit realization status tracks where each KPI stands against its target at each review point.
Frequently Asked Questions
How should confounding factors be handled in the benefit calculation — for example, a kiln major repair that happened during the measurement period?
Confounders — major repairs, raw material quality shifts, production rate changes, and energy price movements — must be documented and, where material, excluded or normalized from the benefit calculation. The register should include a confounders log updated at each review, so the program leadership can distinguish AI-driven improvements from external factors. Where a confounder cannot be cleanly excluded, a sensitivity range is more defensible than a single point estimate. Walk through confounder handling for your specific program in a session.
Who should own the benefits register — the digital team or the finance function?
Joint ownership is the most robust structure. The digital team owns the technical evidence — model performance, adoption metrics, and operational KPI data from iFactory AI. The finance function owns the financial translation — converting operational improvements to monetary value using the company's accounting standards. Joint ownership at the quarterly review prevents both over-claiming by the digital team and under-crediting by finance. Ask how iFactory AI exports KPI data for finance review.
How often should the benefits register be reviewed at steering level?
Steering-level review quarterly is standard for an active digital transformation program. Monthly operational reviews by the plant digital lead and KPI owners ensure issues surface before the quarterly steering meeting, so steering receives a summary with issues already analyzed rather than raw data to interpret. The register should be a live document updated monthly, not a report prepared for the quarterly meeting alone.
What is a realistic timeline to see benefits register entries move from "on track" to "achieved" in a cement plant program?
Maintenance and downtime KPIs typically show measurable movement within three to six months as predictive alerts begin replacing reactive responses. Energy and quality KPIs take longer — six to twelve months — because the signal needs to be distinguished from seasonal variation and feed chemistry changes. The benefits register structure supports this by requiring three consecutive positive measurement periods before a benefit is formally realized, preventing premature claims from seasonal or one-off effects. Discuss realistic benefit timelines for your plant's specific use cases.
Can the register be used across multiple cement plants in a group comparison?
Yes, and cross-plant comparison is one of the most valuable applications of a standardized register. When all plants use the same KPI definitions, baseline methodology, and calculation rules, the group can identify which plants are realizing benefits fastest and why — and replicate the practices that are working from leading plants to those that are trailing. This requires the register to be maintained at group level with plant-level entries visible to the program steering function, not siloed within each plant's reporting.
Make Your Cement Digital Investment Accountable
iFactory AI supplies the operational evidence that drives every KPI in the benefits register — from downtime hours to model accuracy to adoption rate. Book a session to align the register structure with your program's scope.