The cement industry stands as one of the most energy-intensive sectors globally, consuming approximately 12-15% of total industrial energy use. A rigorous energy audit is not merely a regulatory checkbox but a strategic imperative for plant managers and CTOs aiming to reduce operational costs, enhance sustainability, and comply with evolving environmental standards. This comprehensive guide delves into the technical nuances of conducting a full-scale energy audit in a cement plant, covering thermal and electrical systems with precision. From pre-audit planning to data collection protocols, measurement instruments, and audit report templates, we provide an authoritative framework rooted in industry best practices. Whether you are optimizing a pyroprocessing line or modernizing a grinding station, these methodologies will empower your team to identify inefficiencies and drive actionable improvements. For a tailored assessment of your plant's potential, Book a Demo with our experts today.
Unlock Your Plant's Energy Efficiency
Discover hidden savings and reduce your carbon footprint with our AI-driven audit solutions.
Understanding Cement Plant Energy Consumption
Cement production involves complex processes—raw material extraction, crushing, grinding, blending, preheating, calcination, clinker cooling, and finish grinding—each with distinct energy demands. Thermal energy, primarily from fossil fuels like coal and petcoke, dominates the kiln system, accounting for about 90% of total thermal consumption. Electrical energy powers motors, fans, compressors, and conveyors, with grinding operations alone consuming up to 60% of electrical load. A comprehensive audit must therefore evaluate both energy forms separately, using tailored data collection protocols and measurement instruments to capture real-time consumption patterns. Understanding these baselines is essential for benchmarking against industry standards such as the Cement Sustainability Initiative (CSI) or the Best Available Techniques (BAT) reference documents.
Key Energy Metrics in Cement Production
Thermal Energy Intensity
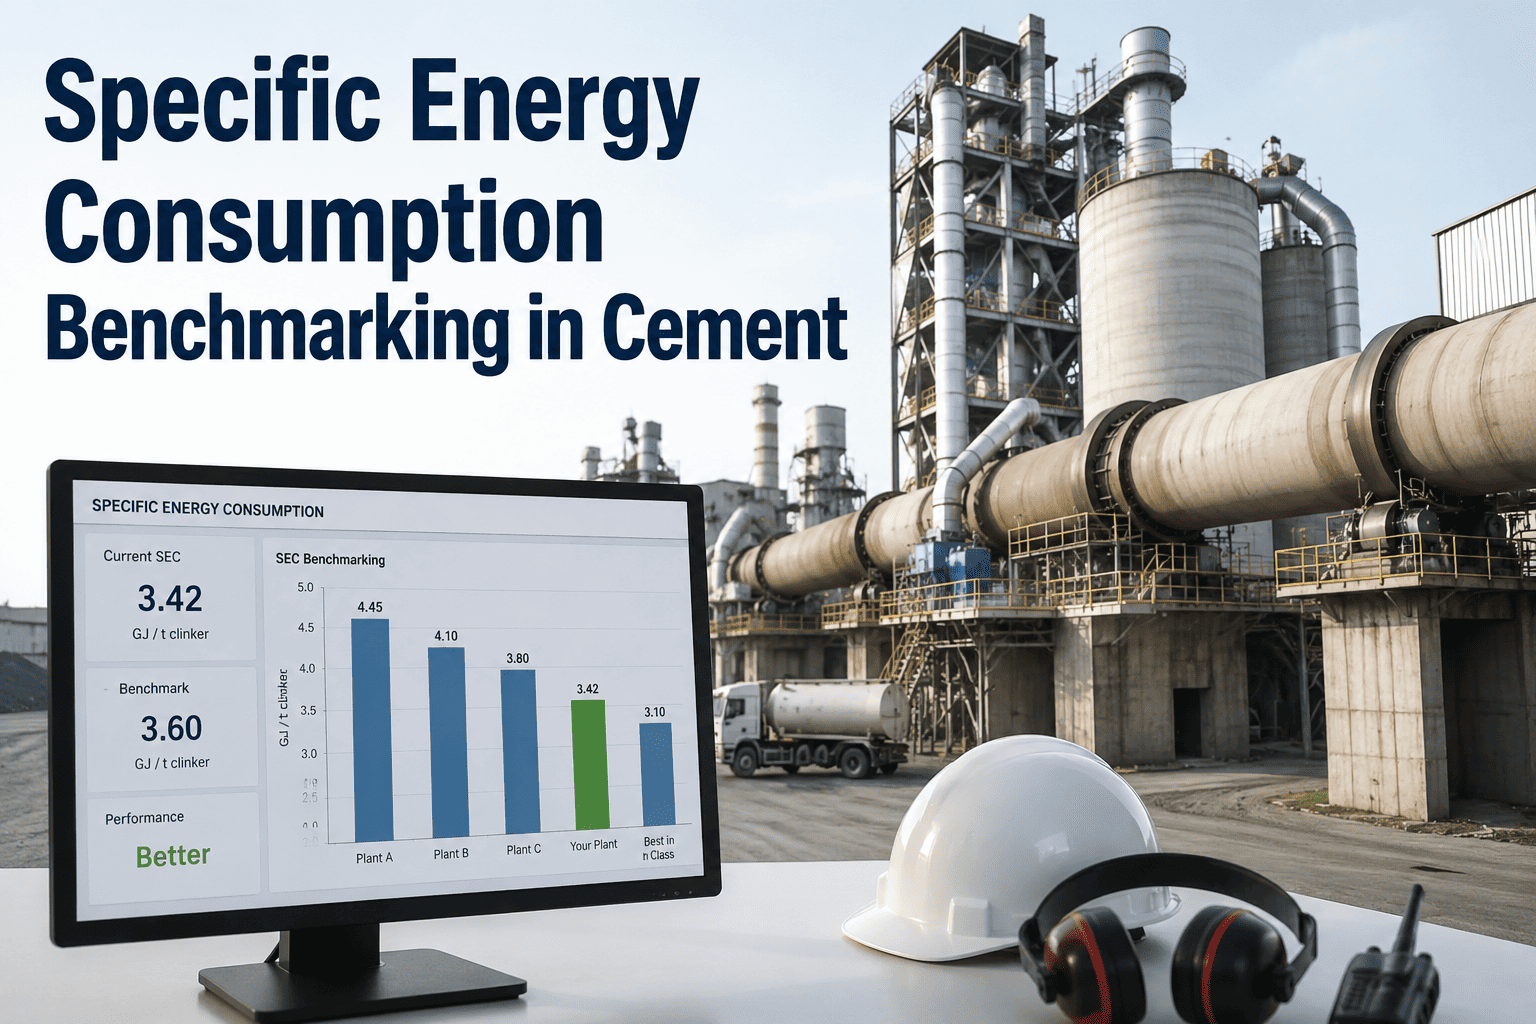
Measured in GJ per tonne of clinker, typical values range from 3.0 to 4.5 GJ/t, depending on raw material moisture, kiln type, and fuel quality. Preheater and precalciner systems offer lower intensities than wet or long dry kilns.
Electrical Energy Intensity
Expressed in kWh per tonne of cement, this metric varies from 90 to 130 kWh/t. Grinding, both raw and finish, contributes the largest share, followed by material transport and ventilation.
Power Factor
A low power factor indicates inefficient electrical usage, often corrected with capacitor banks. Audits should measure power factor at main substations and key motor control centers.
Specific Energy Consumption
This metric combines thermal and electrical inputs per unit of product. Advanced plants track it in real-time using SCADA systems, enabling immediate anomaly detection.
Pre-Audit Planning Phase
Step 1: Define Scope and Objectives
Determine whether the audit covers the entire plant or specific sections (e.g., kiln, mills). Set clear goals such as reducing thermal energy by 5% or identifying 10% electrical savings.
Step 2: Assemble Audit Team
Include process engineers, electrical engineers, maintenance personnel, and an external energy consultant. Assign roles for data collection, instrument handling, and analysis.
Step 3: Collect Background Data
Gather plant layout diagrams, single-line electrical drawings, process flow sheets, historical energy bills, and production logs. This data informs the measurement plan.
Step 4: Select Measurement Instruments
Choose instruments based on accuracy requirements, such as ultrasonic flow meters for fuel, thermocouples for temperature, and power analyzers for electrical parameters.
Essential Measurement Instruments for Cement Audits
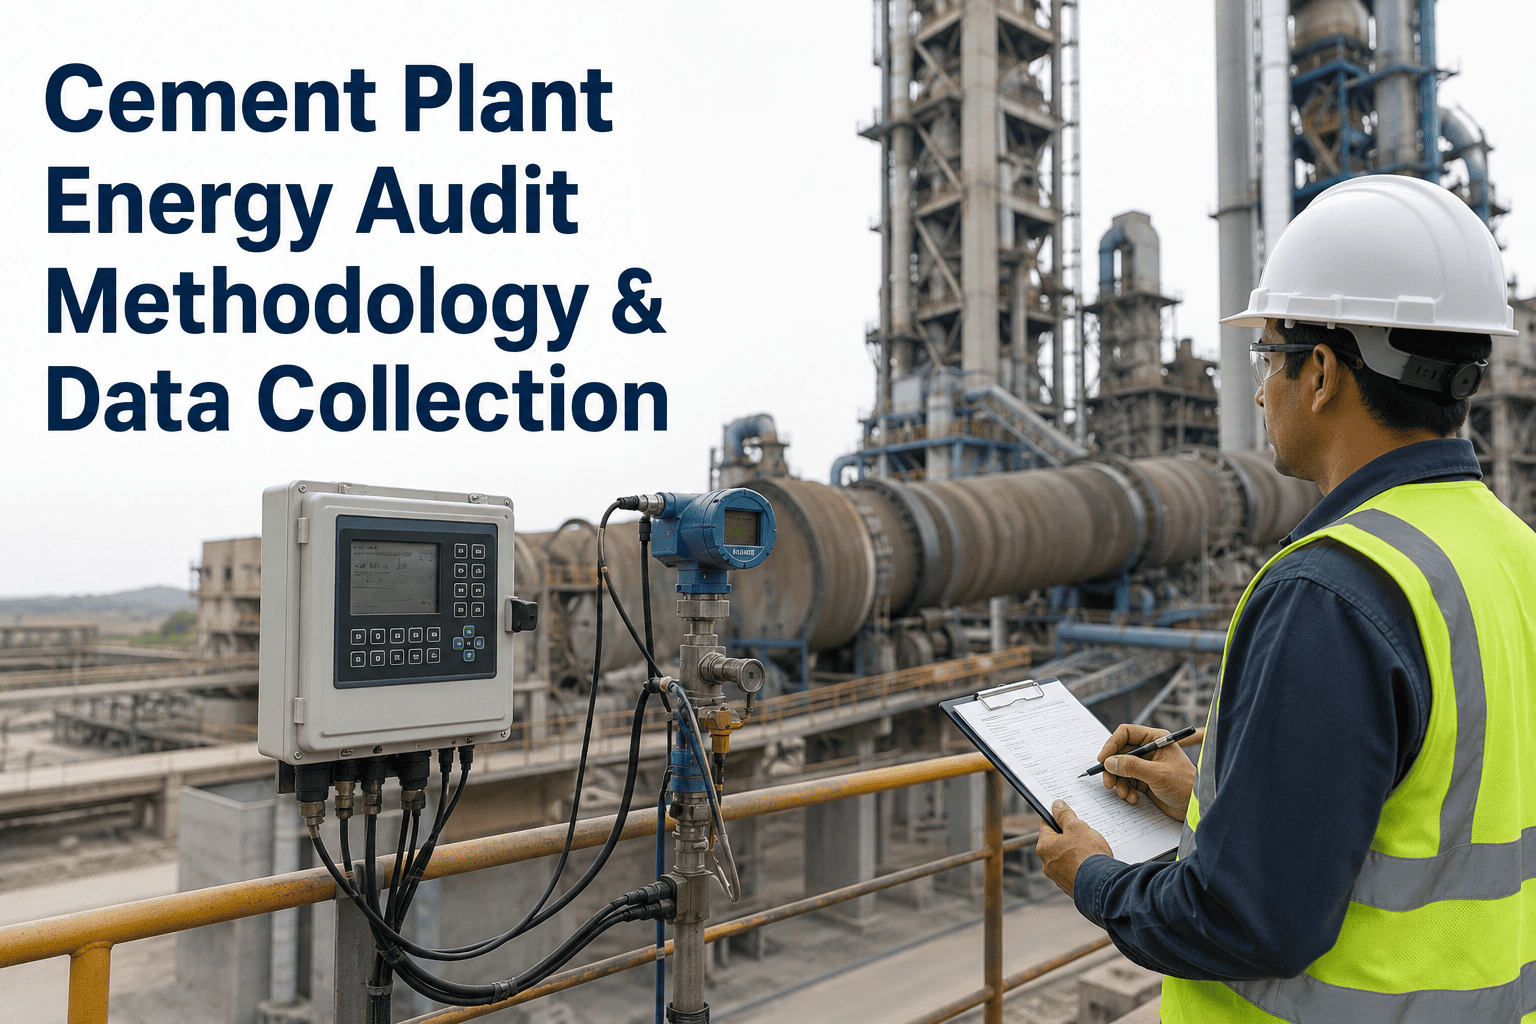
Accurate data collection relies on calibrated instruments. For thermal audits, use portable flue gas analyzers to measure O2, CO, and NOx levels in preheaters and kiln stacks. Infrared thermography cameras identify heat losses through refractory linings and ductwork. Ultrasonic flow meters measure coal and petcoke flow rates without process interruption. For electrical audits, three-phase power analyzers capture voltage, current, power factor, and harmonic distortion at motor control centers. Clamp meters and data loggers record load profiles over 24-48 hours to capture peak demand patterns. All instruments must have traceable calibration certificates to ensure data integrity.
Data Collection Protocols for Thermal Systems
Thermal audits require systematic measurement of fuel consumption, combustion efficiency, and heat losses. Begin by measuring fuel flow rates and calorific values from supplier certificates or on-site analysis. Use thermocouples at key points: preheater inlet/outlet, kiln shell, clinker cooler, and waste heat recovery boiler. Record temperatures every 10 seconds for at least 8 hours of stable operation. Calculate heat balance using standard formulas to identify losses from radiation, convection, and exhaust gases. Monitor oxygen levels in the kiln exit gas to optimize excess air ratios, typically targeting 2-3% O2 for precalciner kilns. Document all data in a standardized log sheet with timestamps and operator notes.
Data Collection Protocols for Electrical Systems
Electrical audits focus on load profiles, power quality, and motor efficiency. Install power analyzers at main incoming feeders and key distribution panels for 24-hour periods. Record voltage, current, power factor, and total harmonic distortion (THD). Use data loggers on major motors (e.g., raw mill, cement mill, kiln drive) to capture start-up currents and steady-state loads. Measure illumination levels in work areas using lux meters to assess lighting efficiency. Compile a motor inventory listing nameplate details, load factors, and operating hours. Calculate energy consumption for each motor using the formula: kWh = (kW × hours). Identify oversized or underloaded motors that can be replaced with high-efficiency models.
Sample Data Collection Template
| Parameter | Instrument | Accuracy | Measurement Point | Frequency |
|---|---|---|---|---|
| Fuel flow rate | Ultrasonic flow meter | ±0.5% | Fuel line to kiln | Continuous |
| Exhaust gas temperature | Type K thermocouple | ±1°C | Preheater outlet | Every 10 sec |
| O2 concentration | Zirconia analyzer | ±0.2% | Kiln exit gas | Every 1 min |
| Motor current | Clamp meter | ±1% | MCC panel | Every 5 min |
| Power factor | Power analyzer | ±0.01 | Main substation | Every 15 min |
| Illuminance | Lux meter | ±5% | Work areas | Spot check |
Thermal Energy Balance Analysis
Conducting a heat balance is fundamental to identifying inefficiencies. The input heat includes fuel combustion, sensible heat of raw materials, and preheated air. Output heat comprises clinker formation heat, exhaust gas losses, radiation losses, and cooling air. A typical balance for a modern precalciner kiln shows that about 30-35% of input heat is lost with exhaust gases, 5-10% through kiln shell radiation, and 5% in clinker cooler exhaust. By comparing actual balances with theoretical values, auditors can pinpoint excessive air infiltration, poor combustion, or inadequate insulation. Use software tools like ASPEN Plus or specialized cement process simulators for detailed modeling.
Electrical Energy Efficiency Opportunities
Common electrical savings include upgrading to high-efficiency motors (IE4 class), installing variable frequency drives (VFDs) on fans and pumps, optimizing compressed air systems, and improving power factor. For example, replacing a standard motor with an IE4 motor can reduce energy losses by 20-30%. VFDs on kiln ID fans can save 25-40% of fan energy by matching speed to demand. Compressed air leaks, if unaddressed, can waste 20-30% of compressor output. Power factor correction capacitors can reduce demand charges and improve system capacity. Each opportunity should be evaluated with a simple payback period calculation, typically 1-3 years for most measures.
Ready to Transform Your Plant?
Our AI-powered audit platform automates data collection and analysis, cutting audit time by 50%.
Structuring the Energy Audit Report
A professional audit report must include an executive summary, methodology, detailed findings, energy balance tables, and prioritized recommendations. Use the following template:
- Executive Summary: 1-2 pages summarizing key findings, total energy consumption, and potential savings.
- Introduction: Plant description, audit scope, and objectives.
- Methodology: Instruments used, measurement points, and data collection period.
- Energy Consumption Analysis: Breakdown by section (kiln, mills, etc.) with graphs and tables.
- Heat and Mass Balance: Detailed calculations and Sankey diagrams.
- Opportunity Identification: List of energy conservation measures (ECMs) with technical details.
- Financial Analysis: Investment costs, energy savings, payback periods, and ROI.
- Conclusion and Recommendations: Action plan with timelines and responsible parties.
Energy Audit Checklist for Cement Plants
Pre-Audit
Obtain plant layout, process flow, and utility bills. Schedule audit dates with plant management.
Thermal Data Collection
Measure fuel flow, exhaust gas composition, temperatures at all stages, and clinker production rate.
Electrical Data Collection
Log voltage, current, power factor for all major loads. Conduct motor inventory and lighting survey.
Analysis
Perform heat balance, electrical load analysis, and identify ECMs. Calculate savings and payback.
Reporting
Draft report with findings, attach raw data, and present to stakeholders. Implement quick wins immediately.
Case Study: Energy Audit in a 5000 TPD Cement Plant
A recent audit at a 5000 tonnes per day plant in India revealed that exhaust gas losses accounted for 35% of thermal input, and motor loads were operating at an average of 65% efficiency. By implementing VFDs on the kiln fan and raw mill fan, the plant reduced electrical consumption by 18%. Replacing worn-out refractory in the preheater reduced shell heat loss by 12%. Total annual savings exceeded $1.2 million with a payback period of 1.8 years. The audit also identified a 5% reduction in clinker factor by using fly ash as a substitute, further lowering energy intensity. This demonstrates the tangible value of a systematic energy audit.
Frequently Asked Questions
What is the typical duration of a cement plant energy audit?
A comprehensive audit typically takes 4 to 6 weeks, including 1-2 weeks of on-site data collection and 2-4 weeks for analysis and reporting. The exact duration depends on plant size, complexity, and availability of historical data. For a 3000 TPD plant, on-site measurements may require 5-7 days with a team of 3-4 engineers. Post-processing and report generation can be expedited using digital tools like iFactory's audit platform, which reduces analysis time by up to 50%. For a customized timeline, Book a Demo with our team.
Which instruments are essential for thermal measurements?
Critical instruments include a flue gas analyzer (for O2, CO, NOx), Type K thermocouples with data loggers, an infrared thermography camera, ultrasonic flow meters for fuel, and a portable hygrometer for moisture content in raw materials. All instruments must be calibrated before use. For accurate heat balance, a gas chromatograph may be needed for fuel composition analysis. iFactory provides integrated IoT sensors that can be deployed temporarily for high-resolution data collection. Learn more about our sensor suite at our support page.
How do you calculate energy savings from an audit?
Savings are calculated by comparing baseline energy consumption (before audit implementation) with post-implementation data, normalized for production volume and ambient conditions. For each ECM, the energy savings are estimated using engineering formulas. For example, savings from a VFD installation = (baseline power - VFD power) × operating hours. Financial savings = energy savings × unit energy cost. Payback period = investment cost / annual savings. It's crucial to account for maintenance costs and equipment life. iFactory's analytics platform automates these calculations and provides real-time tracking. For a detailed methodology, schedule a demo.
What are the common challenges in cement energy audits?
Common challenges include limited access to measurement points (e.g., high-temperature zones), lack of historical data, process variability due to raw material changes, and resistance from plant staff. To overcome these, use remote monitoring tools, engage operators in the process, and plan measurements during stable production periods. Data gaps can be filled with simulation models. iFactory's non-intrusive sensors and cloud-based data platform mitigate many of these issues. Visit our support page for case studies on overcoming audit challenges.
How often should a cement plant conduct an energy audit?
Industry best practice recommends a comprehensive energy audit every 2-3 years, with annual walk-through audits to track progress on implemented ECMs. Plants undergoing major process changes or fuel switches should conduct an audit immediately. Continuous monitoring via an energy management system (EMS) can provide ongoing insights. iFactory's AI platform offers continuous audit capabilities, alerting you to deviations in real-time. To set up a continuous monitoring system, Book a Demo today.
Empower Your Energy Strategy
Transform your cement plant with data-driven insights. Start your energy efficiency journey now.