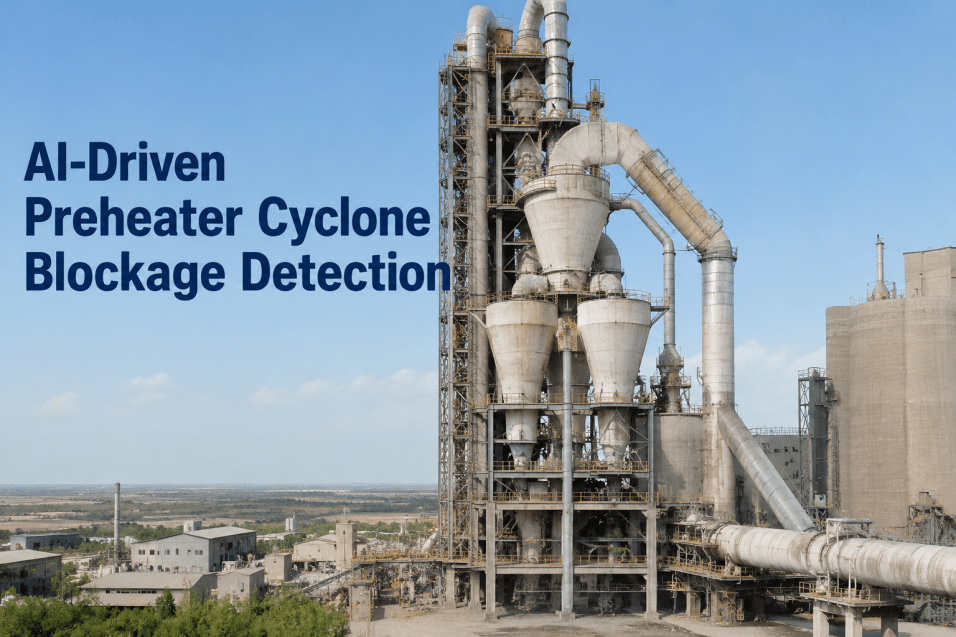
Cement plant preheater towers are among the most thermally stressed systems in industrial manufacturing—and among the least forgiving when things go wrong. A single cyclone blockage can force an unplanned kiln shutdown within hours, costing $50,000 to $200,000 per incident in lost production and emergency labor. Yet most plants still rely on operator walkthroughs, manual temperature logs and reactive clearing procedures that put crews at risk and sacrifice days of output. AI-driven blockage detection changes this calculus entirely. By continuously analyzing temperature gradients and differential pressure profiles across every cyclone stage, modern predictive systems flag developing blockages 2–6 hours before they become critical—giving maintenance teams time to execute planned interventions instead of emergency shutdowns. Book a Demo to know how AI detects cyclone blockage
Why Preheater Cyclone Blockages Are a Top-3 Cement Plant Risk
The preheater tower in a dry-process cement kiln operates at temperatures between 300°C and 900°C across five to six cyclone stages. Raw meal descends through this tower in counter-current contact with hot exhaust gases from the kiln, reaching calcination temperatures before entering the rotary kiln itself. When material builds up and blocks a cyclone cone, riser duct, or downcomer pipe, the entire thermal balance collapses.
Blockage Location
Typical Cause
Time to Shutdown
Avg. Recovery Cost
Stage 1 Cyclone Cone
Sticky raw meal, moisture surge
4–8 hours
$30K–$80K
Stage 3–4 Riser Duct
Alkali recirculation buildup
2–4 hours
$60K–$120K
Stage 5 Downcomer Pipe
Calcinate sintering, coating
1–3 hours
$100K–$200K
Cyclone Inlet / Vortex Finder
Abrasive buildup, feed surges
6–12 hours
$25K–$70K
Traditional monitoring relies on a handful of fixed thermocouples and manual pressure gauges read by operators every 2–4 hours. By the time a reading looks anomalous, the blockage is already entrenched. AI changes the detection model from periodic snapshot to continuous pattern recognition—catching the early thermal drift signatures that precede a full block by hours.
How AI Analyzes Temperature and Pressure Profiles to Detect Blockages Early
The physics of a developing blockage leaves a traceable thermal and pressure fingerprint long before the flow restriction becomes total. AI models trained on historical process data learn to recognize these fingerprints across multiple sensor channels simultaneously—something no human operator can do reliably at the required temporal resolution.
AI Detection Signal Chain
1
Sensor Data Ingestion
Temperature (°C) and differential pressure (mbar) readings from each cyclone stage streamed at 1–5 second intervals via OPC-UA or MQTT to edge AI nodes.
2
Baseline Profile Modeling
AI establishes normal thermal gradients and pressure drop ratios for each stage under varying feed rates, kiln speeds, and raw mix compositions. Baselines update continuously as process conditions shift.
3
Anomaly Pattern Recognition
Deviation from baseline triggers multi-variable analysis: rising exit temperature at a stage, falling differential pressure below it, asymmetric thermal gradients across paired cyclones. Each pattern maps to a specific blockage mechanism.
4
Risk Scoring & Alert Routing
Blockage probability scored 0–100 every 30 seconds. Scores above threshold trigger automated work orders in the CMMS with location, severity, and recommended intervention—no human interpretation required.
5
Intervention & Feedback Loop
Maintenance crew executes preventative air cannon activation or manual clearing during a planned window. Outcome logged back to AI model, improving detection accuracy for future events.
The key advantage of this approach over rule-based systems is adaptability. Rule-based alarms use fixed thresholds—alert at 850°C Stage 4 exit. AI learns that on a wet-weather feed day with high alkali input 820°C Stage 4 exit combined with a 15% drop in Stage 5 differential pressure is the real danger signal. The contextual sensitivity reduces both false positives and missed detections compared to static threshold systems.
Stop Fighting Cyclone Blockages Reactively
iFactory's AI connects to your existing preheater instrumentation and starts flagging blockage risk within weeks—no new sensors required in most installations.
Key Signal Patterns: What the AI Is Actually Looking For
Understanding the specific thermal and pressure signatures that precede blockages helps maintenance and process engineering teams interpret AI alerts with confidence and respond appropriately. Below are the four dominant patterns iFactory's models recognize.
Thermal Rise at Stage Exit
Signal: Exit gas temperature at the affected stage rises 15–40°C above baseline while inlet temperature remains normal.
Why it happens: Restricted material flow reduces heat absorption from the gas stream, allowing hotter gas to pass through the stage uncooled.
Lead time: 3–6 hours before full blockage
Differential Pressure Drop
Signal: Pressure differential across a cyclone stage falls 20–35% below expected value at current gas flow rates.
Why it happens: Material accumulating in the cone partially blocks the outlet, reducing through-flow and lowering the measurable pressure differential.
Lead time: 2–4 hours before full blockage
Cross-Stage Asymmetry
Signal: Temperature or pressure divergence between parallel cyclone strings exceeds 8–12% at the same stage level.
Why it happens: Two-string preheater towers should show balanced thermal profiles. Asymmetry isolates which string is developing the restriction before a single-point sensor would detect it.
Lead time: 4–8 hours before full blockage
Rapid Thermal Oscillation
Signal: Temperature at a stage swings ±20–50°C in rapid succession over a 15–30 minute window rather than drifting gradually.
Why it happens: Partial blockage that is periodically breaking loose and re-forming—a dangerous instability pattern that can cause sudden temperature spikes if material avalanches into the kiln.
Lead time: 1–2 hours (critical alert)
Implementation Architecture: From Sensor to Alert in a Cement Plant
Deploying AI-driven blockage detection in a working preheater tower requires careful integration with existing DCS infrastructure, sensor networks and maintenance workflows. The architecture below reflects what iFactory deploys in greenfield and brownfield cement plants.
System Architecture Overview
Layer 1 — Field Instrumentation
Thermocouples (Type K/S) per stage
Differential pressure transmitters
Gas flow meters (riser ducts)
Feed rate sensors (raw mill)
Layer 2 — Edge AI Processing
OPC-UA / MQTT data acquisition
Real-time anomaly scoring (30s intervals)
Local inference — no cloud dependency
DCS integration for alarm passthrough
Layer 3 — CMMS & Operator Interface
Automated work order generation
Live OEE and preheater health dashboard
Mobile alerts to maintenance crew
Historical trend logging for audit
Edge processing ensures sub-second alert latency with zero cloud dependency—critical for safety-critical interventions.
Traditional Monitoring vs. AI-Driven Detection
Traditional Approach
Fixed threshold alarms fire only after blockage is critical
Manual operator rounds every 2–4 hours
No cross-stage correlation; single-point readings only
Emergency crew deployment at risk under extreme heat
High false positive rate disrupts production unnecessarily
AI-Driven Detection (iFactory)
2–6 hour early warning window for planned intervention
Continuous 30-second inference across all stages simultaneously
Multi-variable pattern recognition including cross-string asymmetry
Planned maintenance window reduces crew safety exposure by 40%
Context-adaptive baselines suppress nuisance alarms by 60%
Operational ROI: What the Numbers Look Like for a Mid-Size Cement Plant
Justifying AI investment for preheater monitoring requires a clear financial model. The following baseline assumptions reflect a typical 3,000 tpd dry-process cement plant in the United States operating 330 days per year with a clinker value of approximately $85 per ton. Schedule a Demo to see how ROI is Caulculated of our plant
$450K
Annual blockage cost (pre-AI)
3 incidents/year x avg. $150K direct + indirect cost per event
67%
Incident reduction target
Based on iFactory deployments in comparable cement plants
$300K
Annual savings at 67% reduction
Net of ongoing platform subscription costs
8–14 mo
Typical payback period
Including integration, training, and first-year subscription
These figures exclude secondary benefits: reduced refractory wear from thermal cycling, lower emergency labor overtime, and improved kiln feed consistency that lifts clinker quality and reduces specific heat consumption by 8–15 kcal/kg.
See the ROI Model for Your Plant
iFactory's team builds a custom blockage cost model using your plant's production data, incident history, and operational profile—at no cost during the consultation process.
Expert Perspective on AI in Cement Process Monitoring
"The preheater tower is the highest-value intervention point in a cement plant from a predictive maintenance perspective. You have heat, chemistry, and material flow converging in a confined space that is difficult to inspect and extremely expensive to bring offline. AI thermal profiling does not replace experienced process engineers—it gives them a real-time view that was previously impossible at the sensor resolution and update rate required to catch blockages in their early formation stage."
— Cement Plant Process Engineering Best Practices, 2026
72%
Of cement plants experience 3+ blockages per year
85%
Alert accuracy in AI thermal models after 90-day calibration
60%
Reduction in nuisance alarms vs. fixed-threshold DCS alarms
Conclusion
Preheater cyclone blockages are not a random maintenance event—they follow predictable thermal and pressure patterns that AI can detect hours before they become critical. The shift from reactive emergency clearing to planned preventative intervention protects crews, preserves refractory life, and eliminates the production losses that define the difference between a profitable quarter and a difficult one. For cement plants running on tight margins in a high-energy-cost environment, deploying AI-driven blockage detection is no longer an advanced technology project—it is basic operational due diligence.
iFactory's platform integrates with existing DCS infrastructure and standard instrumentation, making deployment practical for both new greenfield cement plants and existing brownfield operations. The combination of edge AI processing, CMMS automation, and continuous thermal profiling creates a closed-loop monitoring system that learns from every incident and gets more accurate over time.
Frequently Asked Questions
Do we need to install new sensors, or can AI work with our existing DCS instrumentation?
In most installations, iFactory works with your existing thermocouple and pressure transmitter network. The AI layer connects to your DCS via OPC-UA or MQTT protocol, ingesting the data already being collected. New sensors are recommended only when a stage has fewer than 2 temperature measurement points or when pressure taps are missing on riser ducts—both relatively quick additions during a scheduled maintenance window.
How long does the AI model take to calibrate to our specific preheater before alerts are reliable?
Initial baseline modeling requires 4–6 weeks of normal operating data to establish accurate thermal and pressure profiles across your feed variability range. Alert accuracy improves further over the first 90 days as the model encounters more operating conditions—different raw mix compositions, varying kiln speeds, and seasonal temperature effects. Plants that can provide 6–12 months of historical DCS data accelerate this calibration significantly.
What happens when the AI generates a blockage alert? What does the maintenance workflow look like?
When the blockage probability score crosses the configured threshold, iFactory automatically creates a work order in the CMMS with the affected stage, alert severity, recommended action (air cannon activation, rod clearing, or feed rate reduction), and the sensor data that triggered the alert. The assigned maintenance crew receives a mobile notification. They can review the thermal trend visualization, confirm or escalate the alert, and execute the intervention during a planned production window—typically a 15–30 minute feed reduction rather than a full kiln stop.
Can the system detect blockages in both single-string and twin-string preheater configurations?
Yes. Single-string detection relies on absolute thermal and pressure deviation from baseline. Twin-string towers gain an additional detection layer through cross-string asymmetry analysis—comparing the thermal profiles between String A and String B at each stage level. This comparative approach often identifies developing blockages 1–2 hours earlier than single-string absolute deviation methods, since a healthy string provides a real-time reference against which the affected string can be compared.
What is the typical integration timeline from contract signing to live monitoring?
For a standard 5-stage preheater with an existing OPC-UA-enabled DCS, iFactory's integration team typically achieves live data ingestion within 2–3 weeks. Dashboard configuration and alarm threshold setup takes another 1–2 weeks. Calibrated AI models begin generating reliable production alerts at 6–8 weeks post-deployment. Total time from contract to reliable alert capability is typically 8–12 weeks, with no plant downtime required during installation.