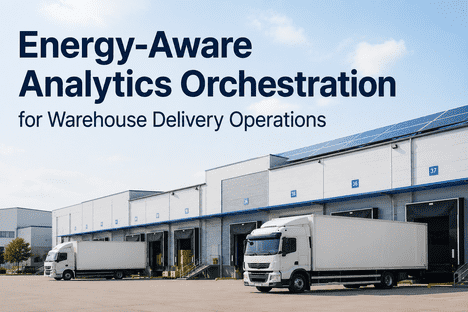
Energy systems are among the largest recurring costs in warehouse and delivery hub operations — and among the least actively managed. A distribution center running 24/7 across 300,000 square feet of climate-controlled space consumes energy through hundreds of individual systems: HVAC units maintaining cold chain or ambient temperature zones, compressed air systems powering dock equipment and pneumatic conveyors, lighting arrays across picking aisles and staging areas, refrigeration compressors in cold storage sections, and electrical infrastructure serving sorting automation. Most warehouse operations manage these systems through fixed maintenance schedules and reactive responses to system failures — neither of which reflects how energy systems actually degrade or how energy costs actually accumulate. AI-tracked energy analytics changes this fundamentally. iFactory AI's energy monitoring and analytics platform continuously monitors consumption patterns across every major energy system in the facility — detecting the degradation signatures that drive energy waste weeks before they cause system failures, identifying the operational patterns that produce unnecessary consumption spikes, and providing the real-time visibility that enables energy cost decisions based on data rather than estimates. For warehouses and delivery hubs where energy is consistently the second or third largest operational cost line after labor, AI-driven energy management is not a sustainability initiative — it is a cost reduction program with measurable payback within the first operating year. To see how iFactory AI's energy analytics applies to your facility, Book a Demo with our energy management engineering team.
Why Warehouse Energy Costs Are Higher Than They Need to Be
The energy cost structure of a warehouse or delivery hub has several characteristic waste patterns that compound over time when energy systems are managed reactively. Understanding these patterns — and why they are invisible without continuous monitoring — is the foundation for understanding what AI energy analytics actually delivers.
How iFactory AI Monitors and Optimizes Warehouse Energy Systems
iFactory AI's energy monitoring platform delivers six integrated analytics capabilities across the energy systems that drive the largest share of warehouse facility energy cost. Each capability operates continuously — not as a periodic audit but as a real-time intelligence layer that detects waste and degradation as it develops rather than after it has accumulated into a significant cost or failure event.
iFactory AI monitors HVAC system performance through temperature sensor arrays, compressor current monitoring, supply and return air differential tracking, and zone-level energy consumption metering. The analytics engine compares actual energy-per-ton-of-cooling against design specifications continuously — detecting coil fouling, refrigerant charge drift, economizer failures, and compressor wear patterns through energy consumption deviation rather than waiting for temperature setpoint failures or equipment shutdowns. HVAC predictive maintenance alerts fire 6–8 weeks before performance degradation reaches the threshold that forces an emergency service call during peak summer loading — when HVAC failures are most expensive and service response times are longest.
Cold storage refrigeration systems are monitored through condenser and evaporator temperature differentials, compressor suction and discharge pressure trending, defrost cycle frequency analysis, and energy-per-unit-volume-maintained calculations. iFactory AI's refrigeration analytics identifies condenser fouling (increases head pressure and compressor energy), door seal degradation (increases refrigeration load), excessive defrost cycling (indicates evaporator coil icing from humidity infiltration), and compressor valve wear (reduces efficiency and increases energy consumption per ton of refrigeration). Refrigeration systems in cold chain warehouse operations are the highest-leverage energy optimization target — typically representing the largest single energy consumption category and carrying the highest consequence failure profile.
Compressed air systems are monitored through compressor duty cycle analysis, system pressure trending, flow meter data where installed, and compressor motor current consumption. iFactory AI's compressed air analytics detects leak development through the characteristic signature of increasing compressor duty cycle at constant demand — the compressor running more frequently or for longer periods to maintain the same system pressure, indicating leakage is growing in the distribution system. The duty cycle trend analysis detects leak development from approximately 5% loss upward, enabling repairs before leakage reaches the 20–30% range that characterizes unmonitored warehouse compressed air systems. Specific leak location identification is supported through ultrasonic leak survey integration and zone isolation valve monitoring.
iFactory AI's lighting analytics monitors zone-level energy consumption against operational activity data from the WMS — identifying lighting zones consuming full power during periods of low or zero operational activity. Lighting consumption data combined with shift scheduling records, WMS pick activity by zone, and dock utilization metrics enables dynamic lighting scheduling recommendations that align zone illumination levels with actual operational requirements rather than fixed calendar schedules. The analytics platform also monitors individual luminaire consumption trends — detecting the characteristic power draw increase that precedes fluorescent and LED driver failures, enabling proactive lamp replacement before the failure disrupts zone operations. Lighting optimization consistently delivers 12–20% reduction in facility lighting energy cost in warehouse environments with varied zone utilization patterns.
Utility demand charges are billed on the peak 15-minute consumption interval recorded during each billing period — meaning a single 15-minute equipment startup sequence can drive the demand charge for an entire month. iFactory AI's load analytics monitors real-time facility power draw, predicts demand peaks from scheduled equipment startup sequences and operational activity, and recommends load staggering sequences that reduce peak demand below demand ratchet thresholds. The analytics platform identifies the specific operational patterns that generate demand spikes — conveyor startup sequences, dock equipment simultaneous activation, HVAC emergency mode operation — and provides scheduling recommendations that maintain full operational capability while flattening the demand profile that determines demand charges. Demand charge reduction of 10–20% is consistently achievable in warehouse operations with active load analytics management.
iFactory AI's energy dashboard integrates all energy system monitoring streams into a single real-time view of facility energy performance — showing total consumption by system category, deviation from baseline by zone and equipment, predicted monthly energy cost based on current consumption patterns, and rolling 12-month energy cost trend. Cost attribution by operational zone, shift, and equipment category enables the specific savings claims that support sustainability reporting and energy cost reduction KPI tracking. The dashboard also supports utility tariff integration — calculating whether current operational patterns are optimally aligned to time-of-use rate structures and recommending scheduling adjustments that shift flexible loads to lower-tariff periods.
Energy System Monitoring vs. No Monitoring: The Performance Gap
The energy cost difference between a warehouse operating with AI-tracked energy analytics and one operating without continuous monitoring is measurable across every energy system category. The table below maps the comparison across the dimensions that determine facility energy cost and energy system reliability.
| Energy System | Without Analytics Monitoring | iFactory AI Energy Analytics |
|---|---|---|
| HVAC Performance | Degradation accumulates between annual service visits — 8–15% overconsumption continuous | Continuous performance monitoring detects degradation within weeks — energy-per-ton tracked daily |
| Refrigeration Efficiency | Condenser fouling and door seal degradation invisible until temperature excursion or compressor failure | Pressure differential and duty cycle trending detects condenser fouling 4–6 weeks before failure |
| Compressed Air Leakage | 20–30% system output lost to leaks — compressors run continuously to compensate | Duty cycle analysis detects leakage development from 5% — repairs before reaching 20% loss threshold |
| Lighting Consumption | Fixed schedules — lighting runs at full capacity regardless of zone occupancy and activity | Activity-aligned scheduling reduces lighting energy 12–20% without impacting operational requirements |
| Demand Charges | Unmanaged equipment startup peaks drive demand charges — 15–25% of electricity bill | Load analytics enables startup sequencing that reduces demand charges 10–20% |
| System Failure Risk | HVAC, refrigeration, and compressed air failures reactive — discovered at breakdown | Predictive failure detection 4–8 weeks before failure — planned intervention eliminates emergency response |
| Energy Cost Visibility | Monthly utility bill only — no system-level, zone-level, or shift-level attribution | Real-time cost attribution by system, zone, shift, and equipment category |
| Total Energy Cost | Baseline — all waste categories accumulating without visibility or intervention | 20–35% below baseline — from degradation elimination, leak repair, demand management, and scheduling optimization |
The Facility-Wide Failure Risk Hidden in Energy System Data
Energy analytics delivers two categories of value simultaneously: cost reduction from eliminated waste and failure prevention from early degradation detection. The failure prevention value is often larger than the energy savings value in facilities where a single system failure event produces facility-wide operational disruption — particularly refrigeration failures in cold chain operations and compressed air failures in dock and automation environments.
Want to see how iFactory AI's energy analytics applies to your warehouse facility's HVAC, refrigeration, and compressed air systems? Book a Demo — we configure the monitoring for your specific energy system inventory and utility tariff structure.
Expert Perspective
Energy management in warehouse and delivery hub operations is consistently the most undervalued operational improvement opportunity I encounter in facility assessments. The reason is simple: the waste is invisible. When a HVAC system is running at 85% efficiency, the utility bill doesn't tell you that — it just tells you what you consumed. When compressed air leakage reaches 25%, the bill doesn't distinguish that from legitimate demand. When demand charges represent 22% of your electricity cost, most facility managers don't know whether that's avoidable or unavoidable. AI-tracked energy analytics makes all of this visible — and when it becomes visible, the improvement opportunities are consistently larger than operations leaders expect. I have seen facilities achieve 25–30% energy cost reductions within 12 months of deploying continuous energy monitoring, because the waste was already there, invisible, accumulating every day. The analytics didn't create the savings opportunity — it revealed the one that was already being paid for. The failure prevention value is often equally significant. A refrigeration failure in a cold chain distribution center is not a maintenance event — it is a potential inventory loss, regulatory event, and customer relationship crisis simultaneously. When energy analytics detects the degradation signature of that failure 6 weeks in advance, the avoided cost is orders of magnitude larger than the analytics platform investment.
What Warehouse Operations Achieve: Energy Analytics ROI
Conclusion: Energy Is a Data Problem Before It Is a Cost Problem
Warehouse and delivery hub energy costs are high because the systems generating those costs operate without continuous monitoring — degrading, leaking, and running inefficiently in ways that are invisible in monthly utility bills and undetected between scheduled service visits. AI-tracked energy analytics transforms this by making every energy system's performance visible in real time: the HVAC unit consuming 15% above its design energy profile, the refrigeration compressor running longer cycles as condenser fouling accumulates, the compressed air distribution system leaking 20% of its output through aging fittings, and the demand spike at 7:15 a.m. on Monday when six conveyor zones start simultaneously. When energy system performance is visible, the improvement decisions are straightforward. iFactory AI's energy monitoring platform is the visibility layer that converts energy from an unmanaged cost into a managed operational metric — with measurable reduction targets, system-level attribution, and the predictive maintenance intelligence that prevents the facility-wide failures that make energy system reliability as important as energy cost efficiency.