Inbound receiving is where warehouse delivery accuracy is won or lost — and most operations don't know it. When a barcode scanner on the inbound dock reads intermittently because the laser assembly is degrading, every parcel it misreads enters the WMS with incorrect data. When a receiving scale drifts out of calibration because nobody has serviced it since last quarter, dimensional weight charges and routing decisions are made on inaccurate measurements. When dock leveler hydraulics fail partially and packages are handled off-level, damage rates increase before a single item reaches the pick zone. These failures don't announce themselves as equipment problems. They announce themselves as delivery inaccuracies — wrong items shipped, incorrect weight charges, mislabeled parcels, inventory discrepancies that take weeks to trace back to a receiving scan error that happened on a Tuesday morning three weeks ago. The diagnostic trail from a delivery inaccuracy back to the receiving equipment failure that caused it is nearly always invisible without analytics specifically designed to connect receiving equipment performance data to downstream delivery accuracy metrics. iFactory AI's platform creates that connection — monitoring inbound receiving equipment continuously, detecting the degradation patterns that produce scan errors and measurement inaccuracies weeks before they reach the threshold that generates visible failures, and providing the analytics evidence that traces downstream delivery problems back to the receiving equipment event that created them. To see how iFactory AI's inbound receiving analytics applies to your operation, Book a Demo with our warehouse analytics team.
Inbound Receiving · Equipment Analytics · Delivery Accuracy · AI Maintenance
Inbound Receiving Equipment Analytics for Warehouse Delivery Accuracy
Scanner failures, scale malfunctions, and dock equipment degradation create downstream delivery inaccuracies that are invisible at the point of origin. iFactory AI monitors every inbound receiving asset continuously — detecting the degradation that causes accuracy failures weeks before it reaches the threshold that generates visible operational damage.
73%
Of warehouse delivery inaccuracies trace back to an inbound receiving equipment failure that was never connected to the downstream error
6 wk
Average advance warning from iFactory AI's receiving equipment analytics before scanner or scale failure reaches error-generating threshold
3–5%
Delivery accuracy rate improvement achievable by connecting inbound receiving equipment maintenance to downstream accuracy metrics
14 days
To live receiving equipment analytics — from WMS integration to predictive alerts on scanner, scale, and dock equipment performance
The Inbound Receiving Equipment Failure Cascade: How Equipment Problems Become Delivery Inaccuracies
The connection between receiving equipment failure and downstream delivery inaccuracy is not obvious because the two events are separated by time, by system, and by operational function. The scanner failure happens at 8:45 a.m. The delivery inaccuracy it causes doesn't manifest until the parcel reaches the wrong recipient three days later. By that point, the scanner has been replaced and the failure event is a closed maintenance record — never connected to the customer complaint that arrived on Day 3.
Step 1
Equipment Degradation Begins
A receiving dock barcode scanner's laser assembly begins degrading — read accuracy drops from 99.8% to 97.2% over 4 weeks. A receiving scale's calibration drifts 3.2% below certified tolerance. A dock leveler hydraulic seal begins weeping, causing inconsistent leveling and rough parcel handling. None of these failures have reached a threshold that triggers visible malfunction — but each is already producing accuracy errors.
Step 2
Errors Enter the WMS Silently
The degraded scanner misreads 2.6% of inbound barcodes — items enter the WMS with incorrect SKU, quantity, or routing data. The drifted scale generates incorrect dimensional weight on 340 parcels per shift, producing inaccurate weight charges and routing misassignments. These errors don't generate alerts — the WMS records them as valid transactions because the equipment appeared to function normally during each individual scan event.
Step 3
Errors Propagate Through Sortation and Dispatch
Incorrectly scanned items are sorted to wrong zones, routed to incorrect carrier lanes, or held in exceptions queues that delay dispatch. Mislabeled parcels depart with routing data derived from the original scan error — directed to the wrong delivery address, the wrong delivery window, or the wrong carrier for the destination zone. At this point, the receiving equipment failure is a delivery routing failure — but the connection is still invisible.
Step 4
Delivery Failure Recorded — Equipment Root Cause Invisible
The TMS records a delivery accuracy failure: wrong item delivered, incorrect weight charge invoiced, parcel delivered to wrong address. Customer service receives the complaint. The operations team investigates — and finds no obvious cause in the WMS transaction record, because the scanner that generated the error was replaced two days after the failure event with no connection made to the downstream delivery failures it caused across 3 shifts before replacement.
The Inbound Receiving Equipment Classes That Drive Delivery Inaccuracy
Not all inbound receiving equipment carries equal delivery accuracy risk. The equipment classes below represent the highest-impact failure modes — the assets whose degradation most directly produces the scan errors, measurement inaccuracies, and handling damage that propagate into downstream delivery failures.
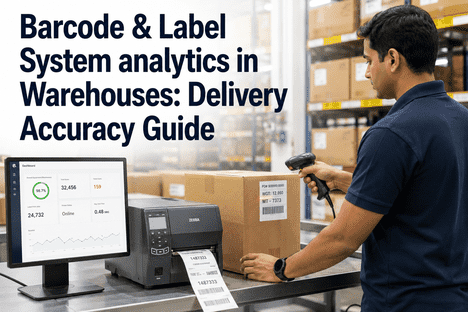
Primary failure mode: Laser assembly degradation reduces decode accuracy below 99.5% threshold — generating silent misreads recorded as valid scans in WMS
Delivery impact: Incorrect SKU, quantity, or routing data enters WMS — wrong item sort, wrong carrier assignment, wrong delivery address on generated label
iFactory AI detection: Read rate trending and decode confidence score monitoring — alert when accuracy drops below configurable threshold weeks before systematic failures
Primary failure mode: Calibration drift produces measurement error above ±0.5% tolerance — incorrect dimensional weight generates wrong carrier rate class, incorrect routing tier, and inaccurate freight charge invoicing
Delivery impact: Parcels routed to wrong carrier tier, incorrect surcharges applied, dimensional weight disputes with carriers, SLA failures from routing misassignment
iFactory AI detection: Calibration drift monitoring through comparison of scale output against known-weight reference objects in daily automated checks — alert when drift exceeds threshold
Primary failure mode: Hydraulic seal degradation produces inconsistent leveling height — packages handled off-level experience impact forces that cause damage, label separation, and barcode obscuring that creates downstream scan failures
Delivery impact: Damaged goods dispatched, label separation creates untrackable parcels, scan failures on damaged barcodes create routing exceptions and delivery delays
iFactory AI detection: Hydraulic pressure trending, leveler positioning sensor monitoring, and cycle time analysis detect seal degradation 6–8 weeks before mechanical failure
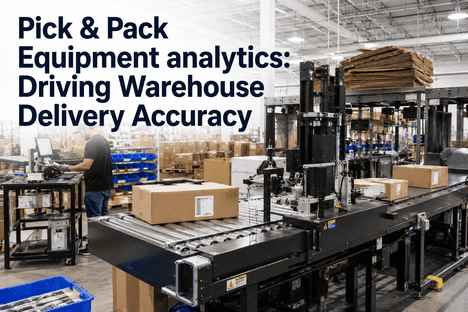
Primary failure mode: Belt tension degradation and drive motor wear create speed inconsistency at scan tunnels — parcels passing through scan zones at incorrect speed generate read failures and gap control violations that produce routing errors
Delivery impact: Scan tunnel misreads from speed variance generate wrong sort assignments — parcels routed to incorrect sort zones enter the wrong carrier stream without a visible error event
iFactory AI detection: Motor current trending, belt speed monitoring, and gap control sensor data detect induction conveyor degradation before scan tunnel accuracy is affected
Primary failure mode: Print head degradation produces label content quality below scan threshold — barcodes with incomplete print are accepted visually but generate misreads at downstream scan points, creating sort errors that originate at receiving but manifest in sortation
Delivery impact: Downstream scan failures on degraded labels create sort exceptions, manual intervention requirements, delayed dispatch, and in worst cases delivery to wrong address from manual re-labeling errors
iFactory AI detection: Print head resistance monitoring and label scan quality score trending — alert when label scan confidence drops below threshold before systematic read failures begin
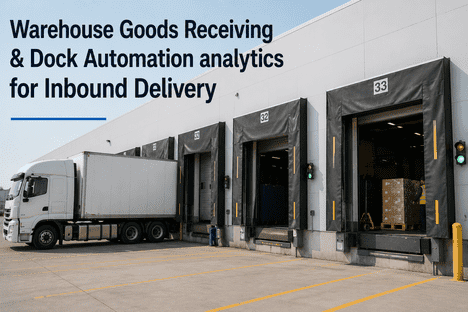
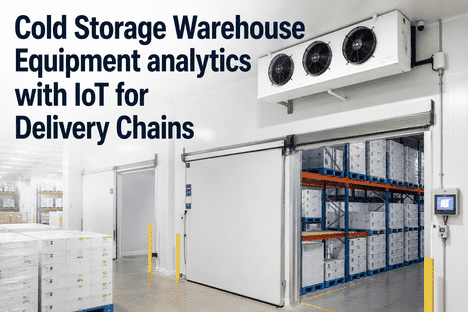
Primary failure mode: Door seal degradation and restraint system wear create temperature excursions in cold chain receiving and trailer movement during unloading — both produce product damage and handling disruptions that increase receiving error rates
Delivery impact: Cold chain integrity failures produce product claims and regulatory events; trailer movement during unloading creates handling damage and package displacement errors that increase downstream sort inaccuracy
iFactory AI detection: Door seal thermal imaging integration and restraint system load monitoring detect degradation before cold chain integrity thresholds are breached
Want to see iFactory AI's receiving equipment monitoring applied to your specific inbound dock configuration? Book a Demo — we configure the equipment monitoring for your scanner model, scale type, and dock equipment inventory.
iFactory AI · Inbound Receiving Equipment Analytics
Connect Receiving Equipment Performance to Delivery Accuracy Outcomes
iFactory AI monitors scanner read rates, scale calibration drift, dock leveler performance, and induction conveyor speed continuously — detecting the equipment degradation that creates delivery inaccuracies weeks before errors reach the volume threshold that generates customer complaints and carrier disputes.
How iFactory AI Monitors Inbound Receiving Equipment
iFactory AI's inbound receiving analytics platform integrates five monitoring streams — scan performance data, measurement accuracy trending, equipment sensor telemetry, WMS transaction quality metrics, and downstream delivery accuracy data — to create the full visibility layer that connects receiving equipment performance to delivery outcome quality.
01
Scan Performance Analytics — Real-Time Read Rate Monitoring
Every scanner in the inbound receiving zone feeds read rate, decode confidence score, and no-read frequency data to iFactory AI's analytics engine in real time. The platform tracks trending across shifts, days, and weeks — identifying the scanner assets whose read accuracy is declining before the decline reaches the threshold that generates visible WMS transaction errors. When a scanner's decode confidence drops below a configurable threshold, a predictive maintenance alert fires with the specific scanner ID, the current accuracy trend, and the estimated time before the accuracy failure affects WMS data quality — giving the maintenance team a service window before the scanner begins producing errors that enter the delivery system.
Outcome: Scanner degradation detected 4–6 weeks before systematic read failures reach delivery-impacting error rate thresholds
02
Scale Calibration Drift Monitoring — Continuous Accuracy Validation
Receiving scales are monitored through automated daily reference weight checks — known-weight objects passed through the scale at shift start, shift midpoint, and shift end. Scale output is compared against reference values and tolerance thresholds, with calibration drift trending tracked continuously. When a scale's drift trend projects to exceed ±0.5% certification tolerance within a configurable warning window, an alert fires with the drift rate, the projected certification breach date, and the work order template for calibration service — enabling scheduled recalibration before the scale begins generating incorrect dimensional weight data that propagates into carrier rate errors and routing misassignments.
Outcome: Calibration drift detected and corrected before dimensional weight errors generate carrier disputes and routing inaccuracies
03
Dock Equipment Sensor Monitoring — Leveler and Restraint Performance
Dock levelers are monitored through hydraulic pressure sensors, positioning sensors measuring leveling height consistency, and cycle time analysis tracking performance across each actuation event. Hydraulic seal degradation produces characteristic pressure drop patterns and inconsistent positioning that iFactory AI's predictive models detect 6–8 weeks before mechanical failure. Dock door seal performance is monitored through thermal differential sensors in cold chain receiving bays — identifying seal degradation before cold chain integrity thresholds are breached. Vehicle restraint system load monitoring detects restraint wear before trailer movement events during unloading create handling damage and receiving accuracy failures.
Outcome: Dock equipment failures prevented before they produce package handling damage, label separation, and cold chain integrity events
04
WMS Transaction Quality Analytics — Connecting Equipment Events to Data Quality
iFactory AI's analytics platform ingests WMS inbound transaction data alongside equipment performance data — correlating scan error event timestamps with specific scanner asset IDs, scale transaction error spikes with scale calibration drift events, and receiving exception rates with dock equipment performance anomalies. This cross-system correlation creates the audit trail that connects downstream delivery inaccuracies back to the specific receiving equipment failure that initiated them. When a delivery accuracy investigation identifies a pattern of inaccuracies, the analytics platform can trace the event chain back to the receiving equipment asset and the specific time window when its performance degraded below accuracy thresholds.
Outcome: Full audit trail from delivery inaccuracy back to receiving equipment event — enabling root cause action rather than repeated investigation
05
Predictive Maintenance Work Orders — Closing the Alert-to-Action Loop
Receiving equipment predictive alerts in iFactory AI automatically generate work orders with equipment diagnostic context, maintenance priority classification, parts requirements from asset BOM, and current inventory check — ensuring the maintenance team has everything needed to complete the repair without additional investigation. Work orders for receiving equipment are prioritized by delivery accuracy impact: a scanner with declining read accuracy on a high-volume inbound lane is prioritized above a dock leveler with marginally declining hydraulic pressure on a low-volume receiving bay, because the delivery accuracy consequence of the scanner failure is larger. Parts and inventory checks prevent the stock-out delays that extend equipment downtime into the delivery accuracy impact window.
Outcome: Alert-to-completed-repair workflow in one platform — receiving equipment maintained before delivery accuracy impact, not after
Receiving Equipment Analytics vs No Monitoring: The Delivery Accuracy Gap
| Performance Area |
No Equipment Analytics |
iFactory AI Receiving Analytics |
| Scanner Failure Detection |
Detected at complete failure — after days of degraded read accuracy and WMS data errors have already propagated downstream |
Read rate trending detects accuracy decline 4–6 weeks before systematic failures — maintenance before errors enter WMS |
| Scale Calibration |
Annual or quarterly service schedule — drift accumulates between visits, incorrect dimensional weight charges and routing errors invisible |
Continuous calibration drift monitoring — correction scheduled when drift trend projects to exceed tolerance, not on a fixed calendar |
| Dock Equipment Performance |
Reactive maintenance at mechanical failure — hydraulic failures and leveler malfunctions cause package damage, label separation, and cold chain breaches |
Hydraulic pressure trending and thermal monitoring detect dock equipment degradation 6–8 weeks before mechanical failure |
| Delivery Inaccuracy Root Cause |
Traced to WMS transaction errors — receiving equipment root cause never identified because equipment and delivery data are in separate systems |
Cross-system correlation traces delivery inaccuracy back to specific receiving equipment asset and failure time window |
| Inbound Receiving Accuracy Rate |
Baseline — degraded scanner and scale accuracy continuously introducing WMS data errors without detection |
3–5% improvement from eliminating equipment-driven scan and measurement errors at the inbound receiving point |
| Carrier Dispute Frequency |
Recurring dimensional weight disputes from scale drift — investigation reveals incorrect measurements but root cause never prevented |
Scale calibration monitoring eliminates drift-driven measurement errors — carrier disputes from inaccurate weight charges reduced to near zero |
| Shift Handover on Receiving Equipment |
Verbal or unstructured — scanner issues from Day shift unknown to Night shift, equipment performance patterns invisible across shift boundaries |
Shift Logbook captures receiving equipment status, active alerts, and accuracy performance — incoming shift starts with full equipment visibility |
Expert Perspective
The inbound receiving dock is the most consequential point of failure for downstream delivery accuracy in any fulfillment operation — and it is consistently the least monitored. Operations invest heavily in sortation automation, carrier integration, and outbound quality control. But if a barcode scanner on the inbound dock has been reading at 96% accuracy for the past two weeks because nobody noticed the laser assembly was degrading, every investment in the downstream process is partially undermined by the 4% error rate entering the WMS at the point of origin. I have seen operations run delivery accuracy investigations for 4–6 weeks — analyzing sort logic, carrier routing, label production quality, packing processes — without ever identifying the inbound scanner that was introducing systematic SKU mismatches since its last calibration service 8 months ago. The diagnostic trail from delivery inaccuracy back to receiving equipment failure is simply not visible without analytics specifically designed to cross-reference equipment performance data with WMS transaction quality and downstream delivery accuracy metrics. When operations build that connection, the receiving dock stops being the hidden source of downstream problems and becomes the earliest, most actionable intervention point in the accuracy improvement journey.
— Director of Inbound Operations, National E-Commerce Fulfillment Network · 16 Years Warehouse Receiving & Inventory Accuracy · Former VP of Operations, Multi-Site 3PL Provider · Certified Supply Chain Professional (CSCP)
What Delivery Accuracy Improvement Looks Like in Practice
3–5%
Delivery Accuracy Rate Improvement
Eliminating equipment-driven scan errors and measurement inaccuracies at the inbound receiving point removes the upstream source of the WMS data errors that propagate into delivery accuracy failures downstream — producing 3–5 percentage point accuracy rate improvement without changing sortation logic, carrier routing, or outbound processes
70%+
Receiving Equipment Failure Reduction
Predictive maintenance alerts on scanner assemblies, scale calibration drift, dock leveler hydraulics, and induction conveyor drives eliminate the unplanned failures that produce the largest accuracy impact events — peak-window scanner failures, calibration breach events, and dock equipment mechanical failures during high-volume receiving shifts
~Zero
Calibration-Driven Carrier Disputes
Continuous scale calibration drift monitoring eliminates the periodic accuracy failures that generate incorrect dimensional weight charges — removing the recurring carrier dispute cycle that consumes logistics analyst time and creates carrier relationship friction without addressing the scale maintenance root cause
Full
Receiving-to-Delivery Audit Trail
Cross-system correlation between receiving equipment performance data and downstream delivery accuracy metrics creates a complete audit trail — enabling delivery inaccuracy investigations to identify the receiving equipment root cause within hours rather than the 4–6 weeks that manual cross-referencing of disconnected data systems typically requires
Conclusion: Delivery Accuracy Starts at the Receiving Dock
Warehouse delivery accuracy is determined at the inbound receiving dock — not in sortation, not in carrier routing, not in outbound quality control. The scanner that misreads at 8:45 a.m. creates a delivery accuracy failure three days later. The scale that drifted 3% beyond calibration tolerance last week creates a carrier dispute next month. The dock leveler that failed partially during the Tuesday morning receiving shift creates the damaged goods claim that arrives on Friday. iFactory AI's inbound receiving equipment analytics platform makes the equipment-to-accuracy connection visible in real time — monitoring every receiving asset continuously, detecting degradation weeks before it reaches error-generating thresholds, connecting WMS transaction quality data to equipment performance events, and providing the closed-loop audit trail that traces delivery inaccuracies back to their origin at the receiving dock. When receiving equipment performs reliably, every downstream process that depends on the accuracy of inbound data performs better — without changing sortation logic, carrier integration, or outbound quality control.
iFactory AI · Inbound Receiving Equipment Analytics
Monitor Every Receiving Asset — Eliminate Delivery Inaccuracies at the Source
Scanner read rate monitoring · Scale calibration drift detection · Dock leveler hydraulic analytics · Induction conveyor performance · WMS transaction quality correlation · Shift Logbook for receiving handover. iFactory AI's receiving analytics platform connects equipment performance to delivery accuracy outcomes — live in 14 days.
Frequently Asked Questions
Which barcode scanner and scale manufacturers does iFactory AI support for inbound receiving equipment monitoring?
iFactory AI's inbound receiving equipment monitoring supports the major scanner and scale platforms used in warehouse receiving operations. Scanner integrations cover Zebra Technologies (fixed and handheld), Honeywell Xenon and Voyager series, Datalogic PowerScan and QuickScan, Cognex fixed industrial scanners, and SICK scan tunnel systems — both through native API telemetry where available and through WMS transaction quality analytics where direct scanner data feeds are not supported. Scale integrations cover Mettler Toledo, Fairbanks, Cardinal, and Rice Lake static and conveyor scales through RS-232, Ethernet, and OPC-UA interfaces. For equipment not in the standard integration library, the implementation team reviews your specific scanner and scale models during the pre-deployment scoping session and provides a written integration specification before deployment begins.
Book a Demo to discuss the equipment monitoring configuration for your specific receiving dock inventory.
How does iFactory AI detect scanner read rate degradation before it reaches a delivery-impacting error rate?
Scanner read rate degradation detection works through two complementary mechanisms. The primary mechanism is direct telemetry monitoring: where scanner firmware supports it, iFactory AI receives decode confidence scores, no-read frequency counts, and laser power output readings directly from the scanner management system — tracking trending across time to identify assets whose accuracy is declining before reaching the error threshold. The secondary mechanism is WMS transaction quality analytics: iFactory AI analyzes the WMS inbound transaction stream for patterns associated with scanner degradation — increased exception handling rates on specific receiving lanes, elevated manual override frequency on specific scanner stations, and SKU mismatch patterns that correlate temporally with specific scanner assets. Both mechanisms produce predictive alerts that fire when degradation trends project to reach the delivery-impacting error threshold within a configurable warning window, giving maintenance teams 4–6 weeks of lead time on scanner service requirements.
Can iFactory AI trace a specific delivery inaccuracy back to the receiving equipment event that caused it?
Yes — the receiving-to-delivery audit trail is one of iFactory AI's core capabilities for inbound operations. When a delivery accuracy investigation identifies a specific error — wrong item delivered, incorrect weight charge, parcel sent to wrong address — the analytics platform cross-references the delivery event timestamp with receiving equipment performance records for the same time window. The audit trail shows which scanner or scale processed the parcel at inbound receiving, what that asset's performance metrics were during the relevant shift, whether any accuracy anomalies occurred in the WMS transaction stream for that lane and time window, and whether a predictive maintenance alert was active or recent for the equipment asset in question. This cross-system correlation typically reduces delivery accuracy investigation time from the 4–6 weeks of manual cross-referencing between disconnected systems to hours of analytics-driven inquiry in the iFactory AI platform.
How does iFactory AI's Shift Logbook improve inbound receiving equipment continuity across shift changes?
iFactory AI's Shift Logbook structures the receiving dock handover in a way that specifically captures equipment status, active performance alerts, and accuracy anomalies from the outgoing shift — ensuring the incoming shift supervisor and maintenance team start with full visibility into receiving equipment issues that developed during the previous period. The handover includes: active predictive maintenance alerts on receiving equipment assets (scanner read rate alerts, scale calibration alerts, dock equipment alerts), WMS transaction quality anomalies observed during the shift (elevated no-read rates, exception handling spikes, manual override patterns), and any equipment issues that were addressed or deferred during the outgoing shift. This structured handover replaces the verbal or unstructured document handover that typically loses equipment performance context between shifts — and prevents the common scenario where a scanner that began showing declining read accuracy on Day shift goes unmonitored through Night shift because no structured handover captured the alert status.
What is the typical deployment timeline for iFactory AI's inbound receiving equipment analytics at a single-facility warehouse?
The standard deployment timeline for inbound receiving equipment analytics at a single-facility warehouse is 14 days from project kickoff to live analytics activation. The deployment covers: WMS integration for inbound transaction quality analytics (Days 1–5), scanner and scale equipment integration and telemetry configuration (Days 3–8), dock equipment sensor installation and commissioning where new hardware is required (Days 5–10), baseline establishment and initial predictive model training (Days 8–12), and system acceptance testing and operations team training (Days 12–14). Pre-deployment scoping, equipment inventory assessment, and integration architecture planning are completed before the 14-day deployment clock begins — so the deployment period itself focuses on connection, configuration, and activation rather than discovery and architecture design. New receiving dock facilities can be added to an existing iFactory AI deployment using the same 14-day onboarding process without modifying the platform architecture established in the initial site deployment.