What does one hour of warehouse delivery equipment downtime actually cost? Most operators answer with the throughput number "$12K an hour in lost picks" and stop there. That answer misses 60 to 70% of the real cost. When a sortation drive fails at 9 AM on a peak shift, the visible loss is just the surface: fulfillment delays cascade into missed carrier cutoffs, SLA penalty clauses trigger automatically on B2B contracts, emergency repair premiums run 2 to 3 times standard labor rates, overtime gets authorized for second-shift recovery, expedited shipping replaces ground service to meet promised delivery window, and customer churn risk compounds at 15 to 40% on repeated incidents. Industry research shows the true hourly downtime cost is typically 2.5 to 3.5 times the initial production-only estimate meaning that "$12K an hour" warehouse failure is actually costing $30K to $42K once every line item is counted. AI analytics pays back fastest precisely because it eliminates the multiplier effect: detecting failures 4 to 12 weeks ahead, scheduling repairs during planned windows, eliminating emergency parts premiums, and protecting carrier SLAs. A single prevented failure event typically covers the annual cost of the platform. Book a Demo to see how iFactory AI delivers measurable ROI across warehouse delivery operations within 6 to 8 weeks.
2.5-3.5x
True downtime cost multiplier vs initial production-only estimate
800 hrs
Annual unplanned downtime exposure for warehouses running reactive maintenance
10-30x
ROI ratio achieved by AI analytics deployments within 18 months
6-8 wks
Deployment timeline from baseline audit to live AI ROI capture
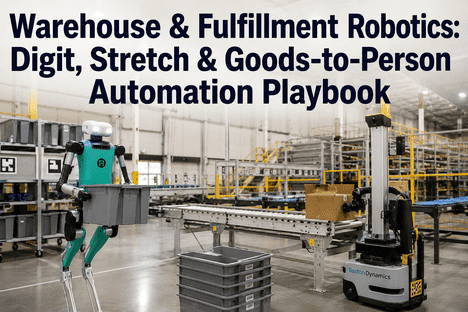
What One Hour of Warehouse Delivery Downtime Actually Costs in 2026
Calculating true downtime cost requires looking at six categories of impact — not just lost throughput. A primary conveyor failure at a 50,000-parcel-per-day fulfillment hub illustrates the full picture: direct revenue loss from missed shipments accounts for roughly 30% of true cost; SLA penalties on B2B contracts add another 15 to 25%; emergency repair labor and parts premiums add 10 to 15%; overtime authorization for recovery shifts adds 8 to 12%; expedited shipping to maintain customer promises adds 10 to 18%; and customer churn risk on repeated incidents compounds at 5 to 15% of annualized customer value. Warehouses running reactive maintenance face this scenario an average of 800 hours per year — exposure that AI analytics can reduce by 35 to 65% within the first 18 months.
iFactory's AI ROI engine quantifies every downtime category in real time, attributing direct cost impact per asset, per failure mode, per shift. Operations leaders stop arguing about whether AI pays back and start seeing the prevented dollars accumulate in a single dashboard. The result is a defensible business case grounded in actual facility data, not vendor brochures — with measurable returns starting within 60 to 90 days of deployment.
Real-Time Downtime Cost Quantification
Live calculation of true hourly downtime cost per asset — including throughput loss, SLA penalty exposure, labor overtime, parts premium, and expedited shipping. Replaces spreadsheet estimates with operational truth.
SLA Penalty Exposure Modeling
AI tracks B2B and marketplace SLA terms — on-time shipping, perfect order rate, pick accuracy — and quantifies penalty exposure per minute of downtime, including chargebacks, listing restrictions, and contract termination risk.
Predictive Prevention 4-12 Weeks Ahead
AI surfaces failure signals weeks before breakdown — turning the typical $30K–$42K reactive event into a planned $3K–$5K scheduled repair during off-peak hours, eliminating every cost multiplier line item.
Emergency Parts Premium Elimination
AI verifies parts inventory at predictive alert time, triggering procurement during the 1–4 week prediction window — eliminating the 2–3x emergency parts premium that reactive repairs always carry.
AI-Powered Shift Logbook for ROI Continuity
iFactory's Shift Logbook captures every prevented failure, completed repair, and cost-avoided event with AI summaries — building a continuous audit trail of measurable ROI defensible at every operational review.
CFO-Ready ROI Dashboards
Real-time ROI dashboards aggregate prevented failures, downtime hours avoided, SLA penalty exposure eliminated, and labor recovered — generating board-ready financial reports without manual data assembly.
The Six True Cost Categories Behind Every Warehouse Downtime Hour
Operations leaders calculating downtime cost from throughput alone underestimate the true financial impact by 60 to 70%. The following breakdown reflects actual cost categories documented across warehouse delivery deployments — and shows where AI analytics pays back fastest by eliminating each line item before it triggers.
| Downtime Cost Category |
Typical Reactive Cost (Per Hour) |
AI-Prevented Outcome |
| Direct Throughput Revenue Loss |
$8K–$25K per hour on primary sort/conveyor — calculated from parcels delayed × margin per parcel × cascade factor across downstream lines. |
Failure detected 4–12 weeks ahead. Repair scheduled in planned downtime window. Throughput loss eliminated entirely. |
| SLA Penalty Exposure |
$3K–$15K per hour on B2B/marketplace contracts. JIT delivery misses can trigger $8K–$50K single-event penalties. Repeated misses risk listing termination. |
AI protects on-time shipping SLAs at 99%+ by ensuring vision systems, sortation, and dock equipment maintain operational state through peak shifts. |
| Emergency Repair Premium |
$2K–$5K per hour — emergency labor at 2–3x standard rate, expedited parts at 2–3x standard cost, vendor service call premiums. |
Parts procurement triggered during 1–4 week predictive window. Scheduled labor at standard rate. Emergency premium eliminated. |
| Recovery Overtime Authorization |
$1.5K–$4K per hour — second-shift overtime to catch up missed picks; supervisor escalation hours; weekend recovery shifts. |
Planned-window repairs require no overtime catch-up. Recovery shifts not authorized. Labor cost stays at baseline. |
| Expedited Shipping to Protect Promises |
$2K–$8K per hour — ground service replaced with overnight or expedited carrier service to maintain customer delivery windows. |
No fulfillment delay = no shipping upgrade. Customer delivery promises met with standard service economics. |
| Customer Churn and Reputation Risk |
5–15% of annualized customer value on repeated incidents. Outages can drive 15–40% churn at high-value B2B accounts. |
Sustained reliability protects customer relationships. Documented uptime supports contract renewal pricing power. |
Your Downtime Cost Is Likely 2.5x Higher Than You're Calculating. AI Eliminates the Multiplier.
iFactory AI quantifies every downtime cost category in real time, prevents failures 4 to 12 weeks ahead, and protects SLA exposure across warehouse delivery operations — integrated with existing CMMS, WMS, and ERP in 6 to 8 weeks.
Book a Demo to receive a true downtime cost assessment for your operation.
How iFactory AI Quantifies and Eliminates Warehouse Downtime Cost
iFactory follows a structured deployment process that delivers live downtime cost visibility within the first two weeks and full predictive prevention by week eight. Each stage has defined deliverables that quantify ROI in dollar terms — not abstract uptime percentages.
Weeks 1–2
Downtime Cost Baseline and ROI Modeling
Historical downtime events ingested from CMMS, WMS, and ERP systems. AI computes true hourly cost per asset including throughput, SLA exposure, parts premium, overtime, and shipping upgrade categories. Baseline ROI model established before any sensor deploys. Digital Shift Logbook activated.
Weeks 3–4
IoT Sensors and Live Cost-Prevention Tracking
Wireless IoT sensors retrofit-mounted on highest-cost-impact assets — conveyors, sortation, AS/RS, dock equipment, refrigeration. AI begins anomaly detection. ROI dashboard tracks the first prevented failure event, attributing cost-avoided dollars in real time.
Weeks 5–6
Predictive Models Active and SLA Protection Live
Failure prediction models surface emerging faults 4–12 weeks ahead. SLA exposure modeling activates for B2B and marketplace contract terms. Parts procurement triggered during predictive window to eliminate emergency premium. AI work orders flow into existing CMMS.
Weeks 7–8
CFO-Ready ROI Reports and Multi-Site Rollout
Board-ready ROI dashboards live with prevented failures, hours avoided, SLA penalty exposure eliminated, and labor recovered. Multi-site rollout templates configured for additional warehouses with ROI baselines tailored to each facility's operational economics.
MEASURABLE OUTCOMES FROM WEEK 4: FIRST PREVENTED FAILURE TYPICALLY COVERS ANNUAL PLATFORM COST
Warehouse operators completing iFactory's 6 to 8 week deployment report the first AI-prevented failure event within 60–90 days — at $30K–$42K true cost per prevented hour, that single event typically covers the annual platform cost. By month 18, deployments report 10:1 to 30:1 ROI ratios with documented SLA penalty exposure eliminated, emergency parts premium reduced 80%+, and overtime authorization cut 60–75%.
60-90 days
Time to first AI-prevented failure covering annual platform cost
35-65%
Unplanned downtime reduction within first 12 months
80%+
Reduction in emergency parts procurement premium spend
Warehouse Delivery AI ROI: Use Cases from Live Deployments
The following outcomes are drawn from iFactory deployments at operating distribution centers and fulfillment hubs. Each use case reflects 9 to 12 month post-deployment financial performance with documented prevented-cost line items.
A national 3PL deployed iFactory across 18 sortation drives at its primary fulfillment hub. Within 48 hours of sensor activation, the AI flagged bearing fatigue on Drive 7 — 16 days ahead of probable breakdown. The operator's CFO requested a true cost projection: at 80K parcels per peak shift, an unplanned Drive 7 failure during peak hours would generate $14K direct throughput loss, $8K B2B SLA penalty exposure on three priority contracts, $3.2K emergency repair premium, $2.4K recovery overtime, and $4.1K expedited shipping spend — total true cost projected at $31.7K per hour, with average outage duration of 4.5 hours. The scheduled planned-window repair completed during off-peak Sunday for $2.8K total. Net cost avoided: $140K from a single prevented event — more than covering the annual iFactory platform cost in the first 48 hours of monitoring.
Book a Demo to see ROI calculation applied to your facility.
$140K
True cost avoided from single prevented sortation failure
48 hrs
Time to first ROI-positive event from sensor activation
$2.8K
Planned-window repair cost vs $31.7K/hr reactive baseline
A regional distribution operator with 12 facilities and 340 critical assets deployed iFactory across the network with full true-downtime-cost modeling. Pre-deployment baseline established annual unplanned downtime at 9,200 hours network-wide, with average true hourly cost of $18,400 across asset classes — total annual exposure of $169M. Within 12 months, predictive prevention reduced unplanned downtime 47%, eliminated emergency parts premium by 84%, reduced overtime authorization by 71%, and protected $14.2M in SLA penalty exposure. Total documented value capture: $89M annually. ROI ratio at month 18 reached 22:1 on platform investment. CFO-ready monthly dashboards generated automatically from operational data.
Book a Demo to receive ROI modeling for your network.
$89M
Annual documented value capture across 12-facility network
22:1
ROI ratio achieved by month 18 on platform investment
47%
Network-wide unplanned downtime reduction within 12 months
An e-commerce operator running fulfillment for 14 major retail brands was paying $3.2M annually in SLA chargebacks — driven by missed dispatch windows, perfect-order-rate misses, and on-time-shipping breaches across the contract portfolio. Each penalty event additionally triggered listing visibility reduction at marketplaces, compounding revenue impact beyond the direct chargeback. iFactory deployed full SLA exposure modeling integrated with WMS dispatch data, predictive analytics on critical assets, and AI work order automation. Within 9 months, SLA chargebacks dropped 78% to $704K annually, marketplace ranking restored across all 14 accounts, and three contracts renegotiated upward based on documented uptime performance. Net SLA-related benefit: $2.5M annually plus revenue uplift from improved marketplace visibility.
Book a Demo to see SLA exposure modeling applied to your contract portfolio.
$2.5M
Annual SLA penalty exposure eliminated within 9 months
78%
Reduction in marketplace and B2B chargeback spend
14/14
Retail brand contracts with restored marketplace ranking
Expert Perspective: Why CFOs Underestimate Downtime Cost — and How AI Reveals the Real Number
Industry Review — Warehouse Delivery Finance Perspective
"When I started running warehouse operations, we calculated downtime cost as throughput × margin. That number was always wrong by a factor of three. The hidden costs — SLA penalties, expedited shipping to recover, overtime authorization, emergency parts at triple normal cost, customer churn risk — all of these compound on top of the throughput line. CFOs who only see the throughput number consistently under-invest in reliability programs because the apparent ROI looks borderline. The operators who unlock real ROI from AI are the ones who quantify all six cost categories before evaluating the platform. Once you see the actual hourly number, the AI investment case writes itself."
Warehouse Delivery Operations CFO — Multi-Site Distribution Network (provided via iFactory deployment reference)
This perspective aligns with what financial leaders consistently report across iFactory deployments: the highest-ROI gains come from quantifying true downtime cost before evaluating any analytics investment. AI builds that quantification automatically and proves the case in operational dollars, not vendor projections. Book a Demo to speak with iFactory's warehouse delivery ROI specialists about your operational economics.
Quantified ROI. Real-Time Cost Prevention. Live in 6 to 8 Weeks.
iFactory gives warehouse operators true-cost downtime modeling, predictive failure prevention, SLA exposure protection, emergency premium elimination, and CFO-ready ROI dashboards — integrated with existing CMMS, WMS, and ERP without rip-and-replace. Results measurable within 30 days.
Conclusion: AI Pays Back Fastest When True Downtime Cost Is Calculated Correctly
The case for AI analytics in warehouse delivery operations is not built on uptime percentages or theoretical efficiency gains — it is built on the dollars that downtime actually costs and the dollars that prevention captures. With true hourly downtime cost running 2.5 to 3.5 times initial production-only estimates, single prevented failure events covering annual platform cost in under 90 days, and documented ROI ratios reaching 10:1 to 30:1 by month 18, the financial case for AI deployment is no longer marginal. The operators capturing maximum return are those quantifying all six cost categories before evaluating any platform, then measuring prevented dollars in real time as deployment progresses.
iFactory's platform delivers the specific capabilities warehouse delivery finance teams require: real-time downtime cost quantification across throughput, SLA, labor, parts, shipping, and churn categories; predictive failure prevention 4 to 12 weeks ahead; SLA penalty exposure modeling tied to actual contract terms; emergency parts premium elimination through predictive procurement; AI-powered Shift Logbook continuity; and CFO-ready ROI dashboards — integrated with existing CMMS, WMS, and ERP through OPC-UA, MQTT, BACnet, Modbus, and REST APIs. The 6 to 8 week deployment program means measurable ROI begins within weeks. Book a Demo to receive a true downtime cost assessment specific to your operation.
Frequently Asked Questions About Warehouse Delivery AI ROI
How quickly does iFactory deliver measurable ROI in warehouse delivery operations?
Most warehouses see the first AI-prevented failure within 60–90 days of deployment — an event that at $30K–$42K true cost per hour typically covers the annual platform investment immediately. ROI ratios compound to 10:1 to 30:1 by month 18 as more assets onboard and prevention accumulates across the operation.
Why is true downtime cost higher than the throughput-only calculation?
Throughput loss accounts for only 30–40% of true downtime cost. The remaining 60–70% comes from SLA penalty exposure (15–25%), emergency repair premium (10–15%), recovery overtime (8–12%), expedited shipping to protect customer promises (10–18%), and customer churn risk on repeated incidents (5–15%). AI eliminates each category by preventing failures before they trigger.
Will AI work with our existing CMMS, WMS, and ERP without replacement?
Yes. iFactory operates as an intelligence layer on top of existing systems via OPC-UA, MQTT, BACnet, Modbus, and REST APIs. AI-generated work orders flow into your current CMMS; SLA exposure modeling integrates with WMS dispatch data; ROI dashboards pull cost categories from ERP financial systems — all without rip-and-replace.
How does AI specifically protect B2B and marketplace SLA contracts?
AI tracks SLA contract terms — on-time shipping rates, perfect order rate, pick accuracy — and quantifies penalty exposure per minute of asset degradation. Predictive prevention ensures critical sortation, conveyor, and dock equipment maintain operational state through peak shifts, protecting the 99%+ on-time shipping standards required by major marketplace and retail contracts.
How does the AI-powered Shift Logbook contribute to ROI measurement?
The Shift Logbook auto-captures every AI-prevented failure, completed predictive repair, and cost-avoided event with AI-generated summaries and photo evidence. This builds a continuous, defensible audit trail of measurable ROI — supporting CFO review, board reporting, and annual operational improvement documentation without manual data assembly.
Deploy AI ROI Analytics for Warehouse Delivery in 6 to 8 Weeks.
iFactory delivers true-cost downtime modeling, predictive failure prevention, and CFO-ready ROI dashboards — integrated with existing CMMS, WMS, and ERP.
Single prevented failure covers annual platform cost
10:1 to 30:1 ROI within 18 months
35–65% unplanned downtime reduction