A third-party logistics operator managing 2,400 daily delivery routes across 18 distribution centres runs performance reviews every month by pulling spreadsheets from three separate systems WMS, TMS, and the fleet telematics portal and spending two days reconciling data before the review meeting. The operations director sees last month's on-time delivery rate, the warehouse manager sees pick accuracy from a different report, and the fleet supervisor sees fuel efficiency from yet another source. No two reports agree on the same metric because they are measuring different definitions from different time windows on different data sets. The review ends with action items assigned to email threads that no one revisits until the next review cycle. This is not a performance review problem. It is an analytics architecture problem. A warehouse delivery operation running 50,000+ shipments per week generates telemetry across conveyors, sortation systems, AMR fleets, dock equipment, and delivery vehicles each producing data in its own schema, on its own clock, through its own interface. The operations that consistently hit 97%+ on-time delivery and renew contracts at favourable terms are not running better reviews. They have connected their data streams into a single analytics layer that generates performance insights continuously, not retrospectively. AI analytics for warehouse delivery operations replaces the monthly spreadsheet reconciliation with a live performance scorecard that correlates equipment health, throughput rates, pick accuracy, dock turnaround times, and delivery SLA compliance in one unified view and updates every cycle, not every month.
AI WAREHOUSE DELIVERY PERFORMANCE ANALYTICS
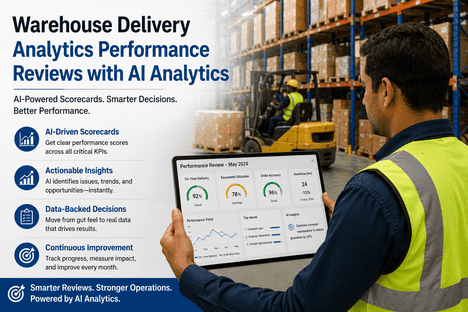
Stop Reconciling Spreadsheets. Start Reviewing Performance From Live Data.
iFactory AI's warehouse analytics platform ingests data from WMS, TMS, fleet telematics, dock systems, and equipment sensors delivering unified performance scorecards that connect equipment health to delivery SLA outcomes across every shift.
97%+
On-time delivery rate achieved by warehouses using AI analytics vs 80-91% for reactive operations
58%
Reduction in unplanned forklift and dock equipment downtime from AI predictive maintenance
33%
Lower pick error rate with AI Vision quality validation vs manual inspection processes
30-90
Minutes of pre-miss SLA warning generated by AI analytics before a carrier cutoff is breached
THE ANALYTICS ARCHITECTURE GAP
Why Monthly Performance Reviews Miss What Analytics Should Have Caught Weeks Ago
A warehouse delivery operation's performance review cycle typically runs on a 30-day lag. The on-time delivery rate reported in this month's review reflects last month's operations — data that was already three weeks old when the planner extracted it from the WMS. The equipment uptime figure comes from a separate CMMS report that counts downtime differently. The driver scorecard aggregates telematics data from a fleet portal that calculates fuel efficiency on a different time boundary than the TMS uses for route completion. Each metric is directionally correct. None of them align. The operations team spends the review meeting reconciling numbers instead of deciding what to improve. This is the analytics architecture gap — disconnected systems producing incompatible performance data that cannot be aggregated into a single operational truth. AI analytics closes this gap by placing a common data and model layer between every source system and every performance metric, ensuring that on-time delivery rate, equipment OEE, pick accuracy, and driver score are computed from the same data on the same clock and displayed in the same view.
D
Data Unification Layer
Cross-system signal consolidation
Source Systems
WMS — order throughput, pick rates, inventory accuracy, cycle times
TMS — route completion, carrier performance, on-time delivery, detention
Fleet Telematics — GPS tracking, fuel consumption, driver behaviour, idle time
Dock PLCs — leveller cycles, door utilisation, vehicle turnaround time
CMMS — equipment health scores, PM compliance, downtime history
IIoT Sensors — conveyor bearing vibration, motor temperature, belt alignment
AMR Fleet Controllers — robot battery health, route efficiency, mission completion rate
Key Requirement
All streams normalised to a common time axis and facility ontology — eliminating the reconciliation overhead that consumes 40-60% of performance review preparation time
F
Performance Metric Engine
AI-computed KPI alignment
Unified KPIs
On-time Delivery Rate — computed from dock departure timestamp + route ETA vs carrier cutoff, using TMS and telematics data on the same clock
Equipment OEE — availability, performance, quality across conveyors, sorters, dock levellers, and forklifts, linked directly to delivery SLA impact
Pick Accuracy — AI Vision-validated pick vs order match rate, trended by shift and operator
Dock Turnaround Time — vehicle arrival-to-departure, correlated with equipment health and labour allocation per bay
Fleet Efficiency Score — blended metric combining fuel performance, route adherence, idle reduction, and on-time stop completion
Perfect Order Rate — delivered on time, complete, undamaged, with accurate documentation
Key Requirement
Every KPI computed from the same unified data stream — eliminating the metric misalignment that undermines review accuracy and action assignment
M
AI Model Layer
Predictive and prescriptive analytics
Models Deployed
SLA Risk Prediction — 30-90 minute advance warning of carrier cutoff breaches, correlating throughput rate, equipment health, and dock congestion in real time
Equipment Degradation Forecasting — anomaly detection on IIoT sensor streams predicting conveyor bearing, motor, and hydraulic failures 2-6 weeks before functional failure
Route Completion Optimisation — ML models trained on historical route, traffic, weather, and driver data to predict ETA windows and flag at-risk routes within 15 minutes of departure
Labour Demand Forecasting — shift-level workload prediction using order intake, seasonality, and equipment availability signals
Cross-System Cascade Detection — multi-agent AI correlating signals across conveyor, robotics, dock, and dispatch systems to detect failure cascades before they reach delivery commitments
Key Requirement
Models trained on facility-specific operational data with continuous retraining — generic industry models underperform by 30-50% compared to site-calibrated deployments
O
Review & Automation Output
From analytics to operational action
Output Capabilities
Live Performance Scorecard — unified view of all KPIs updated per cycle, not per review cycle; trend lines, anomaly flags, and SLA status at a glance
Automated Performance Reports — weekly and monthly SLA compliance documents generated from live data with no manual extraction; on-time delivery, pick accuracy, equipment uptime, and perfect order rate captured with full timestamp and event-level granularity
Action Assignment Engine — prescriptive recommendations surfaced from AI models with specific owner, deadline, and expected KPI impact; tracked to closure across review cycles
Contract Performance Documentation — per-client SLA tracking for 3PLs managing multi-client portfolios; precise attribution and defensible reporting across all contract accounts simultaneously
Shift Intelligence — structured digital Shift Logbook capturing equipment faults, near-miss events, incomplete inspections, and open corrective actions; asset-linked, timestamped, carried forward automatically
Key Requirement
Review data must be actionable — not just visible. Every metric should link to a specific operational lever, responsible owner, and measurable improvement target
TURN PERFORMANCE DATA INTO DELIVERY RESULTS
Your Monthly Review Should Validate Decisions, Not Reconcile Numbers. iFactory Makes That Possible.
iFactory connects WMS, TMS, fleet telematics, dock systems, and equipment sensors into one analytics platform — generating unified performance scorecards, automated reports, and prescriptive actions that every operations leader can act on. Schedule a facility data alignment assessment with the team today.
THE AI PERFORMANCE REVIEW CYCLE
How Continuous AI Analytics Replaces the Monthly Data Reconciliation
The value of AI analytics for warehouse delivery performance reviews is not in generating a prettier dashboard. It is in restructuring the review cycle itself — turning the monthly retrospective into a forward-looking operational control process. Instead of spending 40 hours reconciling data from three systems before the review, the operations team opens a live scorecard that already aligns every metric. Instead of debating whose number is correct, the team discusses which action items are on track and which need escalation. Instead of assigning tasks that drift until the next review, the system tracks closure automatically and surfaces overdue items before the next meeting. The cycle below shows how a continuous AI analytics layer transforms each phase of the performance review process — from data collection through action tracking.
1Live Data Collection
Multi-system data ingestion from WMS, TMS, fleet telematics, dock PLCs, IIoT sensors, AMR controllers, and CMMS — all normalised to a common time axis and facility ontology. No manual extraction, no spreadsheet assembly, no reconciliation. Data is collected per cycle, not per review — every transaction, every sensor reading, every event captured continuously.
2AI Metric Computation
All KPIs computed from the unified data stream using consistent definitions and time boundaries. On-time delivery rate, equipment OEE, pick accuracy, dock turnaround time, fleet efficiency score, and perfect order rate are calculated on the same clock from the same source data. Anomaly flags are generated automatically — any metric deviating beyond configured thresholds is surfaced with root-cause classification before the review meeting begins.
3Automated Report Generation
Weekly and monthly SLA compliance reports generated from live data with full timestamp and event-level granularity. On-time delivery rate, pick accuracy, equipment uptime, and perfect order rate documented continuously. For 3PLs, per-client SLA performance is tracked separately with precise attribution. Reports are available on demand and distributed automatically to stakeholders — no one prepares a review packet.
4Review & Decision
Operations leadership reviews a single unified scorecard rather than reconciling three different reports. Discussion focuses on trend direction, anomaly root causes, and action item progress — not data accuracy. AI-generated prescriptive recommendations are presented alongside each flagged metric, specifying the operational lever, responsible owner, expected KPI impact, and recommended deadline for closure.
5Action Tracking & Closure
Action items from the review are recorded in the platform with specific owners, deadlines, and linked KPIs. The system tracks closure automatically — surfacing overdue items, flagging actions where the linked KPI has not moved in the expected direction, and generating escalation notifications before the next review cycle. The loop closes when the next cycle's unified scorecard reflects the impact of actions taken.
INDUSTRY DEPLOYMENTS
Warehouse Delivery Operations Running AI-Powered Performance Analytics Today
The following deployments represent the current operational frontier of AI-driven performance analytics in warehouse delivery operations — facilities that have replaced monthly spreadsheet reviews with continuous AI analytics and documented measurable improvements in SLA performance, equipment uptime, and operational efficiency.
FM Logistic — AI Routing & Performance Analytics
Poland — Production
3PLWarehouse
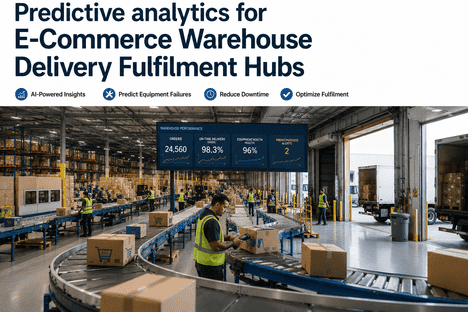
FM Logistic deployed an evolutionary AI routing system across an eight-football-field warehouse with 17,700+ picking locations. The AI generated a new routing algorithm that improved warehouse travel efficiency by 10.4% over a previously optimised human-engineered baseline — eliminating 15,000+ kilometres of warehouse travel per year at full operational scale. The implementation used Google Cloud's AlphaEvolve agent, which generated and refined routing algorithms autonomously, producing clear, human-readable rules that warehouse teams review and adjust as operational needs change. Core improvements included density-based starting point selection, two-step distance simulation filtering for real-time speed, and flexible route building that returns unfilled capacity to the main pool. FM Logistic is extending the approach to other high-volume e-commerce facilities and exploring AI-driven product placement to further cut travel distances.
Blue Yonder — AI Agent Warehouse Decisioning
Global — Production
AI AgentsDecisioning
Blue Yonder announced its Model Training Factory built on NVIDIA Nemotron, producing specialised AI agents for high-frequency warehouse decisions — WMS allocation shorts, inventory exceptions, due-time urgency, and yard-to-receiving trailer coordination. These agents weigh hundreds of trade-offs in seconds where a human typically considers a handful, running continuously across every warehouse every day. The first production models target the decisions that directly drive on-time performance, inventory shortages, and order cycle times. Blue Yonder's CEO described the approach as "owned intelligence, not rented intelligence" — supply chain models trained on the workflows, telemetry, and decision logic that actually run a warehouse, producing purpose-built agents at the speed, precision, and cost that autonomous supply chain operations demand.
iFactory AI — Multi-Site Warehouse Analytics
EU — Production Deployments
AnalyticsAI
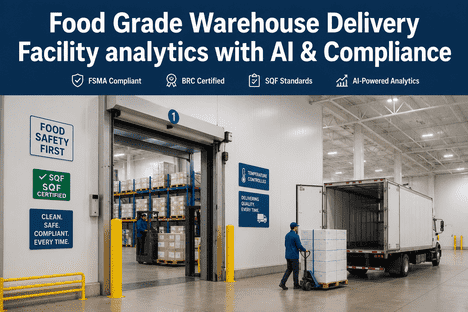
iFactory AI's platform deployed across German and EU-regulated warehouse and delivery operations unified WMS, fleet telematics, dock PLCs, and CMMS data into a single on-premise analytics appliance. Facilities documented a 58% reduction in unplanned forklift downtime through predictive maintenance alerts generated from continuous IIoT sensor monitoring. DGUV and VdS compliance audit packages — previously requiring days of manual reconciliation — are generated on demand in under two minutes with zero corrective notices. The platform's pre-miss SLA alert system, correlating throughput rate, equipment health scores, and carrier cutoff windows, provides 30-90 minute early warnings before a breach can cascade into a missed delivery commitment. Real-time fleet efficiency scoring, automated SLA compliance reporting, and structured digital Shift Logbook intelligence eliminated the cross-system data reconciliation that previously consumed 40-60% of performance review preparation time.
Shipsy — Smart Depot Operations
APAC — Production, 164 Hubs
DepotOrchestration
Shipsy's Smart Depot Operations platform deployed across 164 hubs orchestrated the linehaul-to-last-mile handoff through event-driven choreography of sort, staging, load, and dispatch operations. Throughput telemetry — packages per hour, cage-to-van cycle time, dock utilisation, loader productivity — is measured per shift, per bay, per wave with cutoff-miss predictions surfaced 60-90 minutes before they happen. A depot-health score per shift combines throughput, accuracy, cutoff adherence, and safety events into a single number rolling up to regional ops leadership. The operator documented 20+ hours per week of coordination time reclaimed per hub, 20% driver productivity gains, and autonomous depot operations across the network. A Western European parcel operator with 50%+ national market share lifted delivery-window adherence from ~30% to 90%+ with coordinated depot-to-last-mile handoff.
OUTCOMES & DATA
Measurable Performance Improvements From AI-Powered Delivery Analytics
97%+
On-time delivery rate achieved by AI-analytics enabled facilities
iFactory deployments across EU warehouse and delivery operations (2026)
10.4%
Warehouse travel efficiency improvement from evolutionary AI routing
FM Logistic deployment — 15,000+ fewer km travelled per year (2026)
58%
Reduction in unplanned forklift and dock equipment downtime
iFactory predictive maintenance — multiple German logistics facilities
30-90
Minutes of pre-miss SLA warning from AI cross-system correlation
iFactory SLA risk engine — live alert generation across shifts
60-90
Minutes of cutoff-miss prediction from throughput telemetry
Shipsy Smart Depot Operations — 164 hub deployments
40-60%
Reduction in performance review prep time from data unification
iFactory analytics platform — measured across multi-site operations
FREQUENTLY ASKED QUESTIONS
What Warehouse Operations Leaders Ask About AI-Driven Performance Analytics
How does AI analytics improve the accuracy of warehouse delivery performance reviews?▼
AI analytics improves review accuracy by unifying data from WMS, TMS, fleet telematics, dock systems, and equipment sensors into a single data layer where all KPIs are computed on the same clock and from the same source data. Traditional reviews reconcile numbers from disconnected systems that use different definitions, time windows, and aggregation rules — a discrepancy that typically consumes 40-60% of review preparation time and produces metrics that cannot be reliably compared across departments. AI analytics eliminates this reconciliation overhead entirely and ensures that every metric in the review — on-time delivery rate, equipment uptime, pick accuracy, dock turnaround, fleet efficiency — reflects the same operational reality.
What systems does the AI analytics platform integrate with?▼
iFactory's warehouse analytics platform integrates with WMS (Manhattan, Blue Yonder, SAP EWM, native stacks), TMS (Blue Yonder, Oracle, Shipsy, native), fleet telematics (GPS, OEM telematics, fuel card systems), dock PLC networks (levellers, restraints, seals, door actuators), IIoT sensor platforms (conveyor vibration, motor temperature, bearing monitoring), AMR fleet controllers (OPC-UA, robot APIs), CMMS systems (maintenance work order, PM compliance data), and carrier TMS portals for real-time delivery status and ETA feeds. The platform connects to existing infrastructure without replacing, modifying, or disrupting any underlying system. For a detailed integration assessment specific to your facility's system stack, Book a Demo with iFactory's solutions engineering team.
How long does it take to deploy AI-powered performance analytics in a warehouse delivery operation?▼
A typical deployment runs 6-10 weeks from appliance installation to first live performance scorecard data. Week one covers appliance installation and connection to the three highest-priority data sources — typically the WMS, fleet telematics system, and dock PLC network. Weeks two through four cover metric configuration, unified KPI alignment, and initial data validation. Weeks five through six deploy the AI model layer — SLA risk prediction, equipment degradation forecasting, and automated report generation. Weeks seven through ten expand coverage to remaining data sources and tune alert thresholds with operations and maintenance teams. Most facilities begin generating unified performance scorecards within the first four weeks and have live SLA risk alerts active by week six. Contact iFactory's deployment team to discuss a specific timeline for your operation.
Can AI analytics generate SLA compliance reports for multi-client 3PL operations?▼
Yes. iFactory's platform supports per-client SLA tracking for 3PLs managing multi-client portfolios. Each client's performance — on-time delivery rate, pick accuracy, equipment uptime, perfect order rate, dock turnaround time — is tracked separately against contract-specific SLA targets and documented with full timestamp and event-level granularity. Reports are generated automatically from live operational data without manual extraction or spreadsheet assembly, providing the strongest available documentation for contract performance reviews, SLA dispute resolution, and renewal negotiations. Per-client performance data is isolated with strict access controls — a 3PL running a pharmaceutical client and a quick-commerce client from the same facility gets separate dashboards, separate audit trails, and separate reporting.
Does the AI analytics platform work with existing WMS, TMS, and fleet systems?▼
iFactory's platform is designed to integrate with existing infrastructure — not replace it. The analytics appliance connects to WMS, TMS, fleet telematics portals, dock PLC networks, IIoT sensor platforms, AMR controllers, and CMMS systems through standard OPC-UA, MQTT, API, and direct database connectors. All source data remains in the originating system; the platform reads data streams without modifying, replacing, or disrupting any existing workflow or infrastructure. For facilities transitioning away from a legacy system, the platform can absorb that system's data streams seamlessly as part of the migration. To discuss integration with your current system stack and receive a facility-specific deployment assessment, Book a Demo with iFactory's warehouse analytics team.
WAREHOUSE DELIVERY ANALYTICS PERFORMANCE REVIEW
Stop Reconciling Reports. Start Reviewing Performance From One Unified Scorecard.
iFactory AI connects WMS, TMS, fleet telematics, dock systems, equipment sensors, and CMMS into a single analytics platform — generating unified performance scorecards, automated SLA reports, and prescriptive actions that turn every review cycle into a forward-looking operational decision. Used by warehouse and delivery operations to achieve 97%+ on-time delivery, reduce performance review prep time by 40-60%, and eliminate cross-system data reconciliation entirely.