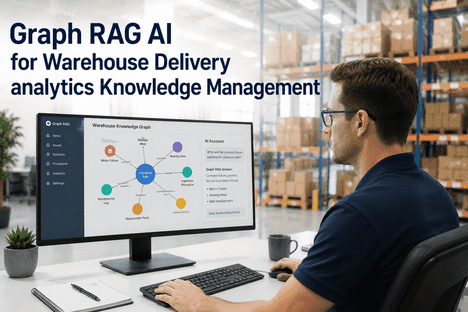
Graph RAG AI connects asset histories, failure patterns, and analytics procedures into a unified knowledge graph — giving warehouse technicians instant, relationship-aware answers to complex analytics queries. Where traditional document retrieval returns isolated text fragments, Graph RAG traverses the relationships between assets, maintenance events, delivery routes, and operational logs to surface answers that reflect how your warehouse actually works.
Graph RAG · Knowledge Graph AI · Warehouse Analytics Intelligence
Connect Every Asset, Failure Pattern, and Procedure Into One Intelligent Knowledge Graph.
iFactory AI's Graph RAG platform maps your warehouse and delivery operations data into a live knowledge graph — giving technicians and managers instant, relationship-aware answers without manual searching.
Why Standard RAG Fails Warehouse and Delivery Operations — The Three Core Gaps
Warehouse and delivery environments generate knowledge that is deeply relational: a conveyor belt failure is connected to its maintenance log, to the technician who serviced it last, to the spare parts consumed, to the delivery SLAs it affected, and to the three similar failures recorded in the past eighteen months. Standard RAG retrieves text fragments — it does not model these relationships. The result is answers that are technically sourced but contextually incomplete.
01
Fragment retrieval, not relationship reasoning
Standard RAG splits documents into chunks and matches query similarity. It cannot follow the chain from asset → failure history → repair procedure → parts availability → SLA impact. That chain is how warehouse technicians actually think — and Graph RAG is how AI replicates it.
02
Institutional knowledge locked in silos
Experienced warehouse engineers carry dependency knowledge in their heads: which conveyor feeds which sorter, which routes stress which vehicle components, which failure modes correlate across shifts. When they leave, that knowledge disappears. Graph RAG makes it machine-readable and permanently retrievable.
03
Slow resolution under operational pressure
During a delivery slot failure or conveyor stoppage, technicians cannot spend 20 minutes searching CMMS logs, maintenance PDFs, and shift handover notes. Graph RAG returns the relevant relationship chain — fault, history, resolution, parts — in a single query response, measured in seconds.
How Graph RAG Works in Warehouse and Delivery Operations: The Three-Layer Architecture
iFactory AI's Graph RAG implementation for warehouse and delivery operations is built on three interconnected layers that transform raw operational data into relationship-aware knowledge intelligence — continuously updated as new events, repairs, and delivery records flow into the system.
Layer 1 — Foundation
Operational Knowledge Graph Construction
Assets, events, routes, and procedures as connected nodes
Every asset in your warehouse — conveyors, forklifts, dock systems, sorting equipment, delivery vehicles — becomes a node in a live knowledge graph. Edges connect assets to maintenance records, failure events, technician actions, spare parts consumed, and the delivery slots or SLAs affected. iFactory AI ingests data from your existing CMMS, SCADA, WMS, and shift logbook systems to build this graph automatically — no manual ontology design required. The graph self-updates as new operational events occur.
Asset–failure relationship mapping
CMMS and WMS ingestion
Shift logbook integration
Continuous graph updates
Layer 2 — Retrieval
Graph-Traversal Query Resolution
Multi-hop reasoning across asset relationships
When a technician asks "What caused the last three failures on Conveyor Line 4, what parts were used, and is there stock available?", the Graph RAG engine traverses the knowledge graph across multiple hops — from asset node, to failure event nodes, to repair procedure nodes, to parts consumption nodes, to current inventory nodes — returning a single, relationship-complete answer. This multi-hop traversal is what separates Graph RAG from keyword search or standard vector RAG, which would return fragmented text without connecting the chain.
Multi-hop graph traversal
Natural language queries
Vector + graph hybrid search
Citation-linked responses
Layer 3 — Intelligence
Proactive Analytics and Insight Delivery
Pattern detection across historical and live graph data
Beyond answering queries, Graph RAG continuously monitors the knowledge graph for emerging patterns — recurring failure sequences on specific asset classes, delivery route stress correlations with vehicle maintenance intervals, parts consumption anomalies that precede unplanned downtime. These patterns are surfaced as proactive analytics alerts before they become operational incidents. The system learns from every new event added to the graph, improving relationship inference accuracy over the operational lifetime of the platform. Research across manufacturing and logistics environments shows teams using Graph RAG reduce knowledge search time by up to 70% compared to manual CMMS and document retrieval.
Failure pattern detection
Proactive anomaly alerts
Continuous graph learning
SLA impact tracing
What Graph RAG Intelligence Looks Like Across Warehouse Operations: Five Practitioner Use Cases
Graph RAG delivers value across every layer of warehouse and delivery operations — from a technician resolving an equipment fault at 2am to a logistics manager reviewing route performance patterns across a regional fleet. The following five scenarios illustrate how relationship-aware knowledge retrieval changes the speed and quality of operational decisions.
1
Equipment fault diagnosis at point of failure
A technician queries: "Conveyor Belt 7 stopped — what are the most likely causes based on its history?" The Graph RAG engine traverses the asset's maintenance record nodes, retrieves the three most similar failure events, surfaces the repair procedures used, confirms current parts availability, and returns a ranked resolution path — all in a single response, without the technician opening a single PDF or CMMS screen.
2
Delivery vehicle maintenance interval optimisation
A fleet manager queries: "Which vehicles on Route C are due for service within the next 14 days, and what failures have occurred on similar vehicles at this mileage?" Graph RAG traverses vehicle nodes, connects to mileage telemetry, service interval schedules, and historical failure events across the fleet — returning a ranked maintenance priority list with route impact context already attached.
3
Shift handover knowledge transfer
An incoming shift supervisor queries: "What unresolved issues were logged in the last 8 hours, which assets are affected, and what actions were taken?" Graph RAG connects shift logbook entries to asset nodes, open work order nodes, and parts request nodes — surfacing a structured, relationship-complete handover brief rather than requiring the supervisor to manually read through unstructured log entries.
4
Spare parts procurement intelligence
A procurement coordinator queries: "What parts were consumed in the last 90 days on dock equipment, and which items are at risk of stockout given current failure rates?" Graph RAG traverses parts consumption nodes linked to repair events, connects to current inventory levels, and cross-references failure frequency patterns — returning an intelligent reorder recommendation with failure-context justification attached.
5
SLA breach root cause analysis
A logistics analytics lead queries: "Three delivery slots were missed yesterday on Zone B — what were the contributing equipment or route factors?" Graph RAG traces the SLA breach events back through delivery vehicle nodes, route segment nodes, dock processing time records, and any maintenance events on the day — constructing a causal chain that a manual analyst would spend hours assembling.
What Operators Actually See: The Graph RAG Query Interface and Analytics Output
Graph RAG is only valuable if the intelligence reaches warehouse and delivery teams in a form they can act on under operational pressure. iFactory AI's platform delivers Graph RAG outputs through three interface layers, each designed for a different operational role.
Natural Language Query Console
For technicians and shift supervisors
Technicians type queries in plain language — no SQL, no filter navigation, no document search. The Graph RAG engine resolves each query by traversing the live knowledge graph and returns answers with full citation links showing which records, maintenance logs, or shift entries the response is drawn from. Every answer is auditable and explainable.
Example queries resolved:
→ "What failed on Sorter 3 last month and who repaired it?"
→ "Is there stock for the part that failed on Dock 6 last week?"
→ "What's the maintenance history on Vehicle 22 this quarter?"
Analytics Pattern Dashboard
For operations managers and analytics leads
Managers see graph-derived analytics patterns surfaced automatically — recurring failure sequences, parts consumption anomalies, route–vehicle stress correlations — without writing queries. The dashboard prioritises patterns by operational impact, linking each insight to the underlying knowledge graph relationships so managers can drill from summary to source in a single click.
Conveyor 4 bearing failures — 3× this quarter
HIGH
Route C vehicles — service interval correlation to late deliveries
MEDIUM
Dock seal part — consumption 40% above 90-day average
WATCH
"
Before Graph RAG, a technician resolving a repeating conveyor fault would spend 15 to 20 minutes searching the CMMS, reading through shift notes, and calling colleagues who remembered the last repair. Now the same query returns the full failure history, the resolution that worked, and the current parts stock in under 30 seconds. The knowledge was always there — Graph RAG made it instantly reachable.
— Head of Warehouse Operations, Regional Distribution Centre — 14 Years Industrial Logistics
How iFactory AI Builds the Warehouse Knowledge Graph: Data Sources and Integration
The quality of Graph RAG output depends on the richness of the knowledge graph it traverses. iFactory AI connects to the operational data sources that warehouse and delivery environments already produce — no new hardware, no manual graph construction, no specialist ontology engineering required.
CMMS and Maintenance Records
Work order history, repair actions, technician assignments, and parts consumed are ingested and linked to asset nodes in the knowledge graph. Past failure events become retrievable relationship chains, not buried document records.
Book a Demo to see CMMS integration in action.
Shift Logbook Entries
iFactory AI's Shift Logbook captures structured and unstructured shift notes, links them to the assets and events referenced, and integrates them into the live graph. Institutional knowledge recorded at shift handover becomes permanently machine-queryable, not lost in a folder of unstructured text files.
WMS and Delivery Systems
Warehouse management and delivery route data link order throughput, SLA performance, and route records to the equipment and vehicle nodes that supported or failed them. Graph RAG can then answer questions about the operational consequences of equipment events — not just the events themselves.
Sensor and IoT Streams
Real-time sensor data from conveyors, forklifts, dock systems, and delivery vehicles feeds the knowledge graph continuously — updating asset condition nodes so that Graph RAG queries always reflect current operational state, not historical snapshots from the last manual data entry.
Parts and Inventory Systems
Parts inventory levels, procurement history, and consumption rates link to asset failure nodes — enabling Graph RAG to answer both "what failed" and "what do we have available to fix it" in a single traversal, eliminating the gap between fault diagnosis and parts confirmation.
Maintenance Procedure Documents
Technical manuals, SOPs, and repair guides are ingested via vector embedding and linked to the relevant asset and failure mode nodes — so Graph RAG can retrieve not just what happened historically, but the authoritative procedure for resolving it, in the same query response.
Knowledge Graph Integration · CMMS · Shift Logbook · WMS · Sensor Data
Every System Your Warehouse Already Uses. One Intelligent Knowledge Graph.
iFactory AI connects your CMMS, shift logbook, WMS, and sensor streams into a live Graph RAG platform — giving your team instant, relationship-aware answers to any operational query, from any device, in seconds.
Conclusion
Warehouse and delivery operations generate enormous quantities of operational knowledge — maintenance records, shift notes, failure histories, delivery logs, parts consumption data. The problem is not that this knowledge does not exist. The problem is that it exists in fragments, disconnected across systems, impossible to query relationally at the speed operational decisions demand. Graph RAG solves this by turning those fragments into a connected knowledge graph that any team member can query in plain language, receiving answers that reflect not just isolated facts but the relationships between assets, events, procedures, and outcomes.
iFactory AI connects to your existing operational data systems to build this knowledge graph — integrating CMMS records, shift logbook entries, WMS data, sensor streams, and parts inventory into a unified, continuously updated Graph RAG platform. Book a Demo to see how Graph RAG works across your warehouse and delivery operations, or Talk to an Expert to discuss your specific knowledge management requirements.
Frequently Asked Questions
Your warehouse knowledge already exists. Graph RAG makes it instantly reachable by every technician, supervisor, and manager on your team.
iFactory AI builds your warehouse and delivery knowledge graph from your existing CMMS, shift logbook, WMS, and sensor data — no new hardware, no manual graph construction. Book a Demo to see Graph RAG working on operations like yours.