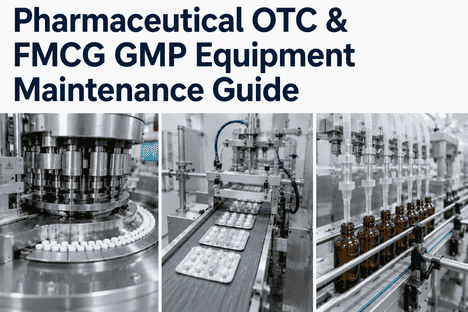
Pharmaceutical OTC and FMCG manufacturing operates at the convergence of two demanding standards consumer FMCG production volume and pharmaceutical GMP regulatory compliance. Tablet presses running at 300,000 tablets per hour, blister packing lines sealing 600 blisters per minute, and liquid filling lines operating under ISO 14644 Class 100,000 cleanroom conditions every piece of equipment must maintain validated state, documented calibration, and auditable maintenance records. In this environment, a failed tablet press punch can scrap an entire batch; a blister seal temperature drift can compromise product stability across thousands of units before detection. iFactory AI's CMMS and predictive maintenance platform delivers GMP-compliant equipment analytics purpose-built for OTC pharmaceutical and FMCG producers enabling real-time machine health monitoring, automated calibration tracking, and FDA 21 CFR Part 11-compliant documentation. Book a Demo to see how OTC manufacturers reduce deviation events by up to 58% while maintaining full GMP audit readiness.
Maintain GMP compliance across tablet presses, blister packers, and liquid filling lines with AI-driven equipment analytics, automated calibration management, and FDA 21 CFR Part 11-compliant documentation built for OTC pharmaceutical and FMCG manufacturing.
OTC pharmaceutical and FMCG manufacturing occupies a unique operational position it must deliver consumer FMCG production volumes while maintaining pharmaceutical-grade GMP compliance. Unlike pure pharmaceutical manufacturing where batch sizes are smaller and production schedules more flexible, OTC lines run continuous high-speed production schedules comparable to consumer packaged goods, creating maintenance pressure that directly conflicts with compliance requirements. A punch break on a tablet press running at 300,000 tablets per hour contaminates not just the current batch but creates a containment event requiring complete cleanroom re-certification. A blister sealing temperature drift produces packages that pass visual inspection but fail stability testing weeks later creating a recall risk that can cost millions.
Reactive maintenance in OTC manufacturing compounds these risks by creating undocumented repair events that violate GMP requirements for maintenance records. Time-based preventive maintenance replacing punches, changing HEPA filters, and recalibrating sensors on fixed schedules reduces compliance risk but creates unnecessary component waste and production interruptions. Predictive AI monitoring resolves this tension by providing condition-based maintenance scheduling that meets both GMP documentation requirements and production efficiency targets. Platforms like are designed for the dual demands of pharmaceutical compliance and FMCG production throughput.
$250K–$2M
Average cost of a single OTC product recall event (FDA enforcement data)
30–45%
Of GMP audit findings relate to equipment calibration and maintenance documentation gaps
85%
Of tablet press punch failures are predictable 2–4 weeks in advance with vibration analytics
15–25%
Maintenance cost reduction from GMP-compliant predictive vs. time-based PM programs
Critical Equipment Categories: GMP Analytics Capabilities and Failure Modes
Predictive GMP analytics in an OTC pharmaceutical plant applies different sensor types, data models, and anomaly detection algorithms to each equipment category based on product quality criticality and regulatory impact. The following breakdown covers the five critical equipment categories where iFactory AI's GMP-compliant analytics deliver the highest return in OTC and FMCG pharmaceutical operations.
Tablet Presses
Primary failure modesPunch tip wear, die bore erosion, compression roll bearing degradation, weight deviation drift
Tablet presses are the highest-throughput equipment in OTC solid dosage manufacturing. Punch tip wear is the dominant failure mode — as the punch tip geometry degrades, tablet weight variation increases until the batch exceeds specification limits. iFactory AI's platform monitors compression force signatures and punch vibration patterns to predict wear progression 2-4 weeks before tablet weight deviation reaches OOS thresholds, enabling scheduled punch changeovers during planned cleaning windows.
Blister Packers
Primary failure modesForming die wear, sealing jaw temperature drift, indexing drive misalignment, film tension variation
Sensor typesThermocouple arrays, vision inspection cameras, motor current sensors, tension load cells
AI analytics valueSeal integrity prediction, temperature zone trending, forming die wear estimation
GMP impactHigh — seal failure creates package integrity risk and stability failure potential
Blister packing lines for OTC products operate at speeds of 400–600 blisters per minute, with each blister requiring precise forming, filling, sealing, and coding. Sealing jaw temperature uniformity is the most critical process parameter — a 5°C drift in any zone can create channel leaks that compromise product stability. AI-driven temperature zone trending on each sealing jaw set detects heater band degradation and thermocouple drift before seal integrity is affected, enabling predictive replacement during scheduled format changeovers.
GMP impactCritical — fill weight deviation is a GMP critical process parameter
Liquid filling lines for OTC products — cough syrups, topical creams, oral suspensions — operate under strict GMP requirements for fill weight accuracy and container closure integrity. Nozzle valve wear is the dominant failure mode, progressively degrading fill accuracy until batches approach OOS limits. iFactory AI's platform integrates fill weight trend data from in-line checkweighers with pump cycle counts to predict nozzle and seal replacement intervals, maintaining fill weight Cpk above 1.67 while extending component life by 20–35%.
HVAC & Environmental Monitoring
Primary failure modesHEPA filter loading, AHU fan belt degradation, differential pressure drift, temperature/humidity excursion
AI analytics valueFilter loading prediction, fan RUL estimation, cleanroom classification risk scoring
GMP impactCritical — HVAC failure causes cleanroom declassification and production stoppage
Cleanroom HVAC systems are the invisible backbone of pharmaceutical GMP compliance. A HEPA filter loading beyond its rated pressure drop or an AHU fan bearing failure creates cleanroom classification drift that invalidates environmental monitoring data for all batches in progress. AI-driven filter loading prediction using differential pressure trending and particle count correlation enables proactive HEPA filter replacement during planned facility shutdowns rather than emergency cleanroom recertification events that cost $50K–$100K+ per occurrence.
Purified water and WFI systems are the most compliance-intensive utility systems in pharmaceutical manufacturing. RO membrane fouling progression — tracked through conductivity and pressure differential trends — is highly predictable and occurs on consistent cycles determined by feed water quality and system utilization. iFactory AI's correlates water system energy consumption with production output to detect efficiency degradation before water quality parameters approach alert limits. Automated sanitization cycle optimization reduces chemical and energy costs while maintaining USP <645> conductivity compliance.
How Predictive GMP Analytics Works in OTC Manufacturing: The Data Architecture
Understanding the technical architecture behind GMP-compliant predictive analytics is essential for quality assurance teams validating the system and for maintenance directors building the compliance case for investment. The architecture has four distinct layers, each with its own validation requirements and operational considerations. Platforms like iFactory AI integrate all four layers into a single validated view, eliminating the data silos that characterize point-solution approaches to pharmaceutical equipment monitoring.
01
GMP-Validated Sensor & Data Acquisition Layer
Continuous data collection from calibrated sensors on tablet presses, blister packers, liquid fillers, HVAC systems, and water systems. All sensors used for GMP-critical data acquisition must have documented calibration traceable to NIST standards with calibration schedules managed within iFactory AI's calibration management module. Data acquisition rates range from 1 Hz for process parameters to 10 kHz for high-frequency tablet press compression monitoring. This layer must comply with 21 CFR Part 11 requirements for electronic records and signatures.
21 CFR Part 11NIST traceable calibrationElectronic signatures
02
Edge Processing & GMP Feature Extraction
Raw sensor data is processed at the edge to extract condition indicators while maintaining data integrity for GMP audit trails: compression force signatures, sealing jaw temperature uniformity indices, fill weight running statistics, and filter pressure drop trends. Edge processing reduces the data validation burden for Part 11 compliance by processing and discarding raw transient data while retaining processed condition indicators as auditable data points. iFactory AI's edge layer is designed for deployment in ISO-classified cleanroom environments with appropriate materials and surface finishes.
Data integrity by designCleanroom-compatible hardwareAudit trail generation
03
AI Anomaly Detection & GMP Deviation Prediction
Machine learning models trained on historical deviation events, batch record data, and normal operating baselines continuously score incoming condition data for deviation probability. Models predict equipment-related deviation events — tablet weight OOS, blister seal failure, fill volume drift — with 48–96 hour advance notice, enabling QA teams to schedule preventive interventions before batches are affected. All model outputs are logged in a Part 11-compliant audit trail with user identification, timestamp, and action reason.
Deviation probability scoringBatch record correlationAudit trail logging
04
CMMS Integration & GMP Action Management
Deviation predictions and anomaly detections automatically generate GMP-compliant work orders in iFactory AI's work order management module with asset history, deviation risk classification, recommended intervention, and electronic signature routing. Maintenance planners and QA oversight receive actionable alerts — not raw sensor data — within their validated workflow tools. All actions are captured in the audit trail with full traceability to the condition data that triggered them, meeting both 21 CFR Part 11 requirements and EU GMP Annex 11 expectations for computerized system validation.
Automated GMP work ordersElectronic signature workflowEnd-to-end audit trail
See GMP-Compliant Equipment Analytics for OTC Manufacturing in Action
iFactory AI integrates sensor data, GMP deviation prediction, calibration management, and work order documentation into a single validated platform designed for OTC pharmaceutical and FMCG manufacturing. Book a demo to see how it works for tablet presses, blister packers, liquid filling lines, and pharmaceutical utility systems.
The matrix below maps the key GMP analytics capabilities against the five critical equipment categories in OTC pharmaceutical manufacturing, scored by monitoring maturity, GMP impact, and typical ROI. This provides quality assurance directors and maintenance engineers with a structured framework for prioritizing GMP analytics deployment.
Equipment Category
Vibration Analysis
Process Parameter Trending
Quality Metric Correlation
Calibration Management
Deviation Prediction
GMP Priority
Tablet Presses
Critical
Critical
Critical
High
High
Highest
Blister Packing Lines
Medium
Critical
High
High
High
Highest
Liquid Filling Lines
Medium
Critical
Critical
High
High
Highest
HVAC & Environmental
Medium
Critical
Medium
High
High
High
Purified Water & WFI
Low
Critical
High
Critical
High
High
Implementation Roadmap: Deploying GMP Equipment Analytics in an OTC Facility
Deploying GMP-compliant equipment analytics in an OTC pharmaceutical plant requires a structured approach that respects validated state requirements and cleanroom access protocols. The four-phase roadmap below reflects best practice for mid-to-large OTC and FMCG facilities deploying iFactory AI's GMP analytics platform.
01
GMP Asset Criticality Assessment and Validation Strategy
Rank all OTC manufacturing assets by GMP impact (direct product contact, critical process parameter influence, cleanroom classification dependency, regulatory finding history) and current calibration/maintenance coverage. Identify the top 20 equipment assets where GMP analytics will generate the highest compliance and production return. Map required sensor and data acquisition points to each asset and assess existing SCADA, BMS, and historian infrastructure. Most OTC facilities have 50–70% of the process data needed already being collected in batch records but not analyzed in a predictive context. Develop the computerized system validation plan (IQ/OQ/PQ) for iFactory AI platform deployment.
Duration: 4–6 weeksDeliverable: Asset criticality register + validation plan
02
Calibrated Sensor Integration and Data Pipeline Validation
Install or connect calibrated sensors on prioritized assets and establish validated data pipelines to the iFactory AI platform. Configure OPC-UA, MODBUS, or direct API connections with data integrity validation per 21 CFR Part 11 requirements. All sensors used for GMP-critical monitoring must have current calibration certificates loaded into iFactory AI's calibration management module with automated calibration due date tracking. This phase requires coordinated access between maintenance engineering, quality assurance, and IT — cleanroom access for sensor installation must be scheduled around production campaigns.
Duration: 8–12 weeksRisk: Medium — requires cleanroom protocol coordination
03
GMP Baseline Establishment and Model Validation (IQ/OQ)
Collect 8–12 weeks of normal operation data from validated sensors to establish equipment health baselines and train initial deviation prediction models. The platform must be validated through IQ (Installation Qualification) and OQ (Operational Qualification) protocols that document: data accuracy compared to reference standards, alarm and alert function testing, electronic signature and audit trail verification, and user access control testing. iFactory AI's validation documentation package includes pre-built IQ/OQ protocol templates that reduce the validation burden on QA teams while satisfying both FDA and EU GMP requirements.
Duration: 10–14 weeksOutput: Validated anomaly detection models per asset
04
Full Operational Integration and PQ / Continuous Improvement
Deviation predictions drive automated GMP work orders in iFactory AI's work order management system with electronic signature routing for QA review. Performance Qualification (PQ) is conducted over 90 days of live operation, documenting: deviation event reduction, false positive rate, calibration compliance improvement, and audit readiness verification. As deviation events and maintenance interventions are documented, models are retrained on facility-specific data under change control procedures. Quarterly GMP compliance reviews with QA document the validated state of the analytics platform and identify opportunities for continuous improvement. Book a Demo to see this GMP analytics workflow in operation for an OTC facility comparable to yours.
ROI Framework: Quantifying GMP Analytics Value in OTC Pharmaceutical Manufacturing
The ROI case for GMP equipment analytics in OTC pharmaceutical manufacturing is built on four primary value streams. Each can be quantified independently against your facility's specific cost structure, making the business case construction straightforward for procurement teams and quality directors with access to basic deviation, recall, and maintenance cost data.
Deviation Event Reduction
The primary GMP compliance ROI driver. At $10K–$50K per deviation investigation cost (QA labor, batch disposition testing, root cause investigation, CAPA implementation), preventing 10–20 deviation events per year returns the platform investment within 12–18 months. Predictive GMP analytics achieves this by providing 48–96 hour advance warning of equipment conditions that produce deviation events, enabling preventive intervention before batches are affected.
Annual value: $200K–$1M+ at mid-to-large OTC production scale
Calibration and Maintenance Cost Reduction
Eliminating unnecessary time-based component replacements and optimizing calibration schedules reduces direct parts, calibration service, and maintenance labor costs. Studies across comparable pharmaceutical operations document 15–25% maintenance cost reduction after GMP analytics deployment, with the largest savings in high-cost consumables like tablet press punches, blister forming dies, and HEPA filters that were previously replaced on fixed schedules regardless of actual condition.
Annual savings: 15–25% of GMP maintenance budget on monitored assets
Extended Equipment Validation Cycles
Continuous condition monitoring provides documented evidence that equipment remains in validated state between formal revalidation events. FDA guidance on process validation (2011) emphasizes ongoing monitoring over periodic revalidation — iFactory AI's platform provides the continuous data streams that support this approach. Facilities using GMP analytics have extended requalification cycles from 12 months to 24–36 months for monitored equipment, reducing validation costs and production interruption time while maintaining or improving documented state of control.
Validation savings: $100K–$500K per year in reduced requalification costs
FDA Audit Readiness and Risk Reduction
Continuous GMP documentation from equipment analytics provides immutable audit trails for all maintenance and calibration activities. FDA Form 483 observations related to equipment maintenance and calibration documentation gaps are among the most common findings and can trigger warning letters with significant business impact. iFactory AI's integrates equipment condition data directly with GMP documentation workflows, producing audit-ready records accessible within seconds during regulatory inspections.
Risk reduction: Quantified as inspection finding avoidance and CAPA cost elimination
Expert Review: Quality Director Perspective on GMP Analytics Deployment
"We manufacture 23 OTC SKUs across three tablet press lines and two liquid filling suites. Before deploying iFactory AI's GMP analytics platform, our deviation rate was averaging 14 events per quarter — mostly tablet weight OOS, blister seal failures, and fill volume discrepancies. Each deviation triggered a QA investigation that consumed 12–40 hours of cross-functional team time. We were spending more on deviation investigation than on the preventive maintenance programs that could have prevented them. The analytics platform gave us something we had never had before: a forward-looking view of equipment condition correlated to product quality risk. In the first six months after full deployment, our deviation rate dropped to 4 events per quarter. The three tablet press punch failures we avoided in that period — predicted by vibration signature changes 3–4 weeks in advance — would have been contamination events that halted production for 8–12 hours each while the cleanroom was re-certified. The platform paid for itself in deviation cost avoidance within the first year. My recommendation to QA and maintenance directors evaluating this investment: the technology works, the validation path is well-established with FDA and EU regulators, and your biggest implementation risk is underestimating the sensor calibration and data pipeline validation effort. Budget for it. Plan for it. The compliance and production returns are substantial."
Director of Quality AssuranceTop 10 OTC Pharmaceutical Manufacturer — U.S. Operations — 80+ SKUs — 23 Years Pharmaceutical Industry
Ready to Build the Business Case for GMP Equipment Analytics at Your OTC Facility?
iFactory AI provides the GMP-compliant predictive maintenance, calibration management, deviation prediction, and equipment analytics infrastructure that OTC pharmaceutical and FMCG manufacturers need to move from reactive compliance to predictive quality management. Contact our pharmaceutical solutions team or book a demo tailored to your facility's equipment profile and GMP requirements.
Conclusion: The Strategic Case for GMP Equipment Analytics in OTC Manufacturing
GMP equipment analytics is not an emerging technology for pharmaceutical manufacturing — it is a mature, validated capability that leading OTC producers have been using to reduce deviations, optimize maintenance, and maintain audit readiness for several years. The gap between early adopters and the majority of OTC and FMCG manufacturing facilities is narrowing rapidly, driven by regulatory expectations for continuous process verification, the declining cost of pharmaceutical-grade sensors, and the competitive pressure of production efficiency benchmarking against facilities that have already made the transition to predictive quality management.
The implementation decision is no longer whether GMP analytics delivers compliance and production value — the data on that is unambiguous. The decision is which platform provides the tightest integration between equipment condition monitoring, GMP deviation prediction, calibration management, and validated documentation workflow, and which implementation approach minimizes validation and deployment risk at your facility's specific equipment mix and regulatory exposure. iFactory AI is designed to answer both questions for OTC pharmaceutical and FMCG manufacturing: it connects sensor data, deviation prediction, calibration management, GMP work order execution, and electronic documentation in a single validated platform built for the regulatory complexity of pharmaceutical manufacturing. Book a Demo to see how iFactory AI's GMP analytics platform applies to your OTC facility's specific equipment categories, quality requirements, and compliance workflow.
Frequently Asked Questions
Tablet press GMP analytics typically requires vibration accelerometers on compression roll and turret bearings, compression force load cells (often already present for weight monitoring), tablet weight checker data integration, and punch temperature sensors. Blister packing lines require thermocouple arrays on each sealing jaw set, forming die temperature sensors, vision inspection camera data, and indexing drive motor current sensors. In OTC pharmaceutical environments, all sensors must have materials of construction compatible with cleanroom cleaning agents and FDA food-contact-grade materials where product contact is possible. iFactory AI's IoT data ingestion layer supports OPC-UA and MODBUS connections from major pharma equipment OEMs including Fette, Korsch, Romaco, Bosch, and IMA — many sensors required for predictive analytics are already installed on modern OTC equipment and only require data pipeline connection.
iFactory AI's platform is designed for 21 CFR Part 11 compliance from the architecture level. Key Part 11 features include: unique user login with password complexity requirements and automatic account lockout after failed login attempts, electronic signatures with distinct user ID and password for each signature event, binding of electronic signatures to records with indication of the signing meaning (author, reviewer, approver), complete audit trails that capture who performed what action, when, and what the previous and new values were, system-generated timestamps with date and time source validation, record retention and archival capabilities that prevent alteration or deletion of signed records, and authority checks to ensure only authorized users can access system functions. iFactory AI provides a validation documentation package including IQ/OQ protocol templates, user requirement specification (URS), functional risk assessment (FRA), and traceability matrix to support customer validation activities.
OTC pharmaceutical equipment typically requires 8–12 weeks of continuous validated operation data to establish a statistically valid GMP health baseline. This baseline period should capture at least two production campaign cycles for each equipment type to characterize normal variation across product changeovers and cleaning validation events. Initial deviation prediction models can be configured and generating alerts within 4–6 weeks using reference baselines from comparable equipment and batch record data, with accuracy improving significantly as facility-specific deviation correlation data accumulates. The GMP validation of the platform through IQ/OQ/PQ typically adds 4–8 weeks to the overall timeline but is essential for regulatory acceptance. iFactory AI's implementation team includes validation specialists who work directly with customer QA teams to streamline the validation process.
iFactory AI supports bidirectional integration with SAP PM, TrackWise, MasterControl, and other pharmaceutical QMS and CMMS platforms through standard REST API and middleware connectors with 21 CFR Part 11-compliant data transfer. Deviation predictions from the analytics platform can be configured to automatically create QMS deviation records in TrackWise or MasterControl with equipment ID, deviation risk classification, predicted impact, and recommended action. Calibration management data flows bidirectionally between iFactory AI and SAP PM for unified equipment records. Batch record correlation data can be exported to upstream MES/EBR systems for process performance review. Full integration details with Part 11-compliant data integrity verification are available through iFactory AI's support team.
For a mid-scale OTC facility with 3–5 production lines, the typical payback period for a full GMP analytics deployment is 12–24 months from validated operational deployment. This range reflects variation in current deviation rate, quality cost structure, and existing maintenance program maturity — facilities with documented deviation frequencies above 10 events per quarter typically achieve payback in 12–18 months. The deviation reduction value stream is the dominant ROI variable — each deviation prevented saves $10K–$50K in investigation costs alone, plus the production interruption and batch disposition cost avoidance. The minimum baseline needed to construct a reliable ROI projection is 12 months of historical deviation and OOS event data by equipment category, which iFactory AI's implementation team can help structure as part of the pre-deployment assessment. Book a Demo to see iFactory AI's GMP analytics ROI model applied to your facility's specific deviation and quality cost profile.