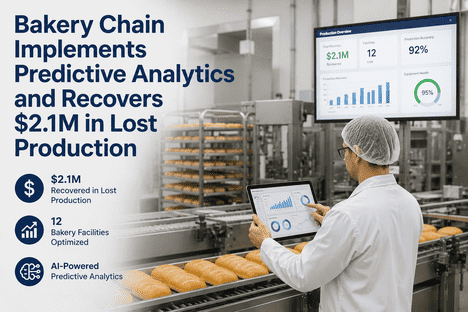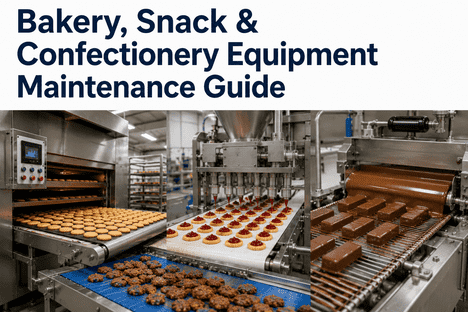
Multi-site bakery operations face a relentless challenge: equipment failures during peak production hours translate directly into lost revenue, wasted ingredients, and unfulfilled orders. This case study examines how a regional bakery chain with 15 locations deployed bakery predictive analytics across its entire network—monitoring deck ovens, spiral mixers, proofing chambers, and refrigeration systems to achieve measurable reductions in unplanned downtime and maintenance costs. The results challenge the assumption that predictive maintenance for bakeries is too complex or too expensive to deliver ROI at scale.
See How Bakery Chains Are Cutting Equipment Downtime by 60%
iFactory's bakery AI analytics platform delivers pre-configured oven monitoring, mixer analytics, and HACCP-aligned compliance workflows—purpose-built for multi-site bakery and food production operations.
The Multi-Site Bakery Challenge: Why Traditional Maintenance Was Failing
The bakery chain in this case study operates 15 retail and production locations across three states, producing an average of 4,200 SKUs per week across artisan breads, pastries, and specialty cakes. Prior to implementing bakery predictive maintenance, the company relied on a reactive maintenance model—equipment was serviced after failure or on fixed calendar schedules that bore no relationship to actual machine condition. The operational consequences were significant and measurable.
Over the 18 months preceding the analytics deployment, the chain logged 214 unplanned equipment failures. Of these, 61% involved deck ovens and spiral mixers—the two asset classes most directly tied to revenue-generating production capacity. Each major oven failure cost an average of $8,400 in combined repair labor, ingredient waste, and lost production output. Mixer failures averaged $5,900 per incident. The maintenance director estimated the company was spending 340% more on reactive repairs than proactive servicing would have cost for the same equipment.
Bakery AI Analytics Deployment: Equipment Monitored Across 15 Locations
The deployment covered 312 monitored assets across the 15-location network. Asset prioritization was based on revenue impact, failure frequency, and sensor installation feasibility. The team partnered with iFactory to conduct a pre-implementation equipment audit, categorizing assets into three tiers: critical production assets requiring full sensor instrumentation, secondary assets requiring partial monitoring, and low-risk assets managed through standard PM schedules. If your bakery operation faces similar equipment reliability challenges, you can Book a Demo to see how asset triage works in a food production environment.
Deck Oven Monitoring: Temperature Profiling and Burner Degradation Detection
Deck ovens represented the highest-priority monitoring target. Each oven received four type-K thermocouple sensors per deck zone, a combustion pressure sensor on gas-fired burner assemblies, and door seal integrity sensors measuring temperature leakage at door perimeters. The AI model established baseline temperature profiles for each oven across different load conditions—empty, partial, and full deck—and learned to detect burner degradation patterns up to 11 days before thermal inconsistency affected product quality. Calibration variance alerts fired when individual deck zones drifted more than ±4°F from learned thermal profiles, enabling proactive burner cleaning and element replacement before full failure.
Spiral Mixer Analytics: Motor Load, Vibration, and Bowl Bearing Health
Spiral mixer monitoring combined three sensor streams: motor current draw measured via non-invasive current clamps, vibration accelerometers mounted on bowl bearing housings, and tachometer signals from spiral hook drive assemblies. The bakery equipment monitoring AI model learned that rising current draw combined with high-frequency bearing vibration signatures reliably predicted bowl bearing failures an average of 8–14 days before collapse. This lead time was sufficient to schedule bearing replacement during non-production windows without disrupting daily output schedules.
Proofing Chamber and Refrigeration Monitoring
Proofing chambers and walk-in refrigeration units received temperature and humidity sensor arrays with door seal monitoring. The AI model detected compressor efficiency decline in refrigeration units by analyzing suction pressure, discharge pressure, and power consumption ratios—flagging units approaching 78% compressor efficiency for scheduled service before complete failure. Walk-in cooler door seal degradation was tracked through temperature recovery rate analysis following door-open events, generating seal replacement recommendations before food safety thresholds were breached.
Phased Rollout: How the Bakery Chain Deployed Predictive Analytics Across 15 Sites
The deployment followed a three-phase rollout designed to minimize production disruption while building organizational capability at each stage. The decision to pilot on three locations before full-chain deployment proved critical—it allowed model calibration on bakery-specific equipment behavior before scaling, reducing false alert rates at go-live sites by an estimated 52% compared to industry benchmarks for cold deployments.
Pilot Deployment — 3 Flagship Locations (Weeks 1–10)
Sensor installation, asset registry build, and initial model training conducted at the three highest-volume production sites. Data historians established for all monitored assets. Baseline performance metrics captured for each equipment class. AI models trained on 6 months of historical maintenance records combined with live sensor data collected during weeks 5–10. Pilot team trained on dashboard operation, alert response, and work order generation workflows.
Mid-Chain Expansion — 7 Additional Locations (Weeks 11–22)
Model parameters refined using pilot site learnings then deployed to seven additional locations. Sensor installation executed during off-hours to avoid production impact. Location managers from pilot sites served as internal champions, delivering peer-to-peer training that significantly accelerated adoption. Alert threshold calibration completed within two weeks at each new site using transfer learning from pilot models, reducing model warm-up time from the standard 6–8 weeks to under 3 weeks per location.
Full Network Completion — Final 5 Locations (Weeks 23–30)
Remaining five locations brought online with the full benefit of network-level model training. By this phase, AI models could cross-reference failure patterns across all 15 sites, identifying equipment-class-specific degradation signatures that single-site models could not detect. Centralized monitoring dashboard activated, giving the maintenance director real-time visibility across all locations from a unified interface. Full chain deployment completed in week 30 with all 312 assets actively monitored.
Bakery Predictive Maintenance Results: 12-Month Performance Data
Performance measurement used a pre/post methodology comparing the 12 months prior to full deployment against the first 12 months of live AI operation across the complete 15-location network. Baseline data was drawn from maintenance logs, production records, ingredient waste reports, and equipment repair invoices. Post-deployment data was captured directly from the AI analytics platform's performance tracking dashboard. Bakery operators seeking similar results can Book a Demo to review the analytics framework used in this deployment.
| Performance Metric | Pre-Deployment Baseline | Post-Deployment (12 mo.) | Improvement |
|---|---|---|---|
| Unplanned Equipment Failures | 214 incidents / 18 mo. | 61 incidents / 12 mo. | –71% |
| Oven Downtime per Location | 38.4 hrs / year avg. | 11.2 hrs / year avg. | –71% |
| Mixer Bearing Failure Rate | 1 per 2.8 months (network) | 1 per 9.4 months (network) | –70% |
| Maintenance Labor Cost | $312,000 / year | $187,000 / year | –40% |
| Emergency Repair Callouts | 94 / year | 19 / year | –80% |
| Ingredient Waste (Equipment-Related) | $78,400 / year | $21,300 / year | –73% |
| Compliance Documentation Time | 4.2 days per audit cycle | 14 hours per audit cycle | –83% |
| Total Maintenance Cost | $486,000 / year | $247,000 / year | –49% |
Bakery Analytics ROI: Total Investment vs. Verified Savings
Total implementation investment for the 15-location network, including sensor hardware, platform licensing, installation labor, and staff training, came to $284,000. This figure included a $45,000 contingency provision for legacy equipment integration challenges that arose at four older locations. Year-one verified savings totaled $239,000 in reduced maintenance costs and ingredient waste alone—excluding the harder-to-quantify value of avoided production losses and food safety compliance improvements. Payback was achieved at month 14, with year-two net savings projected at $310,000 as models continue improving with additional training data. For a customized ROI estimate for your bakery operation, Book a Demo and our engineering team will model your specific equipment portfolio.
- Sensor hardware (312 assets): $98,000
- Platform licensing (Yr 1): $64,000
- Installation & integration: $72,000
- Staff training program: $28,000
- Contingency provision: $22,000
- Maintenance labor reduction: $125,000
- Emergency callout elimination: $67,000
- Ingredient waste recovery: $57,100
- Compliance labor savings: $38,400
- Repair parts (proactive vs reactive): $41,200
- Improved model accuracy (+12%)
- Expanded monitoring scope
- Reduced platform onboarding costs
- Training amortized across new hires
- Network-level failure pattern detection
What Made This Bakery Predictive Analytics Deployment Succeed
Post-deployment interviews with the maintenance director, five location managers, and production floor staff identified five factors most responsible for the program's measurable success. These learnings are directly applicable to other multi-site bakery operations evaluating chain bakery analytics programs and represent practical guidance beyond vendor marketing claims.
Oven Sensor Placement Was More Consequential Than Sensor Count
Early pilot testing revealed that sensor placement on deck ovens—not the number of sensors—determined model accuracy. Sensors positioned at deck zone perimeters, rather than centers, detected burner degradation patterns 3–4 days earlier by capturing the differential heating signatures that precede thermal non-uniformity. This counterintuitive finding, identified during pilot calibration, was applied across all subsequent location deployments and is credited with a substantial share of the oven monitoring accuracy gains. Detailed pre-installation sensor placement analysis saved the company an estimated $34,000 in redundant sensor hardware that would otherwise have been deployed based on generic best practices rather than equipment-specific modeling.
Historical Maintenance Records Were More Valuable Than Expected
The company had maintained digital maintenance logs for 7 years across its network. Initial assessment suggested these records were too inconsistently formatted to be useful as AI training data. A structured digitization effort—investing 3 weeks in record standardization before model training—produced AI models that achieved 84% prediction accuracy from day one of live operation, compared to the typical 65–70% accuracy seen in deployments relying solely on live sensor data during model warm-up. For bakeries exploring bakery PdM results improvement, legacy maintenance record quality deserves serious attention before deployment begins. Teams interested in assessing their data readiness can Book a Demo to walk through the data audit process.
Location Managers Needed Economic Context, Not Technical Details
Staff adoption varied dramatically by how AI alerts were framed. Locations where managers received alert notifications framed in equipment health terms ("Bearing vibration elevated: 2.4x baseline") saw slower response times than locations where the same alerts included economic context ("Bearing vibration elevated—estimated 9 days to failure / replacement cost if proactive: $340 / replacement cost if reactive: $2,100"). Reframing alerts with cost context increased average response time from 38 minutes to under 9 minutes across the test comparison. This single workflow change delivered a measurable compounding effect on downtime prevention outcomes over the 12-month measurement period.
Cross-Location Model Sharing Accelerated Accuracy at Newer Sites
The network deployment structure enabled a capability unavailable to single-site operators: AI models trained on failure patterns from 10+ locations could be applied immediately at newly deployed sites, providing substantially higher out-of-the-box accuracy than site-isolated models. By Phase 3 deployment, new location models were achieving 89% prediction accuracy within the first 30 days of live operation—accuracy levels that typically require 3–4 months of site-specific training data collection. For bakery chains evaluating multi-site bakery production improvement programs, this network learning effect represents a significant structural advantage of chain-wide rather than location-by-location deployment.
Food Safety Integration Delivered Unexpected Compliance Value
The deployment was scoped primarily as a predictive maintenance program, but integration with proofing chamber and refrigeration monitoring created secondary food safety compliance benefits that weren't originally quantified in the business case. Automated temperature logging and deviation documentation reduced HACCP audit preparation time by 83%—a saving that contributed $38,400 annually to the verified ROI figure. Food safety regulators at two inspection events specifically noted the quality and completeness of automated temperature records as exceeding regulatory requirements. This unexpected compliance dividend reinforced executive sponsorship of the program's continued expansion.
Deploy Bakery Analytics That Deliver Measurable ROI Across Every Location
iFactory's bakery AI platform delivers pre-configured oven monitoring, spiral mixer analytics, proofing chamber tracking, and HACCP-aligned compliance automation—purpose-built for chain bakery operations seeking proven, scalable predictive maintenance results.
Bakery Predictive Analytics — Frequently Asked Questions
How long does bakery predictive maintenance deployment take for a multi-site chain?
Based on this 15-location case study, full network deployment took 30 weeks from project kickoff to final go-live. Pilot deployment at the first three locations was completed in 10 weeks. Each subsequent location averaged 3–4 weeks for sensor installation, asset registry integration, and model activation. Chains with standardized equipment across locations complete faster deployments due to transferable model parameters. If you want to estimate timeline for your specific portfolio, book a demo for a scoping consultation.
What equipment types produce the best bakery analytics ROI?
Deck ovens and spiral mixers consistently deliver the highest predictive maintenance ROI in bakery environments due to their high failure cost, predictable degradation signatures, and direct link to production revenue. Proofing chambers and refrigeration units deliver secondary ROI through food safety compliance automation. Packaging and slicing equipment ROI varies by production volume and replacement cost.
Can bakery predictive analytics integrate with existing food safety management systems?
Yes. The deployment in this case study integrated with an existing HACCP-based FSMS, automatically logging CCP temperature readings, generating deviation records, and producing inspector-ready compliance reports. AI platforms configured for bakery environments enforce rather than replace existing food safety protocols, with all automated decisions traceable to documented HACCP procedures.
How accurate are bakery oven monitoring alerts in practice?
In this deployment, oven monitoring models achieved 87% prediction accuracy at 12 months post-deployment, with a false positive rate of 8.3%. False positive rates were highest during the first 6 weeks of operation at each location while models calibrated to site-specific equipment behavior. Alert precision improved to 91% accuracy at locations with 9+ months of live operational data.
What is the typical bakery predictive analytics cost for a 10–15 location chain?
Based on this case study, total implementation investment for 15 locations with 312 monitored assets was $284,000 including hardware, platform licensing, installation, and training. Per-location costs decrease significantly as network scale increases due to shared model training costs and transferable sensor configurations. Specific cost modeling requires an equipment audit and asset count—contact us to get a scoped estimate for your operation.