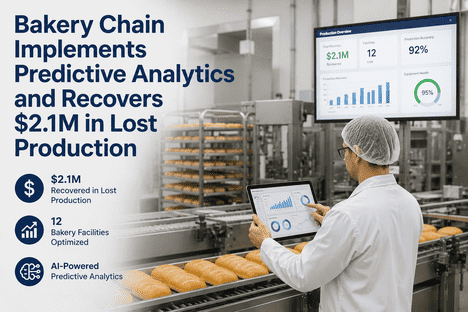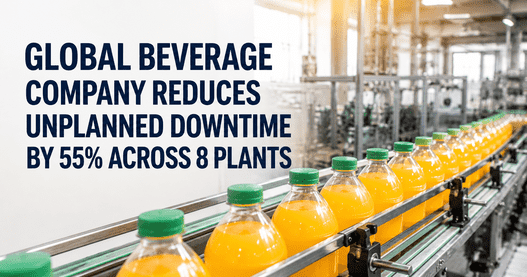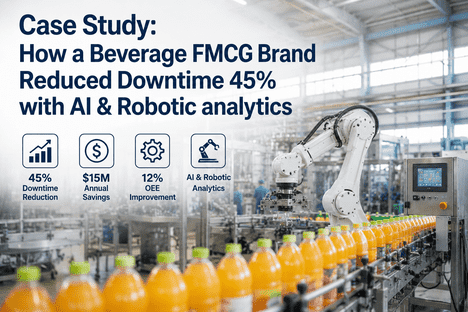
When a mid-sized beverage manufacturer approached iFactory with a recurring crisis — over 400 hours of unplanned downtime annually across three production lines — they had already tried conventional fixes: additional maintenance staff, manual inspection schedules, and reactive repair protocols. None of it moved the needle. Within six months of deploying AI-powered predictive analytics across their bottling, filling, and packaging equipment, they achieved a 55% reduction in unplanned downtime, recovered over $2.1M in production capacity, and transformed their maintenance operation from reactive chaos to precision scheduling. This is the full story of how it happened — implementation details, equipment monitored, and the measurable ROI that followed.
See How Beverage Plants Cut Downtime With AI Analytics
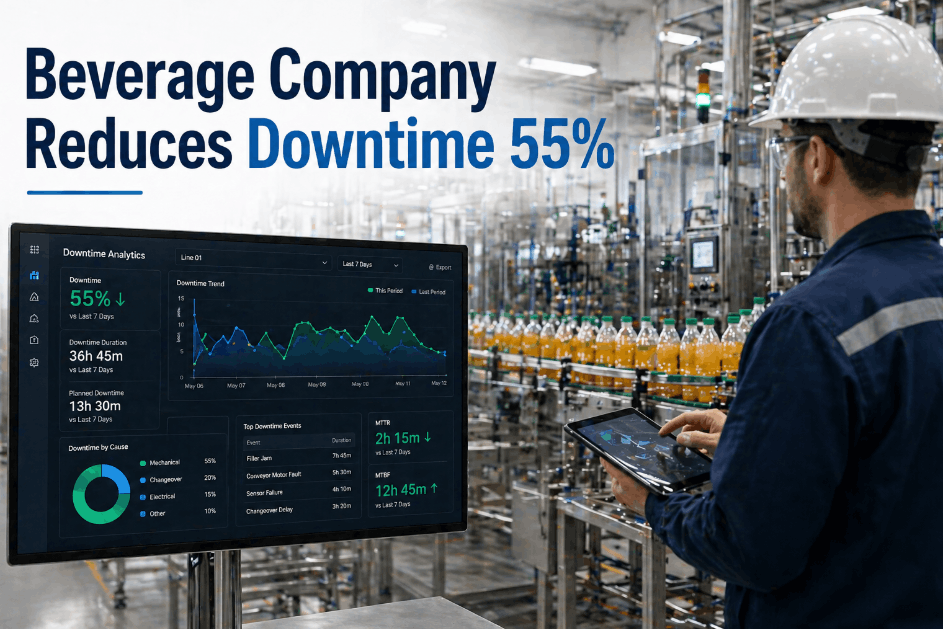
iFactory's manufacturing analytics platform delivers real-time equipment health monitoring, predictive failure alerts, and OEE visibility purpose-built for beverage and FMCG production environments.
The Challenge: Unplanned Downtime Draining Beverage Plant Profitability
Unplanned downtime is the single most expensive operational problem in beverage manufacturing. For this client — a regional beverage producer operating three high-speed filling lines with outputs ranging from 18,000 to 36,000 units per hour — the financial damage was compounding every quarter. Their maintenance team was skilled and committed, but fundamentally blind: without real-time equipment health data, every failure was a surprise.
The root causes were structural. Rotating equipment — fillers, cappers, labelers, conveyors — was being run to failure rather than maintained at the inflection point before failure. Vibration anomalies, thermal drift, and bearing wear were invisible until they became catastrophic stoppages. The average unplanned event lasted 3.2 hours. At a loaded production cost of $38,000 per hour, each event represented over $120,000 in lost output, waste, and emergency labor.
Before deploying iFactory's beverage AI analytics platform, their maintenance KPIs reflected the problem clearly. Their planned-to-unplanned maintenance ratio was 1:2.4 — meaning nearly two-thirds of all maintenance activity was reactive. Industry best practice targets 4:1 or better. Their MTBF (mean time between failures) on critical filling equipment was 18 days. Their MTTR (mean time to repair) averaged 3.8 hours per incident. These numbers needed to move significantly — and they did. Manufacturers navigating similar challenges regularly book a demo with iFactory before committing to a technology platform, because the analytics architecture chosen at the start defines the outcomes achievable at the end.
How iFactory's Predictive Analytics Platform Was Deployed Across the Beverage Plant
The implementation followed a structured four-phase approach designed to deliver early signal value while building toward full-plant predictive maintenance coverage. The beverage PdM results seen at this facility were not accidental — they were the direct product of a deployment methodology that prioritized data quality, equipment prioritization, and maintenance workflow integration before dashboards were ever built.
Equipment Criticality Mapping & Sensor Deployment
The first two weeks were spent mapping every piece of equipment across all three filling lines by failure consequence severity. High-speed rotary fillers, capper torque systems, labeler web-feed mechanisms, and primary conveyor drives were classified as Tier 1 critical assets. IoT vibration sensors, thermal imaging integration, and motor current signature analysis nodes were installed on 47 critical asset points without production interruption using scheduled downtime windows.
Baseline Data Collection & AI Model Training
iFactory's platform ingested four weeks of baseline equipment operation data — vibration signatures, temperature profiles, motor current patterns, and production throughput variance — to establish normal operating envelopes for each asset. The AI anomaly detection models were trained on this baseline, calibrated against the client's historical maintenance records to correlate early signal deviations with known failure modes. False alert thresholds were tuned to minimize maintenance dispatch noise during this phase.
Alert Workflow Integration & Maintenance Team Activation
Predictive alert outputs were integrated directly into the client's CMMS, routing condition-based work orders to the correct maintenance technicians based on asset type and shift schedule. Maintenance supervisors received prioritized equipment health dashboards accessible via tablet on the plant floor. A 30-day parallel run period allowed the maintenance team to validate alert accuracy before the platform was given autonomous work order generation authority. Alert precision during this period reached 87% — meaning fewer than 13% of alerts required no maintenance action.
Full Predictive Operations & ROI Measurement
By month four, the plant was operating on a predominantly predictive maintenance model. Scheduled shutdown windows replaced emergency stoppages as the primary maintenance event category. iFactory's analytics platform provided weekly equipment health reports, shift-level OEE breakdowns, and monthly downtime cost avoidance calculations that fed directly into the executive reporting pack — creating the evidence base for production improvement case study documentation and further automation investment justification.
Critical Beverage Plant Equipment Under AI Predictive Monitoring
The FMCG downtime reduction achieved at this facility was directly tied to the specificity of equipment coverage. Beverage plant AI analytics deployments that monitor only the most obvious assets — and skip secondary equipment — consistently underperform because failure chains in beverage lines rarely start where they cause the most visible damage. Here is the full equipment coverage map deployed at this facility.
| Equipment Category | Assets Monitored | Sensor Types Deployed | Primary Failure Modes Detected | Avg Alert Lead Time |
|---|---|---|---|---|
| High-Speed Rotary Fillers | 6 units (2 per line) | Vibration, temperature, flow rate deviation | Bearing wear, seal degradation, nozzle blockage onset | 68 hours |
| Capper & Torque Systems | 6 units | Motor current signature, torque variance | Spindle wear, torque inconsistency, chuck failure | 52 hours |
| Labeler Web-Feed Mechanisms | 9 units (3 per line) | Tension monitoring, vibration, thermal | Web tension drift, motor overload precursors | 44 hours |
| Primary Conveyor Drives | 14 drive units | Vibration, current, speed deviation | Gearbox wear, belt tension loss, coupling failure | 81 hours |
| Compressed Air Systems | 4 compressor units | Pressure variance, thermal, current | Valve wear, filter saturation, compressor bearing fault | 96 hours |
| CIP Pump & Valve Systems | 8 pump assemblies | Flow rate, pressure differential, vibration | Impeller wear, valve actuator failure, seal degradation | 58 hours |
The average predictive alert lead time of 66 hours across all monitored asset categories was the operational breakthrough that made this FMCG case study possible. With 66 hours of advance notice before a projected failure event, the maintenance team could schedule parts procurement, assign the correct technician, and execute repairs during planned low-production windows — eliminating the emergency scramble that previously defined their operation. Operations teams curious how this coverage translates to their specific equipment profile regularly book a demo for a site-specific asset coverage assessment before making any platform commitment.
Beverage Analytics Savings & ROI Achieved Within 6 Months
The Analytics ROI for FMCG deployments like this one is measured across four distinct value streams. Isolating each stream provides the clearest picture of where beverage AI analytics generates return — and which categories compound most significantly over time. The production improvement case study data below is drawn from six months of post-deployment measurement.
Downtime Cost Avoidance
Unplanned downtime hours fell from 400+ annually to an annualized rate of 178 hours post-deployment — a 55% reduction measured over the six-month study period. At $38,000 per hour in loaded production cost, this represents approximately $2.1M in annual downtime cost avoidance from this single improvement category alone.
$2.1M annual valueMaintenance Labor Efficiency
Shifting from reactive to predictive maintenance reduced emergency overtime by 68%. Maintenance technicians spent less time on emergency repairs and more time on value-added planned work. Total maintenance labor cost fell 22% despite no headcount reduction — the same team became measurably more productive when equipped with AI-driven work order prioritization and advance scheduling visibility.
22% labor cost reductionSpare Parts & Inventory Optimization
Predictive failure lead times allowed the maintenance team to procure parts on demand rather than holding large emergency inventory buffers. Spare parts inventory value dropped 31% within six months as the team gained confidence in the platform's ability to provide sufficient advance notice for standard procurement lead times. Expedited freight costs for emergency parts fell by 79%.
31% inventory reductionOEE & Throughput Recovery
Overall Equipment Effectiveness across the three filling lines improved by 14 OEE points — from a baseline of 61% to 75% at the six-month mark. This OEE improvement translated directly to additional production capacity that had previously required expensive weekend overtime scheduling to compensate for mid-week downtime events. The capacity recovery value exceeded $400K in the first six months.
+14 OEE pointsBeverage PdM Results — Before & After Comparison at 6 Months
The following comparison table documents the operational KPI movement from pre-deployment baseline to six-month post-deployment measurement across all three beverage filling lines. These beverage plant improvement metrics are the foundation of the full ROI calculation presented to the client's executive leadership team at the six-month review. FMCG operations leaders considering similar deployments often book a demo to model their own KPI projections against this benchmark data before presenting a business case internally.
| KPI / Metric | Pre-Deployment Baseline | 6-Month Post-Deployment | Improvement |
|---|---|---|---|
| Unplanned Downtime (hours/year, annualized) | 400+ hours | ~178 hours | –55% |
| OEE (Overall Equipment Effectiveness) | 61% | 75% | +14 pts |
| MTBF — Critical Filling Equipment | 18 days | 41 days | +128% |
| MTTR — Average Repair Duration | 3.8 hours | 1.6 hours | –58% |
| Planned vs. Unplanned Maintenance Ratio | 1:2.4 | 3.8:1 | Transformed |
| Emergency Overtime Hours (maintenance) | Baseline index | –68% vs. baseline | –68% |
| Spare Parts Inventory Value | Baseline index | –31% vs. baseline | –31% |
| Downtime Cost Avoidance (annualized) | — | $2.1M+ | Primary ROI |
What Made This Beverage Downtime Reduction Case Study Replicable
Not every FMCG AI analytics deployment achieves 55% downtime reduction in six months. The outcomes documented here were the result of specific implementation decisions that separated this deployment from lower-performing programs at comparable facilities. FMCG teams evaluating predictive analytics investments should weight these factors heavily in their platform selection and deployment planning processes. The beverage AI analytics savings achieved here required all of them working together.
Asset Criticality Prioritization Before Sensor Deployment
Deploying sensors on every asset indiscriminately generates alert noise that overwhelms maintenance teams and erodes platform confidence. This deployment used a formal criticality matrix — failure consequence severity multiplied by failure probability — to sequence sensor deployment. High-consequence, high-probability assets were instrumented first. This sequencing is what delivered measurable downtime reduction within the first 60 days, before full plant coverage was complete.
Maintenance Workflow Integration — Not Just Dashboard Deployment
Predictive analytics platforms that output dashboards without connecting to maintenance execution workflows consistently underperform. In this deployment, iFactory's alert outputs were directly integrated into the CMMS, generating condition-based work orders without requiring a maintenance supervisor to manually interpret a dashboard and create the work order separately. Removing this manual translation step was the single highest-impact decision in the implementation. Operations teams that book a demo can see exactly how this workflow integration operates in their CMMS environment before deployment begins.
A Parallel Run Period That Built Maintenance Team Trust
The 30-day parallel operation phase — where predictive alerts were generated but not yet acted on autonomously — was essential for building technician trust in the platform. Maintenance teams that have spent years operating reactively are skeptical of AI-generated alerts until they have personally validated accuracy across multiple failure events. Skipping this phase to accelerate deployment typically results in alert suppression behavior from maintenance staff, which neutralizes the platform's value regardless of technical performance.
Executive-Level ROI Visibility From Month One
Beverage plant improvement programs that cannot quantify their ROI in executive financial language lose budget support before they reach their performance peak. iFactory's platform was configured from deployment day one to produce weekly downtime cost avoidance calculations — not just technical maintenance KPIs. The maintenance manager could walk into every Monday leadership meeting with a specific dollar figure for the week's predicted failure events avoided. This executive visibility sustained investment commitment through the four-month ramp to full platform performance.
Which Beverage & FMCG Facilities Can Replicate These Predictive Analytics Results
The FMCG downtime reduction results documented in this case study are not exclusive to large enterprise facilities. The deployment model, equipment coverage approach, and CMMS integration architecture are equally applicable to facilities across a wide range of production volumes and asset complexity levels. The primary qualification criteria for achieving comparable beverage PdM results are operational, not scale-based.
Facilities with unplanned downtime rates exceeding 8% of available production hours are the highest-value targets for this deployment model. Beverage plants running continuous multi-shift operations on filling, capping, and packaging equipment with maintenance-driven OEE constraints below 70% consistently achieve the highest ROI multiples from AI predictive analytics investment. Secondary beverage analytics savings — spare parts inventory reduction and maintenance labor efficiency — are available across all facility sizes once the predictive model reaches calibration maturity.
The FMCG AI results documented here took six months to fully materialize — but the first measurable downtime avoidance events occurred within the first 45 days of sensor deployment. For operations leaders under short-term pressure to demonstrate improvement, this timeline is achievable without disrupting production schedules. The full implementation roadmap, including sensor deployment planning and CMMS integration specifications, is available to manufacturing teams that book a demo with iFactory's engineering team.
- Unplanned downtime > 8% of available hours
- Filling line OEE below 72%
- Planned-to-unplanned maintenance ratio below 2:1
- 3+ critical rotating equipment assets per line
- Multi-shift continuous production operations
- 35–55% reduction in unplanned downtime hours
- +10 to +16 OEE points on monitored lines
- 60–80% improvement in MTBF on critical assets
- 20–35% maintenance labor cost reduction
- ROI payback beginning in months 3–5
- Maintenance CMMS in active use
- Access to historical downtime and maintenance records
- Maintenance supervisor buy-in and workflow readiness
- Scheduled installation access for sensor deployment
- Plant network connectivity for IoT data transmission
Beverage Downtime Reduction & AI Predictive Analytics — Frequently Asked Questions
How long does it take to see measurable downtime reduction after deploying AI predictive analytics?
Most beverage plants see their first measurable downtime avoidance events within 45–60 days of sensor deployment. Significant KPI movement — such as the 55% reduction in this case study — typically materializes across a 4–6 month period as the AI model calibrates and the maintenance team shifts from reactive to predictive scheduling.
What types of beverage plant equipment benefit most from AI predictive monitoring?
High-speed rotating assets deliver the highest ROI — rotary fillers, cappers, labeler mechanisms, and conveyor drives. These generate detectable early-warning signals (vibration drift, thermal anomaly, motor current deviation) that AI models identify 48–96 hours before failure. Manufacturers unsure where to start can book a demo for a criticality-scoring assessment.
Does iFactory's platform require replacing our existing CMMS or MES systems?
No — iFactory integrates with existing CMMS and MES infrastructure via OPC-UA, REST API, or MQTT, routing predictive work orders directly into whichever system the maintenance team already uses. The analytics layer adds real-time intelligence on top of current workflows without requiring replacement or retraining.
What is the typical ROI payback period for beverage predictive maintenance deployments?
Single-line deployments typically achieve payback in 3–7 months; multi-line programs in 6–14 months, depending on baseline downtime rate and hourly production cost. The facility in this case study reached payback within six months, driven by $2.1M in annualized downtime cost avoidance alone.
How accurate are the predictive failure alerts — and what happens when an alert is wrong?
Alert precision reaches 85–92% within 60–90 days of calibrated operation. False positives are tracked and used to continuously refine model thresholds. A structured parallel-run period during deployment lets maintenance teams validate alert accuracy before the platform generates autonomous work orders — building trust before full handover.
Can this deployment model be applied to smaller beverage facilities or single-line operations?
Yes — the model scales down to single-line operations with as few as 8–12 monitored asset points. Smaller facilities often achieve faster payback because each avoided failure represents a higher proportion of available production hours. iFactory offers modular configurations for single-line, multi-line, and multi-facility programs.
Ready to Replicate This Downtime Reduction at Your Beverage Facility?
iFactory's AI predictive analytics platform delivers the equipment health monitoring, CMMS integration, and executive ROI visibility that produced a 55% downtime reduction for this beverage manufacturer — and is deployable at your facility within weeks, not months.