When a multinational CPG company operates 25 plants across three continents, the cost of operational inconsistency compounds daily. Unplanned downtime at one facility, a reactive maintenance culture at another, and fragmented analytics reporting across the portfolio creates a structural disadvantage that no single plant-level fix can solve. This case study documents how one global FMCG enterprise eliminated that inconsistency by standardizing AI-powered predictive analytics across its entire multi-plant network—and the measurable results that followed. If your organization is evaluating a similar enterprise AI rollout, Book a Demo to receive a facility-specific deployment roadmap for your plant network.
Why Multi-Plant AI Standardization Became a Board-Level Priority for This Global FMCG Leader
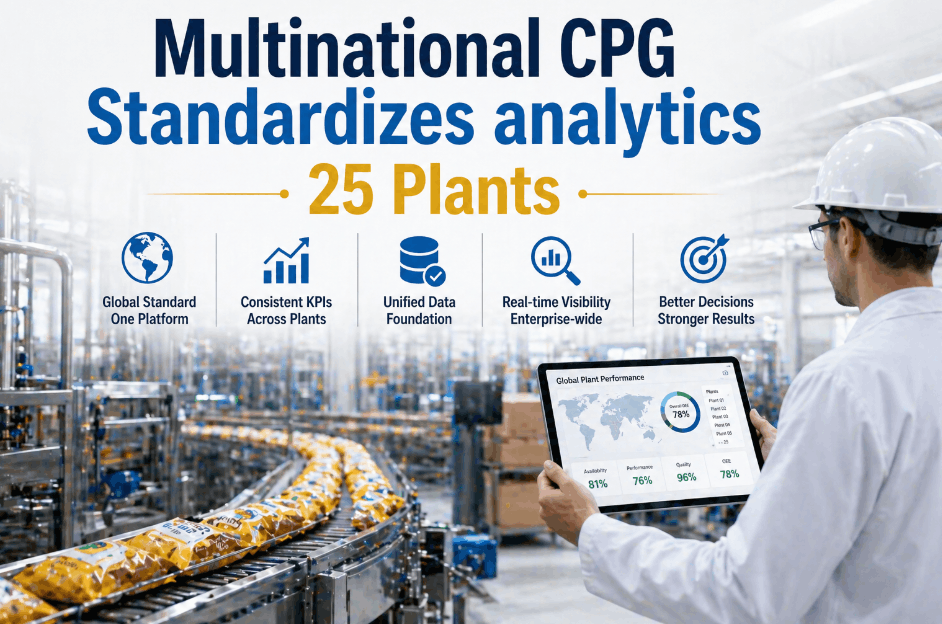
The company in this CPG analytics case study operated 25 food and beverage manufacturing plants spread across North America, Western Europe, and Southeast Asia. Despite being a recognized global FMCG brand, its plant-level technology infrastructure was fragmented. Twelve plants ran modern PLCs with partial SCADA integration. Nine operated on legacy equipment with no digital monitoring capability. Four had invested in siloed point solutions that generated data no one was consolidating. The result was a portfolio where corporate leadership could not produce a reliable, real-time picture of enterprise-wide Overall Equipment Effectiveness (OEE)—let alone predict which facilities were approaching critical failure thresholds.
The operational consequence was significant. Unplanned downtime events that triggered supply chain disruptions at three or more facilities in the same quarter occurred four times in the eighteen months preceding this multi-plant AI deployment. Each event cost an average of $2.1M in lost production, emergency logistics adjustments, and expedited maintenance spend. The board recognized this was not a plant-director problem—it was a corporate infrastructure problem requiring an enterprise analytics solution.
No Unified Data Layer
25 plants generated data in incompatible formats across incompatible systems. Corporate reliability teams had no mechanism to aggregate asset health data across the portfolio without manual quarterly reports from each site.
Impact: Blind enterprise riskInconsistent Maintenance Cultures
Maintenance practices ranged from fully reactive at legacy sites to partially preventive at newer facilities. There was no enterprise standard, making cross-plant benchmarking and performance comparison meaningless.
Impact: Uneven plant performanceVendor Fragmentation
Three separate point-solution vendors served different regions with no API interoperability. Consolidating insights required manual data extraction and spreadsheet reconciliation at the regional level.
Impact: Reporting latency of 3–4 weeksCapex Allocation Without Data
Infrastructure investment decisions were made based on age-of-asset heuristics rather than condition-based data. High-risk assets at newer facilities were systematically underfunded while low-risk legacy equipment received unnecessary capital replacement.
Impact: Misallocated capital spendHow the Corporate Team Evaluated and Selected an Enterprise-Grade Multi-Site AI Analytics Platform
The procurement process for this enterprise AI rollout was structured over six months, involving participation from corporate operations leadership, regional plant directors, IT infrastructure teams, and finance. The selection criteria were deliberately weighted toward deployment scalability and legacy compatibility—because the organization understood that a solution that worked perfectly at two modern plants but failed to integrate at twelve legacy sites would simply replicate the fragmentation problem in a different form. Facilities considering a similar evaluation process can Book a Demo to understand what enterprise-grade deployment looks like in practice.
The Five Non-Negotiable Requirements That Determined Vendor Selection
After an initial longlist of eleven vendors was reduced to four finalists through an RFP process, the corporate team applied five weighted evaluation criteria to each finalist. These criteria were developed based on the failures of the previous fragmented vendor approach and reflected the operational reality of managing a 25-plant global FMCG network.
| Evaluation Criterion | Weight | Minimum Requirement | Selected Vendor Score |
|---|---|---|---|
| Legacy Asset Compatibility | 30% | Must integrate with 20+ year-old machinery via wireless sensors | Full compatibility confirmed at pilot sites |
| Unified Multi-Plant Dashboard | 25% | Single view of enterprise OEE across all 25 plants | Real-time cross-plant benchmarking delivered |
| CMMS / ERP Integration | 20% | Auto-push work orders into SAP and Maximo without manual entry | Native SAP PM and Maximo API integration |
| Time-to-Deployment per Site | 15% | Maximum 6 weeks per plant including sensor installation | Average deployment completed in 4.2 weeks |
| IT Infrastructure Burden | 10% | Edge-to-cloud architecture; no dependency on plant IT network | Cellular gateway option eliminated IT dependency |
The Change Management Framework That Made Enterprise AI Adoption Stick Across 25 Plants
Technology selection is the easier half of a multi-plant AI standardization project. The harder half is organizational change management—convincing 25 plant directors, hundreds of maintenance technicians, and multiple regional operations VPs that a new analytics standard is worth adopting consistently. This CPG enterprise faced significant internal resistance, particularly from plant directors at high-performing sites who viewed standardization as corporate interference in local decision-making.
The change management approach was built around three principles: demonstrate value locally before demanding enterprise compliance, give plant-level teams ownership of their own data, and connect AI-generated insights to the performance metrics each stakeholder already cared about. This approach transformed the program from a top-down technology mandate into a bottom-up reliability movement. Organizations navigating similar cultural challenges can Book a Demo to understand how iFactory structures multi-site onboarding and change enablement.
Pilot at Three High-Impact Sites
Rather than a simultaneous 25-plant rollout, the program launched at three facilities with historically high downtime frequency. This concentrated the initial ROI signal and generated compelling internal case study data that plant directors at other facilities could evaluate on their own terms.
Duration: 8 weeks · Outcome: Avg. 31% downtime reduction at pilot sitesRegional Champion Program
One maintenance lead or reliability engineer from each pilot site was designated a "Regional AI Champion." These individuals received advanced platform training and were tasked with peer-to-peer knowledge transfer at the next eight deployment sites—reducing formal training overhead while building internal credibility for the program.
Duration: 12 weeks · Outcome: 94% technician adoption rate at Wave 2 sitesEnterprise Standardization and Governance
With pilot ROI validated and regional champions trained, the final rollout to all 25 plants was governed by a corporate reliability council that used the platform's cross-plant benchmarking to establish enterprise OEE baselines, maintenance KPI standards, and capital allocation protocols tied to condition-based asset health data.
Duration: 18 weeks · Outcome: Full 25-plant standardization achievedEnterprise-Wide CPG Analytics Results: 12-Month Post-Deployment Performance Across All 25 Plants
Twelve months after completing the full 25-plant AI analytics standardization, the company conducted a formal enterprise performance review. The results validated the investment thesis at every level of the organization—from plant floor maintenance technicians who experienced a measurable reduction in reactive workload, to the CFO who approved the program based on projected downtime avoidance savings. The multi-plant standardization delivered outcomes that exceeded the original business case projections across all four primary metrics. Manufacturers looking to model similar outcomes can Book a Demo and receive a customized enterprise ROI projection.
Enterprise-wide reduction in unplanned production stoppages across all 25 plants, measured against the 18-month pre-deployment baseline period.
Average increase in Overall Equipment Effectiveness across the plant portfolio, with the highest-performing sites achieving 24% OEE improvement in the same period.
Annual reduction in total enterprise maintenance expenditure through elimination of emergency freight costs, overtime, and unnecessary preventive component replacements.
Average extension of critical asset replacement timelines achieved by using condition-based lifecycle data to defer premature capital upgrades across the portfolio.
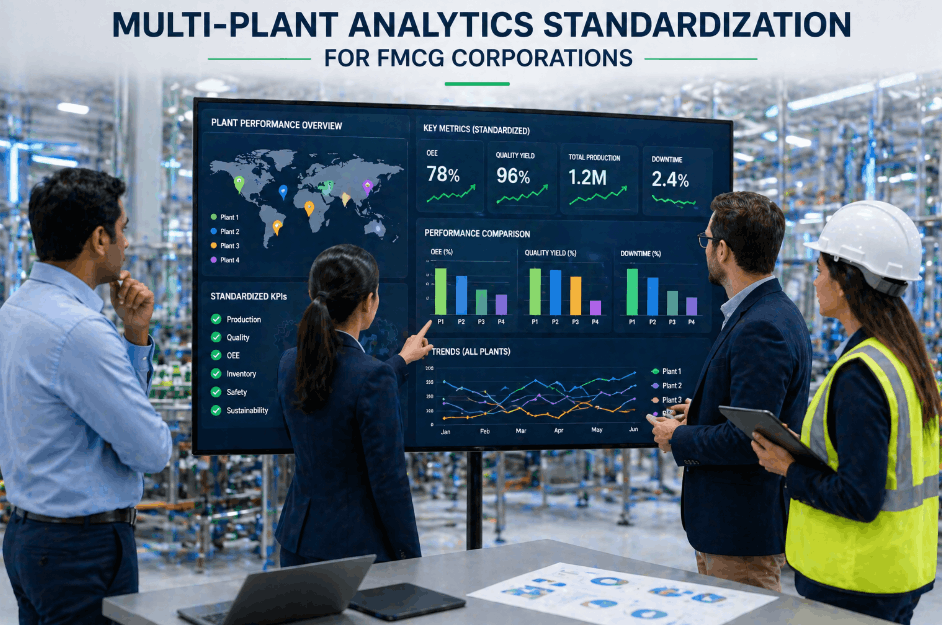
How the Enterprise AI Dashboard Transformed Corporate Decision-Making for This Global FMCG Operation
One of the most significant and least anticipated outcomes of the multi-plant AI standardization was its impact on corporate capital allocation strategy. Prior to deployment, the annual Capex planning cycle relied on a combination of asset age, regional budget requests, and subjective assessments of plant condition from site visits. The introduction of a unified AI analytics dashboard—displaying real-time asset health scores, predicted failure probability rankings, and OEE benchmarks for all 25 plants simultaneously—fundamentally restructured how the corporate team allocated maintenance and infrastructure budgets.
From Subjective Budget Requests to Data-Driven Enterprise Capital Allocation
The corporate reliability council now conducts a quarterly cross-plant review using the enterprise dashboard. During this review, the top 15% of assets by predicted failure probability across the entire portfolio are identified and triaged. Regional maintenance teams receive prioritized work orders generated automatically by the AI engine before each quarter begins. This has reduced the incidence of quarter-end emergency capital requests—previously a persistent budget management problem—by 71% in the twelve months following full deployment. Enterprise-level manufacturers evaluating this kind of cross-plant analytics capability can Book a Demo to see the enterprise dashboard in operation.
Before Standardization
- Capex decisions based on asset age and regional advocacy
- 3–4 week reporting lag for cross-plant performance data
- No enterprise OEE baseline or benchmarking standard
- Reactive maintenance dominant at 17 of 25 plants
- Supply chain disruptions from multi-plant downtime events 4x per 18 months
- Emergency Capex requests issued at end of 3 of 4 quarters
After AI Standardization
- Capex decisions driven by real-time condition-based asset health scores
- Real-time cross-plant performance data available 24/7 on enterprise dashboard
- Unified OEE standard benchmarked across all 25 plants quarterly
- Predictive maintenance standard adopted at all 25 plants within 12 months
- Zero multi-plant disruption events in the 12 months post full deployment
- Emergency Capex requests down 71%; structured quarterly planning restored
Six Critical Lessons from a 25-Plant Enterprise AI Analytics Deployment That Every CPG Operations Leader Should Know
The success of this multi-site AI standardization was not inevitable. Several decision points during the program could have derailed the enterprise rollout if the corporate team had chosen differently. The following lessons are drawn directly from the post-deployment review conducted with regional operations VPs, plant directors, and maintenance leads across the 25-plant network. They are shared here to provide a practical framework for other global FMCG organizations planning similar AI programs.
Start With the Worst-Performing Plants, Not the Best
The pilot site selection was critical. By choosing the three plants with the highest historical downtime frequency, the program generated maximum ROI in minimum time—providing the internal business case data that accelerated corporate approval for full deployment. Starting with high-performing plants would have generated impressive-looking dashboards but modest improvement metrics.
Treat CMMS Integration as a Day-One Requirement, Not an Afterthought
At two of the pilot sites, CMMS integration was initially deprioritized to accelerate sensor deployment. This created a three-week period where AI-generated failure predictions were communicated via email rather than automated work orders. Technician response time degraded significantly during this window. The lesson: AI insights without automated workflow integration generate alerts, not action.
Cross-Plant Benchmarking Creates More Internal Change Pressure Than Corporate Mandates
Once plant directors could see their facility's OEE score ranked against all 24 other plants on the enterprise dashboard, adoption urgency increased dramatically at underperforming sites. The competitive visibility created by standardized benchmarking accelerated Wave 3 deployment beyond the original schedule—without any additional corporate pressure.
Legacy Equipment Provides Higher AI ROI Than Modern Assets in the Early Phase
Counterintuitively, the highest predictive analytics ROI in the first twelve months came from legacy assets at older facilities—not from the modern packaging lines at newer plants. Legacy equipment operating beyond its designed lifecycle had more latent failure risk, meaning the AI engine's early warning capability prevented higher-consequence events at these sites.
Finance Teams Become the Program's Strongest Internal Advocates Once TCO Data Is Visible
Initial program sponsorship came from operations leadership. By month six, the finance function had become the program's most vocal internal advocate after the enterprise TCO analytics engine quantified $14M in annualized maintenance savings against a total platform investment of $3.2M. The 4.4x first-year return on the AI analytics investment transformed the CFO from a budget gatekeeper into an active program champion.
Enterprise AI Value Compounds—The Second Year Outperforms the First
As the AI failure models accumulated twelve months of plant-specific operational data, prediction accuracy improved measurably across all 25 sites. The models refined their understanding of each facility's unique failure modes, environmental variables, and seasonal patterns—producing fewer false alerts and more precise time-to-failure estimates. The second-year ROI projection is 40% higher than year one on the same platform investment.
The Enterprise Deployment Architecture: How iFactory Connects 25 Plants to a Single Predictive Intelligence Layer
The technical architecture that enabled this 25-plant AI standardization was built around a core design principle: every plant in the network, regardless of age, equipment type, or existing digital maturity, must be able to contribute data to and receive intelligence from the same enterprise platform without a plant-level IT project. This requirement ruled out solutions that demanded local server installation, custom middleware, or plant-network integration as prerequisites for deployment.
Universal Sensor Deployment
Wireless vibration, temperature, and current sensors are installed non-intrusively on all critical rotating assets—motors, pumps, gearboxes, compressors, and centrifuges—at each plant. Installation requires no production shutdown and is completed by on-site maintenance teams with remote guidance from iFactory reliability engineers.
Edge Gateway Configuration
Each plant receives an edge computing gateway that aggregates sensor data, PLC outputs, and SCADA feeds from across the facility. The gateway transmits encrypted data to the cloud platform via cellular connection, eliminating any dependency on the plant's local IT network or existing communication infrastructure.
AI Model Baselining
During the first four weeks of operation, the AI engine baselines each asset's normal vibration signature, thermal profile, and operational envelope. This plant-specific calibration is what distinguishes predictive analytics from simple threshold alerting—the models understand what "normal" looks like for each individual machine before identifying deviations.
Enterprise Dashboard Activation
Once all 25 plants are connected, the enterprise dashboard provides corporate and regional leadership with real-time OEE scores, asset health rankings, failure probability indices, and cross-plant benchmarking data. Automated work order generation via CMMS integration ensures that AI insights translate into plant-floor action without manual intervention.
Multi-Plant AI Standardization — Frequently Asked Questions
How long does it take to deploy AI analytics across a 25-plant CPG network?
Based on this case study, full 25-plant deployment was completed in approximately 38 weeks using a phased rollout model. Individual plant deployment averaged 4.2 weeks from sensor installation to live dashboard activation. Organizations with larger or smaller portfolios can expect proportional timelines, with the phased approach consistently outperforming simultaneous rollout attempts in terms of adoption quality and early ROI generation.
Can enterprise AI analytics integrate with both SAP and legacy CMMS systems simultaneously?
Yes. In this deployment, the platform maintained simultaneous integrations with SAP PM at 14 plants and IBM Maximo at 8 plants, with the remaining 3 plants using a direct API connection to a regional CMMS. The platform's middleware layer is designed specifically for this kind of heterogeneous CMMS environment, which is the norm rather than the exception in multi-plant FMCG operations.
What is the minimum number of plants required to justify an enterprise AI analytics deployment?
While this case study involved 25 plants, the enterprise platform architecture is economically justified for organizations with as few as 3 plants operating under a shared reliability and capital allocation framework. The cross-plant benchmarking value compounds with each additional site added, but the foundational ROI from downtime reduction and OEE improvement is available from the first plant deployment.
How does multi-plant AI standardization affect corporate insurance and regulatory risk profiles?
The enterprise documented that its comprehensive asset health records—generated continuously across all 25 plants—provided material documentation for its annual insurance renewal. The demonstrated shift from reactive to predictive maintenance across the portfolio contributed to a 12% reduction in its global manufacturing insurance premium in the first renewal cycle following full deployment. Regulatory audit preparation time also decreased by an estimated 60% due to the availability of continuous, time-stamped asset health documentation.
Does enterprise AI analytics require dedicated data science or IT resources to operate?
No dedicated data science resources are required. The AI models are pre-trained on food and beverage manufacturing failure data and self-calibrate to each facility's specific equipment during the baselining period. Ongoing platform management is handled by existing maintenance leads and reliability engineers using the dashboard interface. The corporate reliability council—established as part of this deployment—required one part-time program manager to coordinate quarterly cross-plant performance reviews.