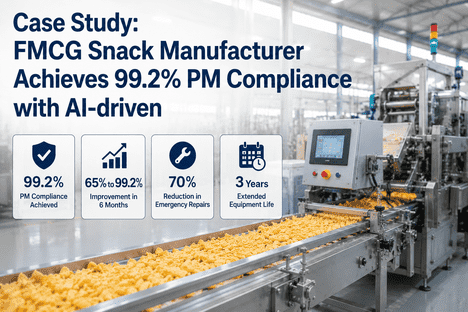
When a leading snack manufacturer in North America struggled with an Overall Equipment Effectiveness (OEE) of just 62%, their production lines faced constant unplanned downtime, quality inconsistencies, and mounting maintenance costs. Through a strategic implementation of AI-powered predictive analytics and real-time production monitoring, the facility achieved a remarkable transformation—boosting OEE from 62% to 84% within eight months. This case study examines the specific technical interventions, implementation timeline, and measurable business outcomes that enabled this snack manufacturing facility to eliminate chronic inefficiencies and establish a new benchmark for operational excellence in the food manufacturing sector.
The Snack Manufacturing Dilemma: Why 62% OEE Was Costing Millions
The facility operated three high-speed snack production lines running 24/7 across two shifts, producing over 12 million bags per month. Despite investing in modern packaging automation and upgraded frying systems, the plant consistently underperformed industry benchmarks. At 62% OEE, the facility was losing nearly 40% of its potential production capacity to a combination of unplanned equipment failures, slow cycle times, and quality-related stoppages. The financial impact was severe: approximately $2.8 million in annual lost revenue, excessive overtime costs for reactive maintenance, and rising customer complaints about inconsistent delivery schedules.
The root causes were systemic rather than isolated. Legacy frying kettles lacked real-time temperature monitoring, causing batch-to-batch quality variations that required manual adjustments and frequent line stops. High-speed baggers experienced frequent jam events due to undetected vibration anomalies in feed mechanisms. Seasoning applicators suffered from inconsistent flow rates, creating rework cycles that consumed valuable production time. Perhaps most critically, the maintenance team operated in a purely reactive mode—addressing failures only after they had already disrupted production schedules. To understand how modern facilities are solving these exact challenges, Book a Demo to see predictive intelligence in action across snack manufacturing environments.
Unplanned Downtime
Frequent, unpredictable equipment failures on packaging lines accounted for 18% of total production time losses, with average Mean Time To Repair (MTTR) exceeding 47 minutes per incident due to diagnostic delays and parts unavailability.
Impact: 18% capacity lossPerformance Degradation
Production lines consistently ran 12-15% below rated speeds due to operators manually slowing equipment to prevent jams and quality defects, with no data-driven visibility into optimal operating parameters for different product SKUs.
Impact: 14% throughput reductionQuality Losses
Seasoning inconsistencies, package seal failures, and weight variations resulted in 8% of production requiring rework or disposal, with limited traceability to specific equipment conditions or process variables that triggered defects.
Impact: 8% product wasteMaintenance Inefficiency
Calendar-based preventive maintenance on healthy equipment consumed 22% of technician hours, while emerging failures on critical assets went undetected until catastrophic breakdowns occurred during peak production periods.
Impact: Resource misallocationInitial State Analysis: Quantifying the OEE Gap in Snack Production
Before implementing any technological interventions, the facility conducted a comprehensive OEE assessment across all three production lines over a 30-day baseline period. The analysis revealed that while the theoretical production capacity was 550 bags per minute per line, actual sustained output averaged only 340 bags per minute when factoring in all losses. The OEE breakdown showed Availability at 72%, Performance at 79%, and Quality at 91%—each component falling well below the food manufacturing industry target of 85% minimum for world-class operations.
| OEE Component | Baseline Performance | Industry Benchmark | Gap to Target | Primary Loss Drivers |
|---|---|---|---|---|
| Availability | 72% | 85%+ | -13 points | Unplanned breakdowns, changeover delays |
| Performance | 79% | 90%+ | -11 points | Slow cycles, minor stoppages, speed reductions |
| Quality | 91% | 95%+ | -4 points | Seasoning defects, seal failures, weight variance |
| Overall OEE | 62% | 85%+ | -23 points | Cumulative losses across all categories |
The financial implications were stark. Each percentage point of OEE improvement translated to approximately $145,000 in annual recovered production value for this facility. The gap from 62% to the industry standard 85% represented $3.3 million in unrealized annual revenue—a compelling business case for digital modernization. To see how other snack manufacturers have closed similar OEE gaps, Book a Demo for a customized facility assessment.
The Digital Transformation Roadmap: From Reactive to Predictive Operations
The facility adopted a phased implementation approach focused on deploying predictive intelligence infrastructure before attempting any major equipment overhauls. This "digital-first" strategy prioritized visibility and data-driven decision-making over capital-intensive hardware replacements. The core technical architecture consisted of wireless vibration sensors on all rotating equipment, thermal imaging cameras on frying systems, PLC integration for real-time cycle data extraction, and an AI-powered analytics platform that synthesized these data streams into actionable reliability insights.
Sensor Deployment & Data Collection
Weeks 1-3Installed 47 wireless vibration sensors on motors, gearboxes, conveyors, and baggers. Deployed 8 thermal imaging units on frying kettles and heat sealers. Integrated PLC data streams from production control systems to establish real-time asset health baselines and identify high-risk equipment.
- Non-intrusive sensor installation (zero production downtime)
- Edge gateway configuration for data transmission
- AI model training on normal operating signatures
Predictive Alerting & Work Orders
Weeks 4-8Configured automated alert thresholds for bearing wear, thermal anomalies, and vibration signatures indicating misalignment or imbalance. Integrated predictive alerts with CMMS to auto-generate condition-based work orders with diagnostic data and recommended corrective actions for maintenance teams.
- Alert calibration to minimize false positives
- Mobile notification system for technicians
- Failure mode library development
Process Optimization & Continuous Improvement
Weeks 9-32Analyzed production data to identify optimal operating parameters for each SKU. Implemented dynamic speed adjustments based on real-time asset health scores. Established reliability-centered maintenance protocols replacing calendar-based schedules with condition-driven interventions, reducing spare parts inventory by 31%.
- SKU-specific process recipes
- Predictive maintenance scheduling
- Cross-functional reliability reviews (weekly)
The implementation deliberately avoided disrupting existing production schedules. All sensor installations occurred during routine maintenance windows, and the AI platform ran in "observation mode" for the first four weeks to establish accurate baselines without triggering premature alerts. This approach built operator confidence and ensured the system proved its value through actual prevented failures before being fully integrated into daily workflows. Facilities considering similar transformations can Book a Demo to review implementation timelines specific to their equipment configurations.
Measurable Outcomes: The 62% to 84% OEE Journey in Snack Manufacturing
Within eight months of full deployment, the facility achieved an OEE of 84%—a 22-percentage-point improvement that exceeded initial projections. This transformation was not the result of a single intervention but rather the cumulative effect of dozens of targeted improvements enabled by predictive intelligence. The most dramatic gains appeared in Availability, which jumped from 72% to 91% through the elimination of surprise equipment failures. Performance improved from 79% to 88% by identifying and resolving chronic micro-stoppages that had previously gone undiagnosed. Quality held steady and even improved slightly to 93% through better process control visibility.
Increased from baseline 62%, representing 22 percentage points of improvement and $3.19M in recovered annual production value across three production lines.
Reduction in unplanned breakdown frequency from 4.2 events per week to 1.4 events per week through early detection of bearing wear, thermal drift, and mechanical anomalies.
Decrease in total maintenance spending by eliminating emergency overtime, reducing expedited freight costs, and optimizing preventive maintenance intervals based on actual asset conditions.
Increase in total monthly production output from 12.1M bags to 16.3M bags without capital expenditure on additional lines or major equipment upgrades.
Comparative OEE Components: Before and After Predictive Intelligence
The granular improvement across each OEE component reveals the comprehensive nature of the transformation. Availability gains were driven by a 67% reduction in Mean Time Between Failures (MTBF) on critical packaging equipment. Performance improvements stemmed from resolving previously invisible issues such as inconsistent conveyor speeds caused by worn drive components and suboptimal speed settings during changeovers. Quality improvements resulted from tighter process control enabled by real-time thermal monitoring of sealing temperatures. Organizations seeking similar results can Book a Demo to explore equipment-specific improvement opportunities in their facilities.
Availability Performance
+19 point improvement through predictive failure prevention
Performance Efficiency
+9 point improvement via micro-stoppage elimination
Quality Rate
+2 point improvement through thermal process control
What Made This Snack Manufacturing OEE Transformation Successful
The dramatic improvement from 62% to 84% OEE was not simply a technology deployment—it required careful change management, cross-functional alignment, and a commitment to data-driven decision-making at all organizational levels. Several critical success factors emerged as differentiators between facilities that achieve transformative results and those that experience only marginal gains from digital investments.
Executive Sponsorship & Resource Allocation
Plant director and operations VP provided visible, active support throughout implementation. Allocated dedicated project hours for maintenance and production teams. Established OEE improvement as a top-three strategic priority with monthly executive reviews tracking progress against targets.
Technician Training & Ownership
Conducted comprehensive training on vibration analysis fundamentals and predictive alert interpretation. Empowered maintenance technicians to act on early warnings without requiring management approval. Created "reliability champions" on each shift to drive continuous improvement initiatives and peer mentoring.
Rigorous Failure Mode Documentation
Required root cause analysis for every failure event with findings entered into knowledge base. Used failure data to continuously refine AI models and alert thresholds. Established weekly cross-functional reviews of near-miss events where predictive alerts prevented potential breakdowns, reinforcing system value.
Perhaps the most important factor was the facility's willingness to act on predictive insights even when equipment appeared to be running normally. Early in the deployment, vibration sensors detected bearing deterioration on a primary bagger motor three weeks before any audible noise or performance degradation became apparent. Despite initial skepticism from operators, the maintenance team proceeded with a planned bearing replacement during a scheduled changeover. Post-inspection confirmed advanced spalling on the bearing race—a failure that would have caused a multi-hour emergency shutdown within days. This single prevented failure generated immediate credibility for the predictive system and cemented organizational buy-in. Facilities ready to build similar data-driven reliability cultures can Book a Demo to explore change management strategies alongside technical implementation.
Month-by-Month OEE Progression: The Journey from 62% to 84%
The OEE improvement trajectory was not linear. The facility experienced rapid initial gains in the first three months as the most obvious and high-impact failure modes were addressed, followed by a plateau period where gains came from more nuanced process optimizations. The chart below illustrates the actual monthly OEE progression, highlighting key interventions that drove step-change improvements at specific milestones.
Month 1 - Baseline & Sensor Deployment
Initial assessment complete. Sensors installed on all critical assets. AI platform operating in observation mode to establish normal operating signatures and calibrate alert thresholds without disrupting production.
Month 2 - First Prevented Failures
Predictive alerts active. First major failure prevented on Bagger #2 motor bearing. Emergency downtime reduced by 28% compared to baseline. Maintenance team confidence building through validated early warnings.
Month 3 - Process Parameter Optimization
Identified optimal speed settings for top-12 SKUs based on vibration and thermal data. Resolved chronic micro-stoppages on conveyor systems caused by undetected drive misalignment. Performance component improving rapidly.
Month 4 - CMMS Integration Complete
Automated work order generation from predictive alerts fully operational. Maintenance backlog reduced by 41%. Transition from reactive to proactive maintenance scheduling accelerating across all shifts.
Month 5 - Quality Process Refinements
Thermal imaging data used to establish tighter sealing temperature controls. Reduced seal failure rate by 52%. Quality component approaching world-class benchmark. Waste reduction generating measurable margin improvement.
Month 6 - Predictive Maintenance Maturity
Preventive maintenance calendar replaced with condition-based scheduling. Spare parts inventory optimized based on actual failure prediction timelines. Technician overtime reduced by 37% year-over-year.
Month 7 - Advanced Analytics Deployment
AI models refined using six months of facility-specific failure data. False positive alert rate reduced to under 3%. Predictive accuracy for critical failures exceeding 96%. Production planning now incorporates real-time asset health scores.
Month 8 - Target Achievement & Sustainability
84% OEE achieved and sustained for 30 consecutive days. Reliability-centered culture established. Monthly throughput increased 35% with zero additional capital investment. Platform expansion approved for secondary processing lines.
ROI Analysis: The Business Case for Predictive Intelligence in Snack Manufacturing
The 22-percentage-point OEE improvement delivered immediate and substantial financial returns across multiple dimensions. The primary value driver was recovered production capacity—the facility increased monthly output by 4.2 million bags without purchasing additional equipment or adding shifts. At an average margin of $0.24 per bag, this represented $1.01 million in incremental monthly gross profit. Simultaneously, maintenance costs decreased by 34% due to the elimination of emergency repairs, optimized spare parts inventory, and reduced overtime hours. The combined impact generated a full ROI on the digital infrastructure investment within 4.7 months.
| Financial Metric | Baseline (Annual) | Post-Implementation (Annual) | Improvement | Value Impact |
|---|---|---|---|---|
| Production Throughput | 145.2M bags | 195.6M bags | +50.4M bags | +$12.1M revenue potential |
| Unplanned Downtime Cost | $2.84M | $0.94M | -$1.90M | Direct cost avoidance |
| Maintenance Spending | $1.63M | $1.08M | -$550K | Operating expense reduction |
| Quality Waste/Rework | $1.12M | $0.76M | -$360K | Material cost savings |
| Total Annual Benefit | — | — | — | $14.9M cumulative value |
Beyond direct financial metrics, the facility achieved several strategic advantages that strengthened competitive positioning. Improved delivery reliability allowed the sales team to secure two new high-volume customer contracts that required guaranteed on-time performance exceeding 98%—commitments the facility could not have credibly made at the previous 62% OEE baseline. Enhanced production flexibility enabled the facility to handle short-run specialty SKUs without sacrificing efficiency on high-volume core products. The reliability data generated by the predictive platform also supported a successful negotiation with the facility's insurer, resulting in a 12% reduction in property insurance premiums based on documented risk mitigation practices. Food manufacturers evaluating similar digital investments can Book a Demo to receive facility-specific ROI projections tailored to their equipment profiles and production environments.
Key Insights from the 62% to 84% OEE Transformation Journey
The facility's leadership team documented several critical lessons throughout the eight-month transformation that can inform other snack manufacturers pursuing similar OEE improvements. These insights address both technical implementation decisions and organizational change management strategies that proved essential to achieving and sustaining the 84% OEE target.
Start with High-Impact Assets, Not Everything
Rather than attempting to instrument every motor in the facility simultaneously, the team prioritized the 12 most critical assets based on failure frequency and production impact. This focused approach generated visible wins within the first 60 days, building organizational momentum and proving ROI before expanding to secondary equipment.
Operator Buy-In Is Non-Negotiable
Initial resistance from production operators was overcome by involving them in sensor placement decisions and creating a "no-blame" culture around equipment performance data. When operators understood that data would support them rather than critique them, they became active partners in identifying improvement opportunities and validating predictive alerts.
Alert Fatigue Will Derail Adoption if Not Managed
Early deployment generated too many low-priority alerts, causing technicians to ignore critical warnings. The solution was aggressive threshold tuning during the first 90 days and a tiered alert system: Critical (immediate action), Warning (schedule within 48 hours), and Info (monitor trend). This reduced alert volume by 62% while maintaining detection accuracy.
Data Visibility Drives Behavioral Change
Installing large digital OEE dashboards in break rooms and production areas created peer accountability and friendly competition between shifts. When all teams could see real-time performance metrics, shift leads proactively addressed minor issues before they escalated, contributing to the sustained availability improvements observed after Month 6.
ROI Metrics Must Be Visible to Finance
Monthly reporting of prevented downtime costs, avoided emergency repairs, and incremental production volume ensured continued financial support for the initiative. The finance team appreciated translating technical metrics (vibration levels, thermal anomalies) into business outcomes they understood: dollars saved and revenue protected.
Technology Alone Does Not Guarantee Results
The predictive platform provided capabilities, but human expertise translated those capabilities into results. Reliability engineers and experienced technicians interpreted alerts within operational context, distinguishing between normal process variations and genuine emerging failures. Investing in training and cross-functional collaboration was as important as the technology itself.
Scaling Success: From Pilot Lines to Enterprise-Wide Reliability
Following the successful achievement of 84% OEE on the primary production lines, the facility approved expansion of predictive intelligence across all manufacturing operations including secondary processing, warehousing automation, and utilities infrastructure. The platform's proven ROI and operational impact created a compelling business case for corporate-level deployment across the parent company's seven other snack manufacturing facilities in North America. The goal is to establish enterprise-wide reliability standards with real-time asset health visibility from plant floor to executive dashboards, enabling data-driven capital allocation decisions and continuous operational improvement at scale.
The facility also committed to advancing into prescriptive optimization—using AI to not only predict failures but to automatically adjust process parameters in real time based on asset health conditions and production demand forecasts. This next phase will integrate predictive data with enterprise resource planning (ERP) and supply chain systems, allowing dynamic production scheduling that maximizes throughput while minimizing mechanical stress on aging equipment. The roadmap includes integration with energy management systems to optimize power consumption during off-peak periods and coordination with procurement systems to automatically trigger spare parts orders when predictive models indicate upcoming component replacements will be needed within 90-day windows.
Snack Manufacturing OEE Improvement — Frequently Asked Questions
How long does it typically take to see measurable OEE improvements in snack manufacturing?
Most snack facilities begin observing OEE improvements within 4-8 weeks of sensor deployment, with first prevented failures typically occurring in Month 2. Significant improvements (10+ percentage points) generally materialize within 3-6 months as predictive models mature and maintenance teams transition to condition-based workflows. Full transformation to world-class OEE levels (85%+) typically requires 6-12 months depending on baseline conditions and organizational readiness.
Can predictive intelligence work with older legacy snack production equipment?
Yes. In fact, aging equipment often delivers the highest ROI from predictive monitoring because these assets have the highest failure risk and the greatest uncertainty around remaining useful life. Wireless vibration and thermal sensors can be retrofitted to equipment of any age without requiring PLCs or embedded controls. The case study facility had packaging equipment ranging from 3 to 22 years old, all successfully instrumented with non-intrusive sensors.
What level of IT infrastructure is required to implement predictive intelligence?
Minimal. Most deployments use edge gateways with cellular connectivity that operate independently of existing plant networks, eliminating IT security concerns and infrastructure dependencies. Data flows directly from sensors to cloud analytics platforms via encrypted cellular channels. No on-premise servers, network modifications, or dedicated IT resources are typically required for successful implementation.
How does predictive intelligence impact maintenance team workload and staffing requirements?
Predictive intelligence shifts maintenance from reactive firefighting to proactive scheduled interventions, actually reducing workload stress and emergency overtime. The case study facility reduced maintenance overtime by 37% while improving asset availability. Technician roles evolve from "break-fix" responders to reliability specialists focused on planned, efficient repairs during optimal maintenance windows rather than chaotic emergency responses.
What is the typical ROI timeline for predictive intelligence in snack manufacturing?
Most snack manufacturing facilities achieve full ROI within 4-9 months. The case study facility reached payback in 4.7 months through a combination of prevented downtime, reduced maintenance costs, and recovered production capacity. Facilities with higher baseline downtime rates or more expensive emergency repair patterns often see even faster ROI, sometimes within 3 months when a single major failure is prevented early in deployment.
Can we implement predictive intelligence on just one production line as a pilot before expanding?
Absolutely, and this is often the recommended approach. Starting with your highest-volume or most problematic production line allows you to prove ROI and build organizational confidence before expanding across the facility. The case study facility began with three primary snack lines before later expanding to secondary processing and utilities. A focused pilot generates visible wins that build momentum for enterprise-wide adoption.
How does OEE improvement translate to actual bottom-line profit in snack manufacturing?
Every percentage point of OEE improvement directly translates to recovered production capacity that can fulfill existing customer demand or support new sales without capital investment. For the case study facility, the 22-point improvement represented $12.1M in additional annual revenue potential at existing margin rates. Combined with reduced maintenance costs and quality waste, total annual financial benefit exceeded $14.9M—a transformational impact on facility profitability and competitive positioning.