How to Build a analytics Culture in FMCG Manufacturing From Reactive to Proactive
By Seren on June 17, 2026
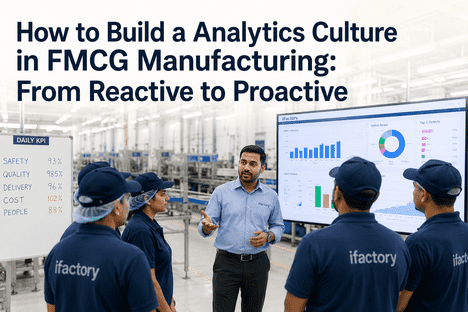
An FMCG manufacturing plant running a reactive analytics culture looks identical to one running a proactive analytics culture — at the start of the shift. By the end of the shift, the difference is visible in every metric that matters: overall equipment effectiveness, first-pass yield, unplanned downtime hours, and corrective work orders generated. In the reactive plant, the analytics team spends the first two hours of every shift responding to overnight alerts — a temperature excursion on line 3, a fill weight deviation on the packaging line, a viscosity drift in the blending vessel. Each alert launches an investigation that consumes engineering hours, pulls operators away from their stations, and produces a corrective action that addresses the immediate symptom while the underlying condition remains. By mid-shift, the team has resolved three crises and started zero proactive improvement initiatives. In the proactive plant, the analytics team starts the shift reviewing a prioritised list of conditions the platform has flagged for investigation — not overnight emergencies that demand immediate response, but developing patterns the platform detected 12 to 36 hours before they would become production events. The team allocates the morning to root cause analysis on the flagged conditions, the midday window to validating corrective actions from previous investigations, and the afternoon to continuous improvement projects identified from long-term trend analysis. Both plants have the same team size, the same analytics tools, and the same production volume. The difference is not the team's capability — it is the culture that determines how that capability is deployed. Building an analytics culture in FMCG manufacturing means shifting the team's operating model from event-response to pattern-recognition — from solving yesterday's fires to preventing tomorrow's failures. This page outlines the leadership strategies, KPI frameworks, and technology architecture required to make that shift, structured for FMCG production directors, plant managers, and analytics leaders. Book a Demo to see how iFactory AI's Shift Logbook, Automated Analytics Reporting, and Work Order Management platform supports proactive analytics culture in FMCG manufacturing.
2.5x
Improvement in first-pass yield reported by FMCG plants that shifted analytics from reactive event response to proactive pattern detection within 12 months
60-70%
Reduction in unplanned downtime events when analytics teams shift from investigating after failure to identifying conditions 12-36 hours before failure
86%
Of plant managers rate analytics culture as a top-three factor in achieving OEE targets — above tool capability or team size
3:1
Ratio of proactive to reactive analytics hours in top-quartile FMCG plants — versus 1:4 in plants with reactive cultures
From Firefighting to Prevention: The Analytics Culture Transformation Starts with the Shift Logbook, Not the Dashboard.
iFactory AI's platform gives FMCG production directors the Shift Logbook, Automated Analytics Reporting, and Work Order Management tools to shift analytics teams from reactive event response to proactive pattern detection at scale.
Reactive vs Proactive Analytics — The Structural Difference That Determines Plant Performance
The distinction between a reactive and a proactive analytics culture in FMCG manufacturing is not about the analytics tools deployed — both types of plants have SCADA systems, historians, and quality databases producing data continuously. The difference is how the analytics team's attention is allocated. In a reactive culture, the team's work is driven by event notifications — alarms, alerts, quality deviations, and equipment faults that demand immediate investigation. The team responds to the production system's emergencies rather than directing its own work according to a prioritised improvement plan. The consequence is structural: the team never catches up because every investigation they complete produces a corrective action that closes one event while the conditions that generate the next event remain unchanged. In a proactive culture, the analytics team's work is driven by pattern detection — the platform identifies developing conditions before they become events, and the team investigates these conditions on a prioritised schedule that leaves time for root cause elimination and continuous improvement.
Reactive Analytics Culture — Event-Response Operating Model
1
Overnight production event triggers alarm — fill weight deviation, temperature excursion, or equipment fault logged in historian
2
Analytics team notified at shift start. Investigation consumes 2-4 hours pulling data from SCADA, LIMS, and CMMS to reconstruct conditions
3
Corrective action written and filed. Root cause often documented as operator error or material variance — unverifiable from data
4
Same failure mode recurs 2-4 weeks later. Team investigates again. Proactive improvement projects never started
Result: Analytics team is perpetually behind. OEE improvement flat. Operator trust in analytics declines.
Proactive Analytics Culture — Pattern Detection Operating Model
1
Platform detects developing pattern — vibration trend on line 3 bearing, viscosity drift in blending vessel, fill weight standard deviation increase
2
Shift Logbook surfaces prioritised investigation list at shift start. Ranked by predicted impact — hours to event, quality consequence, production value at risk
3
Team investigates root cause with data already correlated. Corrective action addresses structural condition — verified by data
4
Afternoon allocated to process improvement projects from long-term trend analysis. OEE improving month over month
Result: Analytics team drives improvement. OEE trend positive. Operator trust in analytics grows with every prevented event.
The Four-Stage Analytics Culture Maturity Model for FMCG Manufacturing
Moving from a reactive to a proactive analytics culture is not a single transformation — it is a progression through four distinct stages of maturity. Each stage builds on the capabilities established in the previous stage, and each stage produces measurable improvement in plant performance. The FMCG plants that achieve top-quartile OEE performance are those that reach Stage 4 within 18 months of beginning the analytics culture transformation.
01
Reactive Response
RR
Analytics team responds to events after they occur. Investigations are manual, time-consuming, and focused on assigning cause rather than eliminating conditions. No proactive detection capability. The team spends 80% of its time on investigations that close events without reducing recurrence. Recurring failure modes are accepted as normal operational variation. Shift Logbook is used for manual log entry only with no integration to analytics tools.
Starting state for most FMCG plants
02
Pattern Awareness
PA
Platform detects developing patterns and surfaces prioritised investigation lists at shift start. Analytics team begins shift reviewing conditions rather than responding to emergencies. Investigation time per event drops from hours to minutes as data is pre-correlated. Root cause documentation shifts from qualitative statements to data-verified findings. Recurring failure modes are identified and tracked. Shift Logbook integrates with analytics to log pattern investigations alongside event responses.
3-6 months with iFactory platform
03
Preventive Action
PA
Analytics team allocates 50%+ of its time to preventive investigations and continuous improvement. Corrective actions are linked to root cause data and verified for effectiveness before closure. Recurring failure modes are systematically eliminated, not documented. Work Order Management is driven by analytics findings rather than operator requests. The team publishes weekly analytics summary that shifts management focus from event metrics to trend metrics.
6-12 months - OEE improvement accelerates
04
Autonomous Analytics
AA
Analytics culture is embedded in daily operations. Shift Logbook is the primary operations management tool — used by operators, maintenance, quality, and production teams for structured decision-making. Automated Analytics Reporting generates monthly performance reviews without manual data compilation. The analytics team focuses exclusively on process improvement and innovation. Event recurrence rate below 5%. OEE at or above target consistently. The plant runs on pattern detection, not event response.
12-18 months - sustained top-quartile performance
Leadership Strategies That Drive Analytics Culture Transformation
The most common mistake in analytics culture transformation is treating it as a technology deployment — install the platform, train the team, and the culture will follow. Technology enables the transformation, but the transformation itself is a leadership-driven change in how the analytics team defines its work, how plant management evaluates its performance, and how the production organisation uses its output. The FMCG plants that have successfully transitioned from reactive to proactive analytics cultures share five leadership practices that distinguish them from plants that deployed the same technology without shifting the culture.
1
Redefine the Analytics Team's Performance Metrics — Shift from Investigation Closure Rate to Prevention Rate
In a reactive culture, the analytics team is measured by how quickly it closes investigations and how many corrective actions it generates. These metrics reward speed over effectiveness and volume over impact. In a proactive culture, the team is measured by prevention rate — the percentage of flagged patterns that were investigated and resolved before they became production events. This metric forces the team to prioritise conditions that would have caused the highest-impact events, not the events that are easiest to close.
2
Restructure the Shift Start Meeting — Move from Event Review to Pattern Review
The shift start meeting is the single highest-leverage intervention point for culture change. In a reactive plant, the meeting opens with a review of overnight events — what failed, what was fixed, what is still broken. In a proactive plant, the meeting opens with a review of the pattern detection list — what developing conditions were detected, which are prioritised for investigation, and what resources are allocated to each. The shift Logbook serves as the single source of truth for both approaches, but the content of the review determines the team's focus for the day.
3
Create a Weekly Analytics Report That Shifts Management Focus from Events to Trends
Plant management reads the metrics that are presented to them. If weekly reports focus on event counts, downtime hours, and corrective action closure rates, management's attention is directed to event response performance. The proactive culture requires a parallel report that tracks pattern detection volume, prevention rate, OEE trend, first-pass yield trend, and recurring failure mode elimination rate. When management sees that prevention rate correlates with OEE improvement more strongly than investigation closure rate, the cultural shift becomes self-reinforcing.
4
Invest in Shift Logbook Integration — Make Pattern Detection Visible in Every Operator's Workflow
The analytics culture cannot live in a separate platform accessed only by the analytics team. Pattern detection findings must be visible in the Shift Logbook that operators and production supervisors use every shift. When an operator sees a flagged condition on the line they are running — with a predicted time to event and a recommended preventive action — the analytics culture becomes operational rather than analytical. The operator becomes the first line of prevention, not the last recipient of corrective action instructions.
5
Celebrate Preventions, Not Just Fixes — Build the Recognition System for the New Culture
The recognition system in most FMCG plants rewards the shift that resolved the most events, the team that restored production fastest, or the technician who diagnosed the most complex failure. These rewards reinforce the reactive culture by celebrating the skills that are most valuable in a plant that runs on event response. The proactive culture requires parallel recognition: the analyst who identified a pattern 36 hours before it would have caused a line shutdown, the operator who acted on a flagged condition and prevented a fill weight deviation, and the team that eliminated a recurring failure mode entirely. iFactory's Shift Logbook tracks prevention events alongside corrective actions, providing the data to support both recognition systems.
Your Analytics Team Has the Tools to Detect Every Failure Pattern. The Question Is Whether Your Operating Model Lets Them Act on What They See — or Forces Them to Keep Fighting Fires.
iFactory AI's Shift Logbook, Automated Analytics Reporting, and Work Order Management platform gives FMCG plants the technology foundation for analytics culture transformation — making pattern detection visible in every operator's workflow and shifting management focus from event response to prevention.
KPIs That Measure Analytics Culture Health — What to Track from Day One
Analytics culture cannot be measured by a single metric — it is a multidimensional characteristic that requires a balanced scorecard spanning team activity, operational impact, and cultural adoption. The following KPIs are designed to be tracked from the first week of the transformation and reported at the shift review, weekly management meeting, and monthly performance review. Each KPI has a target range for each maturity stage, enabling the production director to track progress quantitatively.
Prevention Rate
% of flagged patterns investigated before they became events
We deployed iFactory's Shift Logbook and Automated Analytics Reporting across three FMCG production lines with the explicit goal of shifting our analytics team from reactive to proactive within six months. The technology deployment took two weeks. The culture transformation took the full 18 months. The difference between the plants that made the shift and the plant that stalled was not the platform — all three had the same platform. The difference was leadership attention. The plant that stalled continued to measure the analytics team by investigation closure rate and event response time, and the team naturally optimised for those metrics despite the platform's proactive capabilities. The plants that made the shift redefined the team's KPIs within the first month — prevention rate, proactive ratio, and recurring failure mode elimination rate — and restructured the shift start meeting to review those measures daily. The platform made the proactive culture possible, but the leadership team had to actively manage the transition by changing what they measured and what they discussed. Once the metrics changed, the behaviour followed, and the OEE improvement that followed was the strongest validation of the culture shift.
— Production Director, Multi-Plant FMCG Manufacturer — Confectionery, Beverages, and Snack Foods, 12 Production Lines
Implementation Pathway — From Reactive Baseline to Proactive Culture in 12 Weeks
The technology implementation for analytics culture transformation follows a structured three-phase timeline. Each phase has a specific deliverable that enables the next phase, and each phase produces measurable improvement in the KPIs defined above. The 12-week timeline aligns with the average FMCG plant's quarterly planning cycle and enables the leadership team to review progress at the quarterly performance review with quantitative evidence of culture shift.
WEEKS 1-3
Phase 1: Shift Logbook Deployment with Pattern Detection
Deploy iFactory Shift Logbook across all production lines with integrated pattern detection from SCADA and quality data streams. Configure shift start meeting template with pattern review section. Train shift supervisors and analytics team on pattern detection workflow. Establish baseline prevention rate, proactive ratio, and investigation time metrics from shift log data. Begin tracking pattern detection volume and investigation outcomes.
Deliverable: Shift Logbook active on all lines with pattern detection visible in every shift start meeting.
WEEKS 4-8
Phase 2: KPI Redefinition and Weekly Analytics Report
Redefine analytics team performance metrics to prevention rate, proactive ratio, and recurring failure mode elimination rate. Configure iFactory Automated Analytics Reporting to generate weekly prevention-focused report parallel to existing event-focused report. Train plant management on interpreting the new metrics and using them in weekly operations reviews. Adjust shift start meeting content to prioritise pattern review over event review.
Deliverable: Management team using prevention metrics in weekly reviews. Shift start meeting restructured.
WEEKS 9-12
Phase 3: Work Order Management Integration and CAPA Effectiveness Tracking
Integrate Work Order Management with pattern detection findings so that every pattern investigation can generate a preventive work order directly. Configure CAPA effectiveness tracking to measure recurrence rate for every corrective action with data-verified outcome. Train analytics team on using prevention data to drive Work Order Management decisions. Establish monthly analytics culture health report with all six KPIs tracked against stage targets.
Deliverable: Full platform deployed with prevention-driven Work Order Management and CAPA effectiveness tracking.
Conclusion
The structural difference between a reactive and a proactive analytics culture in FMCG manufacturing is not the analytics platform — it is the operating model that determines how the analytics team's time is allocated. Every plant has the data infrastructure to detect patterns hours before they become production events. The question is whether the team's operating model allows them to act on those patterns or forces them to keep responding to events. The transition from event-response to pattern-detection is not a technology deployment — it is a leadership-driven change in what the team measures, how the shift meeting is structured, and what the management team discusses at the weekly review.
The FMCG plants that have made this transition report 2.5x improvement in first-pass yield, 60 to 70 percent reduction in unplanned downtime events, and a 3:1 proactive-to-reactive analytics hour ratio within 18 months. These outcomes are produced by the combination of technology platform and leadership attention — the platform alone does not create the culture, and the leadership attention does not substitute for the platform. The Shift Logbook, Automated Analytics Reporting, and Work Order Management tools provide the data architecture that makes pattern detection visible at every level of the operation, from the operator to the production director. The leadership team provides the metrics, the meeting structure, and the recognition system that directs the analytics team's capability toward prevention rather than response.
iFactory AI's platform is designed for production directors and plant managers who need to shift their analytics teams from reactive firefighting to proactive prevention. Book a Demo to see the Shift Logbook, Automated Analytics Reporting, and Work Order Management platform configured for your FMCG production lines, or talk to an expert about a free analytics culture assessment for your plant.
Frequently Asked Questions
The technology deployment takes 2 to 3 weeks. The culture transformation takes 12 to 18 months. The technology phase covers Shift Logbook deployment, pattern detection configuration, and analytics team training on the new workflow. The culture phase covers the leadership-driven changes in performance metrics, meeting structure, management reporting, and recognition systems that sustain the transition. Plants that achieve the fastest transition are those where the production director actively manages the KPI redefinition and meeting restructuring within the first month, rather than expecting the technology to drive the culture change alone. The plants that stall are those that deploy the platform, train the team, and continue measuring the same metrics — the team naturally optimises for the metrics they are evaluated on, regardless of what the platform enables. Talk to an expert to see the iFactory platform configured for your FMCG analytics culture roadmap.
The Prevention Rate — the percentage of flagged patterns that are investigated and resolved before they become production events. This single metric captures whether the analytics team's operating model has shifted from event response to pattern detection. A prevention rate below 30% indicates a reactive culture regardless of what other metrics show. A prevention rate above 60% is the inflection point where the proactive culture begins to generate measurable OEE improvement. The metric is tracked automatically by the iFactory Shift Logbook and reported at every shift start meeting, enabling the production director to see the culture shift in real time rather than waiting for end-of-quarter OEE reports to confirm the change. Talk to an expert about setting up prevention rate tracking for your plant's Shift Logbook configuration.
The Shift Logbook is the operational backbone of the analytics culture transformation because it is the tool that every shift team uses every day — operators, maintenance technicians, quality inspectors, production supervisors, and analytics team members. When the Shift Logbook surfaces prioritised pattern detection findings at the start of every shift, restructures the shift meeting agenda to review those findings before reviewing events, and tracks prevention outcomes alongside corrective actions, it becomes the daily operating mechanism that sustains the proactive culture. The Shift Logbook also feeds the Automated Analytics Reporting module, which generates the weekly prevention-focused report that shifts management attention from event metrics to trend metrics. Without the Shift Logbook integration, the analytics culture remains an analytics team initiative that never reaches the operator level. talk to an expert to see the Shift Logbook pattern detection workflow configured for FMCG production lines.
Yes. The iFactory platform supports multi-site deployment with a unified enterprise dashboard that consolidates analytics culture KPIs from every connected plant. Each plant maintains its own Shift Logbook configuration, pattern detection thresholds, and KPI targets aligned with its current maturity stage — but the production director or analytics leader at the enterprise level can view all plants on a single screen, filter by plant, product line, or maturity stage, and compare prevention rate, proactive ratio, and CAPA effectiveness across sites. The enterprise view shows each plant's current maturity stage, its trend direction, and the specific KPIs that are below target for that stage. For organisations with plants at different maturity levels, the platform enables benchmark comparison and best practice transfer — the shift meeting template that works at the Stage 3 plant can be exported to the Stage 1 plant as part of the standard deployment package. Talk to an expert about multi-plant analytics culture transformation with the iFactory platform.
Your Analytics Team Already Has the Data to Prevent Every Recurring Production Event. The Missing Piece Is the Operating Model That Lets Them Act on It — and the Shift Logbook That Makes Pattern Detection Visible at Every Level of Your Plant.
iFactory AI's Shift Logbook, Automated Analytics Reporting, and Work Order Management platform enables FMCG production directors to shift analytics teams from reactive firefighting to proactive prevention — with measurable KPIs at every maturity stage. Schedule a free analytics culture assessment for your plant.