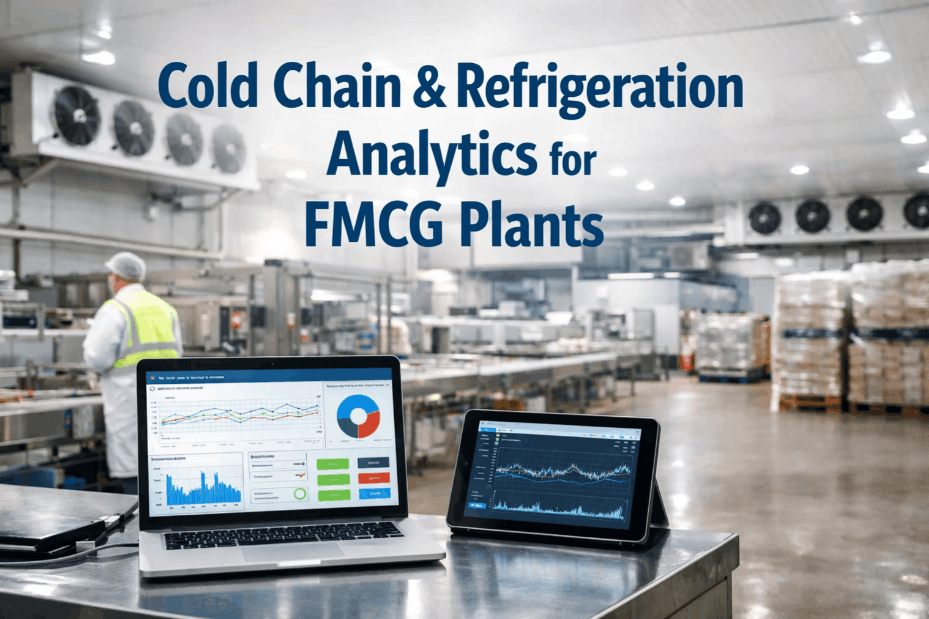
Cold Chain analytics for FMCG Protecting Product Quality from Factory to Shelf
By Seren on June 10, 2026
The FMCG cold chain is the most temperature-sensitive logistics network in the world. Perishable products — dairy, meat, poultry, seafood, frozen foods, fresh produce, and temperature-sensitive beverages — move from processing plants through cold storage warehouses, refrigerated trucks (reefers), and retail cold rooms to reach consumers within strict temperature windows. A single temperature excursion at any point in this chain can compromise product quality, reduce shelf life, trigger regulatory non-compliance, and result in millions of dollars of wasted inventory. The global food cold chain is projected to grow to over $800 billion by 2028, yet industry estimates suggest that 8–12% of all perishable food products are lost to cold chain failures annually. These losses are not random. They follow patterns — equipment degradation cycles, seasonal ambient temperature variation, loading dock exposure, and refrigeration system performance decay. iFactory's cold chain analytics platform ingests temperature data from every link in the chain — processing plant cold rooms, blast freezers, distribution centre coolers, reefer telematics units, and retail point-of-sale cold cabinets — and transforms raw temperature logs into actionable intelligence about equipment health, product quality risk, and compliance status. This guide covers how FMCG cold chain operators use analytics to protect product integrity from factory to shelf.
From Processing Plant to Retail Shelf — Protect Every Degree of Your Cold Chain
iFactory's cold chain analytics ingests temperature data from cold rooms, blast freezers, reefers, and retail cabinets — delivering real-time alerts, predictive equipment health scores, and audit-ready compliance reports that protect product quality and reduce waste.
The Cold Chain Analytics Framework: Four Layers of Temperature Protection
Effective cold chain analytics is not a single sensor or dashboard. It is a four-layer framework that extends temperature visibility and control across every handoff point where cold chain integrity can be compromised. iFactory's cold chain analytics platform implements this framework as a unified data architecture, connecting sensors, equipment controllers, and telematics systems into a single operational view.
Layer 1 — Processing & Cold Storage: Refrigeration equipment monitoring, blast freezer performance tracking, cold room temperature uniformity analysis, and compressor health analytics for processing plants and distribution centre cold storage zones.
−22°C
Target frozen storage temperature — analytics monitors every cold room and blast freezer against this setpoint with real-time deviation alerts
±1.5°C
Acceptable temperature variation across cold room zones — analytics flags uniformity deviations that indicate airflow issues or door seal degradation
4–6
Weeks of advance warning on compressor failure provided by predictive analytics on discharge pressure and superheat trends
35%
Reduction in cold storage energy consumption achievable with analytics-driven defrost cycle optimisation and condenser coil cleaning scheduling
Compressor Health Monitoring
Discharge pressure, suction pressure, superheat, subcooling, and compressor current draw tracked against baseline models. Predictive algorithms detect performance degradation — rising discharge pressure with declining subcooling signals condenser fouling; increasing superheat with falling suction indicates refrigerant charge loss. Alerts generated 3–6 weeks before critical failure.
Cold Room Temperature Uniformity
Multi-point temperature sensors across each cold room zone monitor spatial temperature variation. Analytics detects stratification, hot spots near doorways, and cold spots near evaporator coils. Uniformity index reported per room with recommended corrective actions — door seal replacement, fan speed adjustment, or product racking reconfiguration.
Blast Freezer Performance Analytics
Blast freezer cycle time, pull-down rate, coil temperature differential, and fan performance tracked per cycle. Analytics compares actual pull-down curves against design specifications and historical performance. Degrading pull-down rate triggers evaporator coil inspection and defrost system verification before product quality is affected.
Condenser and Evaporator Coil Health
Coil temperature differential across condensing and evaporating sides tracked continuously. Rising temperature differential at constant ambient conditions indicates coil fouling. Analytics calculates optimal cleaning schedule based on coil degradation rate, ambient dust loading, and projected energy impact — preventing the efficiency loss that precedes capacity reduction.
Layer 2 — Refrigerated Transport: Reefer unit telemetry analytics, door open event monitoring, temperature excursion detection during loading/unloading, and predictive maintenance for transport refrigeration units operating across variable ambient conditions.
Reefer Telemetry Analytics
Refrigerated trailer and container telemetry data — supply air temperature, return air temperature, engine run-time, fuel level, and refrigeration cycle status — ingested and analysed continuously. Analytics detects performance anomalies: rising supply-return temperature differential indicating airflow obstruction, short cycling indicating control system issues, and fuel consumption deviation indicating engine efficiency degradation.
Door Open Event Monitoring
Reefer door open events detected via temperature spike, humidity change, and telemetry status. Analytics correlates door events with temperature excursion duration, ambient temperature at time of opening, and product temperature recovery time. Excessive door open duration or frequency during loading/unloading triggers process alerts for dock supervisor intervention.
Ambient Temperature Correlation
Reefer performance correlated with ambient temperature along the route. Analytics identifies refrigeration capacity degradation that only becomes visible under high ambient load — a reefer that maintains setpoint at 25°C but struggles at 38°C requires maintenance before the next summer season. Route-specific ambient profiles enable predictive capacity planning for seasonal demand.
Reefer PM Optimisation
Preventive maintenance scheduling for transport refrigeration units based on actual run-time hours, cycle counts, and performance degradation rather than fixed calendar intervals. Analytics generates PM recommendations with priority scores — a unit with declining condenser performance and high ambient exposure receives higher priority than a unit operating well within parameters.
Layer 3 — Distribution Centre Cold Operations: Cold storage warehouse zoning analytics, automated storage and retrieval system (ASRS) temperature monitoring, cross-dock temperature exposure tracking, and energy optimisation for large-scale refrigeration systems.
Cold Storage Zoning Analytics
Distribution centre cold storage divided into temperature zones — freezer, deep chill, chill, and ambient — each with independent monitoring and alerting thresholds. Analytics tracks temperature compliance per zone, door open frequency, and product dwell time. Zone handover points — where product moves from freezer to chill for order picking — monitored for temperature excursion risk.
Cross-Dock Temperature Exposure
Product temperature exposure during cross-dock operations — from cold storage to dock staging to reefer loading — tracked with time-temperature analytics. Dock zone temperature sensors and product temperature probes provide real-time visibility into the highest-risk segment of the cold chain. Analytics generates dock productivity recommendations to minimise door open time.
Refrigeration Energy Optimisation
Large-scale DC refrigeration systems consume 40–60% of total DC energy. Analytics tracks compressor rack performance, condenser tower efficiency, and evaporator effectiveness across all cold zones. Defrost cycle optimisation — triggered by actual frost accumulation rather than fixed timers — reduces energy consumption by 25–35% while maintaining temperature compliance.
ASRS Temperature Monitoring
Automated storage and retrieval system lanes within cold storage zones monitored at multiple elevation levels. Temperature stratification within ASRS racks — warmer at the top, colder at the bottom — tracked against product storage requirements. Analytics generates lane assignment recommendations based on product temperature sensitivity and dwell time.
Layer 4 — Retail Cold Cabinets & Last-Mile Delivery: Point-of-sale refrigeration monitoring, open-front cabinet temperature uniformity, last-mile delivery temperature tracking, and consumer-facing cold chain transparency data.
Retail Cabinet Analytics
Open-front refrigerated cabinets in retail environments monitored for temperature compliance at multiple shelf levels. Analytics tracks defrost cycle impact on product temperature, night blind coverage effectiveness, and cabinet proximity to HVAC diffusers that affect temperature uniformity. Retail cabinets with persistent compliance deviations flagged for maintenance or replacement planning.
Last-Mile Temperature Tracking
Refrigerated last-mile delivery vehicles and insulated bags monitored with temperature loggers and GPS-tracked route data. Analytics correlates delivery stop duration with temperature excursion risk, ambient temperature exposure, and cooler/freezer bag performance. Delivery route optimisation recommendations incorporate temperature exposure risk alongside distance and time constraints.
Cold Chain Transparency Dashboard
Consumer-facing cold chain transparency data — product temperature history from processing to retail shelf — generated from the analytics platform for brands that offer supply chain traceability. Temperature compliance certificates generated per batch with time-temperature history, storage condition verification, and handling audit trail.
Compliance & Audit Reporting
Automated cold chain compliance reports generated for FDA Food Safety Modernization Act (FSMA) Preventive Controls, USDA Food Safety and Inspection Service (FSIS) cold holding requirements, and international HACCP standards. Temperature excursion events logged with root cause analysis, corrective action documentation, and batch disposition records.
Temperature Excursion Detection and Root Cause Analytics
Temperature excursions — periods when product temperature moves outside the specified range — are the core metric of cold chain performance. Every excursion represents a product quality risk, a potential regulatory compliance issue, and a financial liability. However, not all excursions are equal. A 15-minute temperature spike during dock loading in a 35°C ambient environment has a different product quality impact than a slow 2-hour drift during a refrigeration compressor failure. iFactory's excursion analytics engine classifies every temperature excursion by magnitude, duration, product sensitivity, and root cause category — enabling cold chain managers to prioritise response actions based on actual product risk rather than a binary alarm threshold. Book a Demo to see excursion analytics
Without Cold Chain Analytics
Temperature alarms from individual sensors with no correlation to product location, ambient conditions, or equipment status
Excursion root cause investigation requires manual review of equipment logs, weather data, and operator reports — 2–4 hours per significant excursion
Compliance documentation assembled post-excursion from multiple data sources — incomplete data lineage limits audit defensibility
Reefer fleet maintenance scheduled by calendar interval regardless of actual performance degradation or ambient exposure
Cold storage energy consumption tracked manually — no correlation between refrigeration system performance, ambient conditions, and energy cost
Product disposition decisions made with incomplete temperature history — conservative decisions lead to unnecessary waste write-offs
With iFactory Cold Chain Analytics
Temperature alarms correlated with product location, ambient temperature, refrigeration equipment status, and door open events — context-rich alerts with root cause classification
Root cause analysis generated automatically — analytics correlates temperature excursion with equipment telemetry, ambient data, and operator actions in a single incident timeline
Compliance reports generated automatically with complete data lineage from sensor to report — audit-ready documentation with one click
Reefer fleet PM scheduled dynamically based on run-time hours, performance degradation trends, and ambient exposure history — units that need service get it before they fail
Refrigeration energy consumption tracked in real-time with performance correlation — energy optimisation opportunities identified as they emerge, not when monthly bills arrive
Product disposition decisions supported by complete time-temperature history and quality impact model — enabling confident release decisions that reduce unnecessary waste by 30–50%
Refrigeration Equipment Reliability: The Foundation of Cold Chain Integrity
Cold chain analytics is fundamentally dependent on refrigeration equipment reliability. When a compressor fails, a condenser fan stops, or a refrigerant charge leaks, the temperature excursion that follows is not a cold chain failure — it is a maintenance failure that manifests as a temperature event. iFactory's refrigeration equipment reliability module monitors the health of every compressor, condenser, evaporator, and control valve in the cold chain, predicting failures 3–6 weeks before they occur and enabling planned maintenance that prevents temperature excursions before they start.
3–6
Weeks of advance warning on compressor failure provided by predictive analytics on discharge pressure, superheat, and current draw trends
60%
Reduction in cold chain temperature excursions achieved by plants with predictive refrigeration maintenance vs. calendar-based PM programs
25–35%
Energy savings from analytics-driven defrost cycle optimisation and condenser cleaning scheduling based on actual condition rather than fixed intervals
$2.8M
Average annual cold chain loss reduction for a mid-sized FMCG processor deploying full cold chain analytics across processing, DC, and transport operations
"We operate 14 cold storage freezers across three distribution centres, with a fleet of 38 reefers serving 2,200 retail locations. Before iFactory cold chain analytics, we were managing temperature monitoring as a compliance exercise — recording temperatures, filing reports, and reacting to alarms. The problem was that by the time a temperature alarm activated, product quality was already affected. The first time iFactory's predictive refrigeration analytics flagged a compressor on DC2 freezer 7 — discharge pressure trending 12% above baseline, subcooling declining 3°C over 10 days — we scheduled the condenser cleaning and refrigerant top-up during planned weekend maintenance. The compressor would have failed the following Wednesday at 14:00 during peak summer ambient load. That one alert prevented 18 pallets of frozen product from entering a temperature excursion that would have triggered a write-off worth $47,000 and a FSMA reportable event. The analytics paid for the entire first year's subscription in that single incident.— Director of Cold Chain Operations, National Frozen Food Processor — 3 DCs, 38 Reefers, 2,200 Retail Locations
Cold Chain Compliance Analytics: From Sensor Data to Audit-Ready Reports
Cold chain compliance documentation is no longer a paper-based exercise filed in binders for regulator inspection. The FDA Food Safety Modernization Act (FSMA) Preventive Controls rule requires that preventive controls for cold chain hazards are monitored, corrective actions are documented, and verification activities are recorded — with records subject to regulatory inspection upon request. iFactory's compliance analytics module generates audit-ready cold chain reports automatically from the temperature data, equipment telemetry, and corrective action records maintained in the platform — reducing the hours engineering and quality assurance teams spend on compliance documentation.
Cold Chain Compliance Data Flow — iFactory Analytics Model
Temperature Monitoring
Continuous temperature data from cold rooms, reefers, retail cabinets, and last-mile delivery logged with time, location, and product association.
Excursion Detection
Temperature excursions detected and classified by magnitude, duration, product sensitivity, and root cause category with automated alerting.
Root Cause Analysis
Equipment telemetry, ambient data, and operator actions correlated with excursion timeline. Root cause classified and corrective action tracked.
Compliance Report
FSMA/FSIS/HACCP-compliant reports generated automatically with complete data lineage, corrective action records, and batch disposition.
Cold Chain Analytics, Data Sources, and Compliance Framework Alignment
The table below maps the core cold chain analytics capabilities to their data sources, regulatory frameworks, and iFactory module features — providing a reference for cold chain operators evaluating analytics platform requirements for their specific compliance and operational needs.
Analytics Capability
Data Sources
Regulatory Framework
iFactory Module
Operational Value
Cold room temperature monitoring
Room temperature sensors, evaporator coil temp, door sensors
FDA FSMA Preventive Controls, 21 CFR 110, HACCP
Temperature Monitoring
Real-time compliance; product quality protection; energy optimisation
Reefer telemetry analytics
Supply/return air temp, engine run-time, fuel level, GPS
Every Degree of Cold Chain Protection — From Sensor Data to Product Integrity
iFactory's cold chain analytics ingests temperature data from every link in the FMCG cold chain — processing plant cold rooms, blast freezers, DC coolers, reefer telematics, and retail cabinets — delivering real-time alerts, predictive equipment health scores, and audit-ready compliance reports that protect perishable product quality from factory to shelf.
Frequently Asked Questions: Cold Chain Analytics for FMCG
What temperature sensors and data loggers does iFactory cold chain analytics integrate with?
iFactory's cold chain analytics platform integrates with all major industrial temperature sensors and data logger systems through standard protocols — OPC-UA, Modbus TCP, MQTT, and REST API. Supported hardware includes wireless temperature loggers from Sensitech, Monnit, Onset, and ELPRO, PLC-connected RTD and thermocouple sensors, reefer telematics platforms from Thermo King and Carrier Transicold, and retail cabinet monitoring systems. The platform normalises data from any sensor type into a unified temperature monitoring dashboard — no proprietary hardware required.
How does the platform distinguish between a temperature excursion caused by equipment failure vs. one caused by an operational issue like a door being left open?
The analytics engine correlates every temperature excursion with contextual data streams — refrigeration equipment telemetry (compressor status, defrost cycle, coil temperature), zone-level door sensors, ambient temperature from local weather feeds, and product location data. A temperature spike accompanied by a door open event and stable refrigeration parameters is classified as an operational excursion. A temperature drift accompanied by rising discharge pressure and declining superheat is classified as an equipment-related excursion. Each excursion event is tagged with a root cause classification, confidence score, and recommended corrective action type enabling the cold chain manager to dispatch the right response.
Can the platform generate FSMA-compliant cold chain documentation for FDA inspections?
Yes. iFactory's compliance analytics module generates cold chain reports aligned with FDA FSMA Preventive Controls rule requirements (21 CFR Part 117) and the FSMA Sanitary Transportation rule (21 CFR Part 1.900). Reports include temperature monitoring records with complete data lineage, excursion event logs with root cause analysis and corrective action documentation, equipment maintenance records, and batch-level temperature traceability. The platform maintains an immutable audit trail for every reported metric — from the original sensor reading through any transformations to the final report — meeting the recordkeeping requirements for FDA inspection readiness.
What is the typical timeline and investment to deploy iFactory cold chain analytics across a multi-site FMCG cold chain operation?
A single-site deployment — one processing plant or distribution centre with reefer fleet integration — typically requires 4–8 weeks from kickoff to first temperature monitoring dashboard and compliance report generation. Multi-site deployments scale with reduced per-site timelines as integration patterns are replicated. The investment ranges from $35,000 to $85,000 per site depending on the number of sensors, reefer telemetry integration complexity, and regulatory reporting frameworks required. Most operations achieve full cost recovery within 6–12 months through reduced product waste, energy savings from refrigeration optimisation, and reduced engineering hours for compliance documentation.
How does cold chain analytics integrate with existing WMS, TMS, and ERP systems?
iFactory cold chain analytics integrates with warehouse management systems (WMS), transportation management systems (TMS), and enterprise resource planning (ERP) platforms through REST API and database connectors. Product location data from the WMS enables batch-level temperature traceability. Route data from the TMS enables ambient temperature correlation for reefer performance analytics. Inventory and cost data from the ERP enables financial impact calculation for temperature excursions and product write-offs. Integration timelines are typically 1–3 weeks per system.
Conclusion: Cold Chain Analytics Is the Difference Between Product Protection and Product Loss
The FMCG cold chain is not getting simpler. Ambient temperatures are rising, supply chains are lengthening, regulatory requirements are tightening, and consumer expectations for product quality and transparency are increasing. Cold chain operators who rely on manual temperature log reviews, calendar-based refrigeration PM, and reactive excursion response are fighting a losing battle against the structural fragility of the temperature-controlled supply chain. Every minute between a compressor performance drift and its detection is a minute of product quality risk. Every hour spent assembling compliance documentation from multiple data sources is an hour not spent optimising cold chain operations.
iFactory's cold chain analytics platform offers a fundamentally different approach: a continuously operating data architecture that connects every temperature sensor, every refrigeration controller, every reefer telemetry unit, and every compliance record in your cold chain into a unified analytics environment. The platform monitors temperature in real time, predicts equipment failure before it causes excursions, generates compliance reports automatically, and quantifies the product quality and financial impact of every cold chain decision. The sensors are already in your cold rooms. The telemetry is already in your reefers. The data is already being generated. The question is whether you have the analytics architecture to turn that data into cold chain intelligence that protects product quality and your bottom line.
Your Cold Chain Is Generating Temperature Data Every Second. iFactory Turns It Into Product Quality Protection.
iFactory's cold chain analytics connects your temperature sensors, refrigeration controllers, reefer telematics, and compliance records into a single analytics platform — generating real-time alerts, predictive equipment health scores, and audit-ready compliance reports from the data your cold chain already produces every minute of every day. Trusted by FMCG processors, distributors, and retailers across North America for product quality protection, regulatory compliance, and cold chain operational excellence.