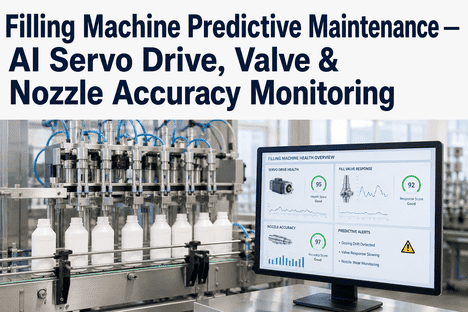
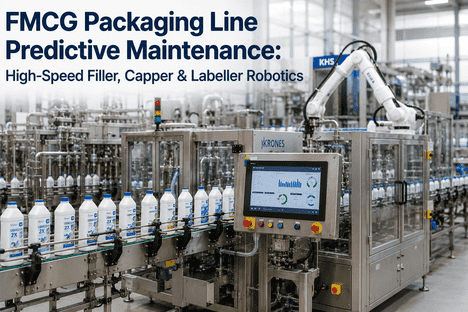
Filling machine failures don't announce themselves — they cascade. A worn nozzle causes underfill, an erratic valve creates product spillage, and a degrading drive system halts the entire bottling line before your maintenance team even opens a ticket. For FMCG manufacturers, filling line stoppages directly translate to missed production targets, SLA penalties, and product quality failures that reach retail shelves. Filling machine predictive analytics powered by AI-driven sensor monitoring changes this equation entirely — shifting your maintenance strategy from reactive firefighting to precision-timed intervention before the line ever goes down. Book a demo to see how iFactory's AI monitoring platform predicts filling equipment failures weeks before they occur.
Predict Filling Machine Failures Before They Stop Your Line
iFactory's AI sensor platform monitors fill accuracy, valve performance, nozzle wear, and drive systems in real time — delivering predictive alerts that prevent costly FMCG production stoppages.
Why Filling Line Downtime Is the Most Expensive Problem in FMCG Manufacturing
Unplanned downtime on a high-speed filling line costs FMCG manufacturers between $5,000 and $50,000 per hour — and filling equipment accounts for up to 38% of all unplanned stoppages in beverage and liquid product plants. The economic case for filling machine predictive analytics is not theoretical; it is the difference between profitable production runs and chronic margin erosion driven by reactive maintenance cycles.
Traditional time-based preventive maintenance schedules for filling machines are designed around worst-case assumptions — replacing parts far earlier than necessary, or missing component-specific degradation patterns that don't align with generic PM intervals. AI-powered filler predictive analytics eliminates both failure modes by continuously reading actual equipment health rather than relying on calendar-based guesswork.
The 5 Filling Machine Failure Modes AI Sensors Detect First
Filling machine predictive analytics works by correlating multi-sensor data streams against learned baseline signatures for each failure mode. These are the five most common — and most costly — failure patterns iFactory's AI monitors across FMCG bottling and liquid filling lines.
How AI-Powered Filling Machine Sensor Monitoring Works in Practice
Implementing filling machine predictive analytics requires more than installing sensors. The intelligence layer — AI models trained on filling equipment physics, failure libraries, and your specific line's operational signature — is what separates actionable predictions from raw data noise. Here's how iFactory's platform operates across the full detection-to-intervention cycle.
Multi-Sensor Data Acquisition
IIoT sensors capture data from valves, drives, and nozzles at high frequency. iFactory connects via OPC-UA, Modbus, and MQTT — no PLC replacement needed. Book a demo for a live walkthrough.
AI Baseline Learning
Over 2–4 weeks, AI builds equipment-specific baselines across all SKUs, speeds, and temperatures. The system separates real degradation from normal process variation — reducing false alerts.
Predictive Alert & Work Order
When a failure threshold is crossed, iFactory auto-generates a work order with component details, failure type, and estimated time-to-failure. Alerts reach technicians instantly via mobile.
Continuous Model Improvement
Every confirmed failure and false-positive feeds back into the AI model. Prediction accuracy improves over time, compounding ROI quarter over quarter.
Reactive vs. Preventive vs. Predictive Maintenance for Filling Lines
Understanding the performance and cost difference between maintenance strategies is essential for building the business case for filling machine predictive analytics investment.
| Metric | Reactive Maintenance | Time-Based PM | AI Predictive (iFactory) |
|---|---|---|---|
| Average Downtime per Failure Event | 4–12 hours | 1–3 hours (planned) | Near-zero (intervene before failure) |
| Fill Level Accuracy Monitoring | Post-QC detection only | Periodic manual checks | Continuous AI trend analysis |
| Nozzle & Valve Replacement Timing | After failure | Fixed calendar interval | Condition-triggered at optimal point |
| Spare Parts Inventory Requirement | High (emergency buffer) | Moderate | Optimized — 20–35% reduction |
| Production Planning Integration | Impossible — unplanned | Partial — fixed schedule | Full — maintenance windows planned weeks ahead |
| Drive System Health Visibility | None until failure | Lubrication/inspection only | Continuous vibration + thermal monitoring |
| ROI Payback Period | Negative (costs accumulate) | 12–24 months | 6–14 months typical |
Which FMCG Filling Lines Benefit Most from Predictive Analytics
Filling machine predictive analytics delivers measurable ROI across all liquid and semi-liquid filling equipment types in FMCG manufacturing. The highest-value applications share one characteristic: high line speed combined with high downtime cost per hour.
Beverage Filler Analytics
High-speed rotary fillers running 10,000–120,000 containers/hr face the highest downtime cost in FMCG. iFactory monitors counter-pressure valves, star wheel drives, and fill accuracy in real time. Book a demo for beverage-specific dashboards.
Personal Care Filling Lines
Shampoo, detergent, and lotion lines deal with viscosity variation and nozzle clogging. AI monitoring tuned to non-Newtonian fluids prevents fill weight variance and spillage events before they reach QC.
Food & Sauce Fillers
Piston and pump fillers for sauces, soups, and dairy operate under strict CIP requirements. iFactory monitors fill accuracy and sanitation cycle effectiveness together in one platform.
Pharmaceutical Filling Lines
Sub-milliliter fill accuracy with cleanroom environmental monitoring — iFactory gives pharma-grade lines the dual compliance and quality visibility their tolerances demand.
iFactory Filling Machine Predictive Analytics: Platform Capabilities
iFactory's FMCG filling line monitoring platform integrates sensor intelligence, AI anomaly detection, and maintenance workflow automation into a single operational system — replacing disconnected data sources with actionable predictive insight.
AI continuously tracks fill weight across every station. Accuracy drift is flagged before QC limits are breached — triggering valve recalibration, not a recall.
Each fill valve gets an independent AI health score based on pressure patterns and cycle data. Replace one valve at a time — not the entire manifold.
AI builds wear progression curves per nozzle. End-of-life alerts are scheduled during CIP windows — not emergency stops. Blockage detection runs continuously.
FFT vibration analysis on motors and gearboxes detects bearing wear and gear mesh faults weeks ahead. Thermal sensors confirm degradation before failure occurs.
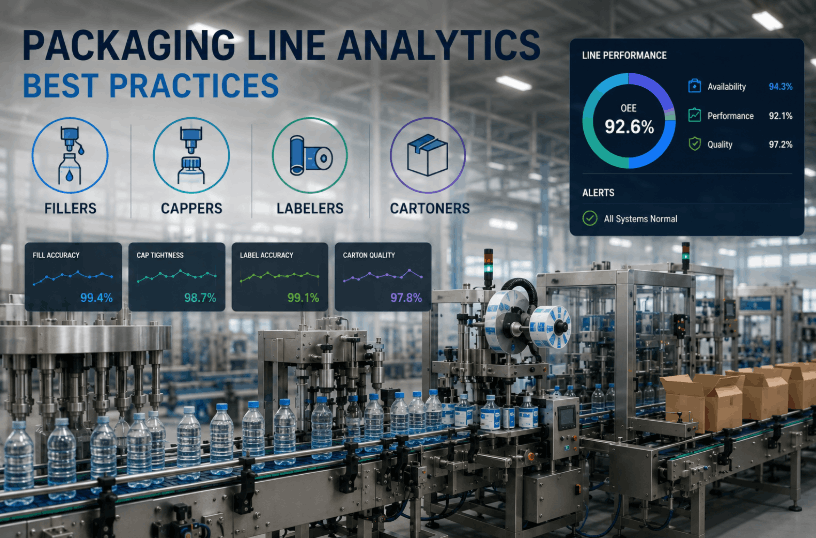
Availability, performance, and quality data are auto-calculated into a live OEE score. No manual entry. Book a demo for multi-site OEE visibility.
Predictive alerts auto-generate work orders in SAP PM, Maximo, or iFactory's native CMMS — prepopulated with component, parts, and labor details.
Your Filling Line Is Generating Failure Signals Right Now. Are You Reading Them?
iFactory's AI sensor platform translates filling machine vibration, pressure, flow, and thermal data into predicted failure dates and actionable maintenance work orders — before downtime happens.
How to Implement Filling Machine Predictive Analytics Without Disrupting Production
The most common barrier to filling machine predictive analytics adoption is operational disruption risk during sensor installation and system commissioning. iFactory's phased implementation methodology is designed specifically for 24/7 FMCG production environments where stopping the line for sensor installation is not an option.
Engineers assess the filling line and identify sensor placement points for each failure mode — planned around existing maintenance windows.
IIoT sensors are installed during scheduled CIP or changeover windows. Edge nodes are commissioned and integrated with existing PLC infrastructure and CMMS systems. Data streams validated before AI training begins.
AI builds equipment-specific baselines across all SKUs and shift patterns. Anomaly detection goes live and is refined through technician feedback.
Auto work orders, OEE reporting, and spare parts optimization go live. Monthly reviews drive continuous model accuracy improvement.
Filling Machine Predictive Analytics: Frequently Asked Questions
Stop Letting Filling Line Failures Define Your Production Schedule.
iFactory's AI-powered filling machine predictive analytics monitors every valve, nozzle, drive system, and fill accuracy parameter in real time — delivering predicted failure dates and auto-generated work orders that keep your bottling and filling lines running at rated efficiency.