AI Fill Level Monitoring for FMCG Production Lines
By Seren on June 2, 2026
Fill level inconsistency is one of the most expensive hidden problems in FMCG manufacturing. A single filling line running just 2% over target gives away thousands of dollars in product every month, while underfills trigger consumer complaints, regulatory penalties, and costly recalls. At modern line speeds of 800 to 1,200 containers per minute, a fill head drifting just 0.8% low is invisible to traditional checkweighers operating within standard ±3% tolerance — yet over a 16-hour shift, that drift on one head alone gives away 4,300 units worth of product. Across a 24-head filler with normal mechanical drift, a plant can ship over a million dollars in free product every year. AI vision fill level monitoring solves this by inspecting every single container at full line speed, measuring fill height with sub-millimeter accuracy, and detecting fill head drift before it produces a single non-compliant unit. iFactory AI's vision platform, including its Shift Logbook and AI inspection engine, enables FMCG producers to deploy AI fill level monitoring without replacing existing fillers, checkweighers, or line control systems. Book a Demo to see how iFactory eliminates fill-level giveaway across your production lines.
FMCG · FILL LEVEL MONITORING · AI VISION · 2026
AI Fill Level Monitoring for FMCG Production Lines
AI-powered fill level verification at 100% coverage and line speed — detecting underfill, overfill, and valve drift before non-compliant product reaches the checkweigher, the retailer, or the trading standards inspector.
Why Traditional Fill Monitoring Is Hitting Its Ceiling in FMCG Production
The traditional approach — periodic manual spot-checks, checkweigher sampling, and reactive rejection sorting — treats every container identically regardless of actual fill performance. A checkweigher measures total weight and catches gross underfill and overfill, but it misses fill level variance within tolerance bands that creates cumulative product giveaway and regulatory exposure. A 1% low-drift across a 12-head filler running 800 units per minute represents 144,000 ml of product giveaway per hour — invisible to any checkweigher configured within standard ±3% tolerance. Four specific ceilings are visible across every high-speed filling operation.
01
Sampling Blind Spots
Checkweighers sample 1 in 20 to 1 in 50 containers. Between samples, drifting fill heads can produce thousands of non-compliant units. At 1,200 BPM, a fill head that drifts 2% low produces 340 underfilled bottles in the 17 seconds between detection and rejection confirmation.
Gap: Sampling vs 100% inspection
02
Giveaway Blindness
Checkweighers within ±3% tolerance cannot detect 0.3–2% overfill drift. This invisible giveaway costs $500K–$2M per line annually. AI vision detects drift at 0.3% — recovering product that checkweighers treat as acceptable.
Gap: Tolerance-blind vs Drift-aware
03
No Per-Head Localization
Checkweighers measure total weight — they cannot identify which specific fill head is drifting. When underfill is detected, the entire filler must be investigated. AI vision identifies the exact head position, enabling targeted maintenance within minutes rather than hours of line downtime.
Gap: Total weight vs Per-head data
04
Reactive Maintenance
Checkweigher reject events trigger corrective sorting but no maintenance action. The drifting fill head continues operating until the next scheduled PM — or until the next checkweigher sample catches it again. AI vision triggers automatic work orders to the specific valve asset at the first deviation, preventing drift from compounding.
Gap: Reactive vs Predictive maintenance
What AI Fill Level Monitoring Actually Measures — and What It Catches That Checkweighers Miss
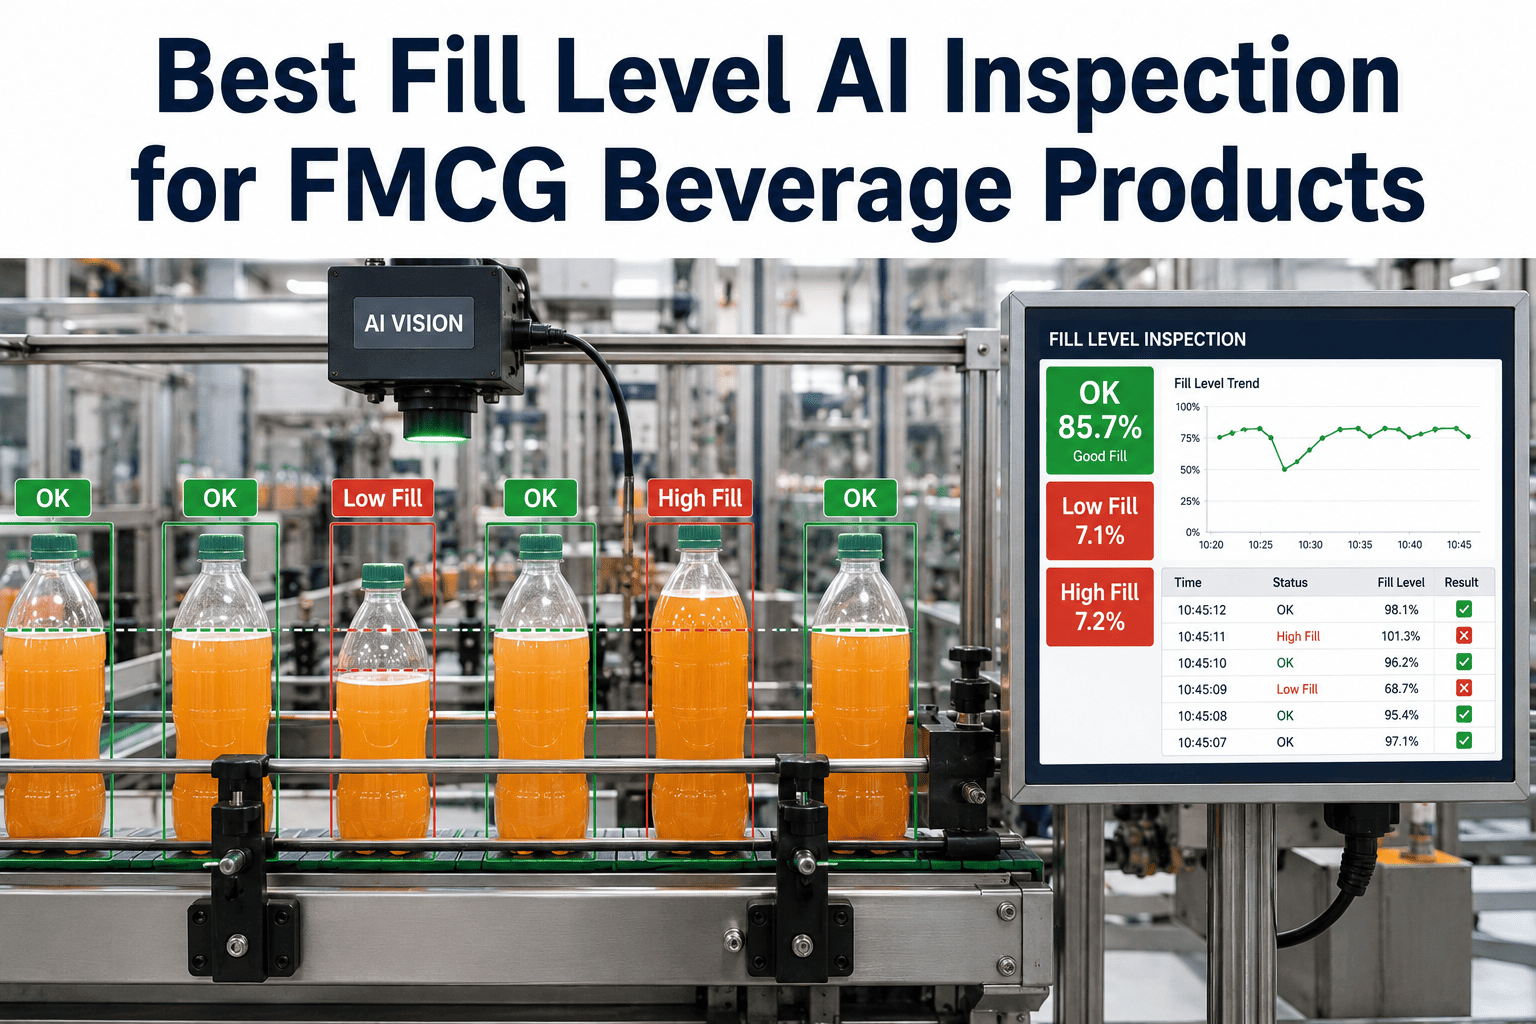
AI fill level monitoring uses high-speed cameras positioned at the discharge of the filler to capture an image of every single container. Deep learning algorithms trained on millions of container images analyze each frame in milliseconds, measuring fill level against target specifications and detecting anomalies that checkweighers and sampling methods miss entirely. The system doesn't just reject bad units — it provides real-time fill-head-level performance data that enables operators to make micro-adjustments before giveaway accumulates or underfills escape. iFactory connects this fill data with the Shift Logbook for shift handovers and maintenance coordination.
Quality Control Parameter
Checkweigher Only
AI Fill Level Monitoring
Coverage rate
100% — weight only
100% — fill level + weight independent verification
Within-tolerance giveaway detection
None — tolerance band invisible
Detects 0.3% low drift — invisible to checkweigher
Per-head fault localization
No — total weight only
Yes — fill level by head position
Valve drift detection
Only if weight exits tolerance
Detects progressive drift before tolerance breach
Maintenance trigger
None — no asset linkage
Automatic work order to specific valve asset
Audit documentation
Weight records only
Per-unit fill inspection records with batch traceability
Foam / aeration detection
None
Detects foam head as fill level deviation from product meniscus
Product giveaway reduction
Minimal — reactive only
2.4% average reduction across monitored lines
Fill Level Monitoring Technologies — Matching the Method to the Container
Different container types and product formats demand different sensing approaches. AI fill monitoring uses multiple technologies to achieve accurate fill measurement across every packaging format in FMCG production — from clear glass bottles to opaque HDPE jugs, aluminum cans to flexible pouches. Selecting the right technology for your specific container and product combination determines system accuracy and false-reject performance.
L
Transmitted Light (Liquid)
Camera backlit with structured light measures meniscus position. Accurate to ±0.5 mm fill height. Detects fill variation across all heads simultaneously. Works on glass, clear PET, and HDPE bottles. AI models handle bubbles, foam, reflections, and varying container transparency.
Accuracy: ±0.5 mm · Max speed: 1,200+ cpm
X
X-Ray / Gamma Fill Inspection
Measures product mass distribution independent of container opacity. Detects fill level, foreign object inclusion, and void space simultaneously. Used for canned goods, foil pouches, opaque containers, and metal packaging where optical methods cannot penetrate.
Accuracy: ±1.0 mm · Max speed: 1,000+ cpm
N
NIR Absorption Imaging
Detects product presence and density variation in high-viscosity fills — sauces, pastes, and thick dairy products where transmitted light cannot penetrate. Distinguishes product from air void at product/air boundary. Ideal for opaque and viscous products.
Accuracy: ±0.8 mm · Max speed: 800+ cpm
3
3D Laser Profiling
Laser line scanner creates 3D surface height map of solid or granular product in open containers — detects low-fill, product bridging, and void pockets in snack, cereal, and powder applications. Measures actual volume, not just height.
Accuracy: ±1.0 mm · Max speed: 600+ cpm
The Keep / Retire / Transform / Replace Decision Matrix
Migration discipline starts here. Every fill quality management artifact in your current operation falls into one of four categories. Getting the categorization right in week one of the workshop saves quarters of debate later.
Keep
Core line foundations
Filler PLC and servo controls
Checkweigher for gravimetric verification
Reject mechanisms and actuators
Container handling and conveyance
Line SCADA and operator HMI
Established capabilities. No business case to replace. AI vision adds an intelligence layer above these systems, not a replacement.
Retire
Legacy inspection layers
Periodic manual spot-check sampling
Paper fill inspection logs
Standalone checkweigher-only QC
Manual fill head calibration tracking
Email-based fill deviation alerts
Replaced by AI-driven 100% vision inspection with per-head localization. 70–90% reduction in manual fill checking effort.
Transform
Fill quality workflows
Fill level trending and SPC analysis
Per-head valve performance tracking
Giveaway cost reporting per asset
Recipe-based changeover management
Shift handover fill quality reports
Become AI vision invocations grounded in real-time container data. Intelligence upgraded via iFactory platform.
Replace
Alert & notification layer
Manual fill deviation notification
Paper-based shift logbooks
Standalone QC alert systems
Siloed fill inspection spreadsheets
Email-based giveaway reporting
Event-driven AI alert engine replaces manual notification. Fill deviation triggers automatic work order creation to specific valve asset.
Want this matrix applied to your specific filling lines in a working session? Book a Demo to walk through every line and prioritize your AI fill monitoring rollout.
Three Deployment Paths for AI Fill Level Monitoring
Same starting point, three valid destinations. The right path depends on line speed, container diversity, regulatory exposure, and current QC instrumentation. Operators that pick the wrong path spend months in pilot purgatory. Operators that pick the right path deploy in 4–8 weeks.
Path A
Augment in Place
4–6 weeks
AI vision monitoring runs alongside existing checkweigher QC. Shadow mode for 2 weeks. Fill deviation alerts flow to operator HMI. No line modifications or legacy system changes.
Best fit
Regulated environments · first AI deployment · risk-averse operations · limited line modification tolerance
Wk 1–2 Camera installation + model training
Wk 3–4 Shadow mode + threshold tuning
Wk 5–6 Operator HMI integration live
Path B
Hybrid Migration
6–8 weeks
AI vision becomes primary fill inspection layer. Checkweigher retained for gravimetric calibration. Legacy manual spot-checks retired. Fill data feeds Shift Logbook and maintenance workflows.
Legacy manual fill inspection retired. AI vision provides full fill level monitoring with automatic work order creation, giveaway reporting, and audit documentation. All lines covered.
Best fit
Large multi-line operations · high giveaway exposure · strategic platform consolidation · multiple SKU changeovers
Wk 1–4 Full line inventory + matrix
Wk 5–9 Parallel build + model training
Wk 10–12 Cutover + legacy QC sunset
Pick the Right Deployment Path for Your Filling Lines — 90-Minute Workshop
iFactory AI's FMCG practice runs a focused workshop against your specific line configurations, container formats, product types, and current QC workflows. You leave with a defended path recommendation, an 8-week deployment plan, and a giveaway reduction projection grounded in your actual production data.
The ROI Math — What AI Fill Level Monitoring Delivers for FMCG
The business case for AI-native fill level monitoring isn't about software cost — it's about cost avoidance on product giveaway, regulatory penalties, and recall events. Operations moving from checkweigher-only to AI vision fill monitoring see measurable improvements across four metrics in the first quarter post-deployment.
2–3%
Giveaway reduction
AI monitoring typically reduces effective overfill from 2–4% to 0.3–0.8% above declared volume. On a high-speed line producing 100M units annually, each 0.5% giveaway reduction saves $200K–$500K per year.
60–90 d
Typical payback period
Most beverage and food lines see positive ROI within 60–90 days of installation. Giveaway reduction alone recovers system cost within the first quarter on high-volume lines.
$500K–$2M
Recovered per line annually
Product giveaway recovered per high-speed filling line through precision fill control. Underfill prevention adds avoided regulatory fines and retail chargebacks.
±0.3–0.5%
Fill variance achieved
AI-monitored lines with closed-loop feedback achieve ±0.3–0.5% fill variance vs ±1.2–1.8% on checkweigher-only controlled lines — 3–4x improvement.
Expert Perspective
"The single biggest mistake FMCG operators make in fill level monitoring is treating AI vision as a checkweigher replacement. It isn't. Your checkweigher continues providing gravimetric verification — it's a mature, reliable technology with no business case to replace. What needs to change is what happens upstream of the checkweigher. Sampling-based QC and periodic manual spot-checks need to migrate to 100% AI vision inspection that catches every container at every head, every shift, every day — with the same performance at minute one and minute four-hundred-eighty. The giveaway math is straightforward: every 1% of overfill you eliminate on a line running a million units per day at $0.15 per unit is $1,500 per day recovered. AI vision doesn't just find the giveaway — it identifies which specific fill head is causing it and creates a maintenance work order for that valve, so the drift is fixed in hours, not months. Operators that frame it correctly deploy in 4–8 weeks. Operators that frame it as rip-and-replace spend months evaluating vendors instead of recovering product."
— iFactory AI FMCG Quality Practice, 2026 industry insight
4–8 wk
hybrid deployment with pre-configured fill inspection models
100%
container inspection at line speed — no sampling gaps
Zero rip
of existing fillers, checkweighers, or line controls required
Conclusion: The Modernization Decision Has Three Right Answers
Sampling-based fill quality programs aren't failing in FMCG — they're hitting an architectural ceiling that periodic manual checking and checkweigher-only QC can't cross. AI vision fill level monitoring adds the container-by-container intelligence layer that traditional systems were never designed to deliver: 100% inspection at line speed, per-head fill drift detection, automatic work order creation to the specific valve asset, real-time giveaway cost reporting, and mobile-native operator interfaces grounded in actual container data. The modernization conversation has three valid answers depending on line speed, container diversity, and regulatory exposure — augment in place (4–6 weeks), hybrid migration (6–8 weeks), or full modernization (8–12 weeks). All three keep existing fillers and line controls intact. All three deliver 2–3% giveaway reduction and sub-90-day payback within the first quarter. The decision worth making in 2026 isn't whether to adopt AI fill level monitoring — it's which of the three paths fits your specific filling operation. Book a Demo to walk through your specific filling lines and AI fill monitoring requirements.
Run the AI Fill Level Monitoring Workshop Built for Your Lines
iFactory AI's FMCG practice runs a 90-minute workshop against your real filling lines, container formats, and current QC workflows. You leave with a defended path recommendation, the keep/retire/transform/replace matrix applied to your lines, and a giveaway reduction projection grounded in your actual production data.
Does AI fill level monitoring replace our existing checkweighers?
No. Checkweighers provide gravimetric verification — measuring total weight per container — which is a complementary data stream to AI vision fill level measurement. AI vision measures actual fill height or volume independently of weight, catching within-tolerance giveaway that checkweighers cannot see. Checkweighers catch density-related anomalies that AI vision cannot measure. The two systems operate together: AI vision provides upstream fill quality control at 100% coverage with per-head localization, and checkweighers provide downstream weight compliance verification. iFactory integrates both data streams into a unified fill quality dashboard. Book a Demo to see the combined architecture.
How does AI vision handle foam, bubbles, and carbonated products?
Modern AI vision systems are trained specifically to detect the true liquid surface beneath foam and carbonation bubbles. Advanced lighting techniques such as strobed LED backlighting and infrared imaging cut through foam to measure actual fill height with ±0.5 mm accuracy even at high line speeds on carbonated beverages and aerated dairy products. The AI model uses the product meniscus position below the foam layer as the fill level reference — ignoring the foam surface entirely. For highly variable foam products, NIR imaging is often preferred because it responds to actual product density rather than surface appearance.
What fill deviation modes can AI actually detect — and which assets cause them?
AI vision detects four primary failure modes: (1) Valve wear — progressive fill level drift on a specific head as the valve seat degrades, detectable as a gradual trend over hours to days. (2) Actuator failure — step-change overfill or underfill when a pneumatic actuator loses seal integrity, causing delayed valve closure. (3) Sensor drift — float or pressure-based level sensors in product supply tanks reporting incorrect height to fill controllers, causing systematic overfill across all heads. (4) Temperature and viscosity effects — fill level shifts correlated with product temperature changes during line startup or CIP recovery. Each failure mode has a characteristic signature that the AI learns to recognize, with automatic work order creation to the specific asset — valve, actuator, sensor, or controller.
How does the system handle multiple SKU changeovers on the same filling line?
AI vision systems store fill specifications (target volume, tolerance band, container profile) for every SKU in a recipe database. During changeover, operators select the new product recipe and the system automatically adjusts its fill target, tolerance thresholds, and container detection parameters. The AI also monitors post-changeover fill stabilization, tracking how many containers fall outside specification during ramp-up and alerting operators to specific fill heads that are slow to settle. Over time, the system learns the typical stabilization profile for each product transition, enabling operators to predict and reduce post-changeover waste.
What regulatory compliance documentation does AI fill monitoring provide?
iFactory stores fill inspection records against the production line asset and the batch record simultaneously. When a regulatory inspection or BRC audit requires fill compliance records for a specific date range or product batch, the records are filterable by line, date, SKU, and batch number — exportable as a timestamped, digitally signed PDF that satisfies EU Regulation 76/211, NIST Handbook 133, UK Weights and Measures Act requirements, and BRC Global Standard for Food Safety Issue 9 documentation requirements. The audit trail includes inspection pass rates, deviation events, corrective actions taken, and maintenance work orders linked to each deviation event. Complete audit pack generation in under 5 minutes.