The quality manager at a biscuit plant reviews the quarterly capability report. Line 3's cream deposit weight has been running at Cpk 0.82 for 14 months — technically within the ±3.5g tolerance band but with a standard deviation of 1.4g that generates 8.2% product outside the internal specification window. That 8.2% is reworked at £0.18 per unit or rejected at £0.31 per unit. On 850,000 units per month, the cost of that uncontrolled process is £148,000 per year — invisible to every management report because no one had run a control chart. This is the gap between pass/fail inspection and true statistical process control.
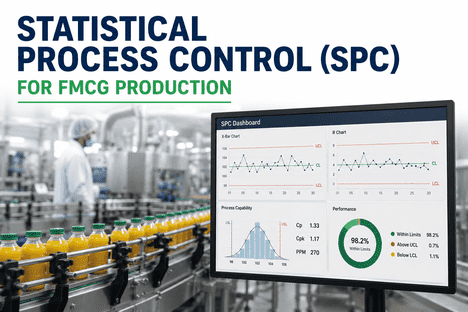
Statistical Process Control (SPC) for FMCG Production
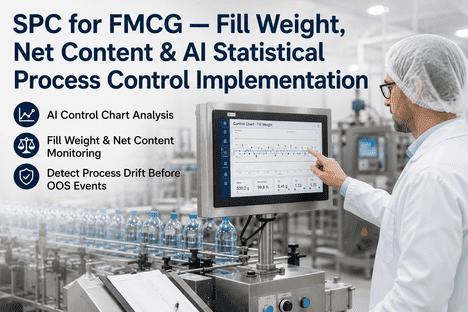
Control charts, process capability analysis, and AI-driven real-time monitoring turn production variation from a hidden cost into a managed, measurable, and improvable number — before it reaches the checkweigher, the retailer, or the regulator.
iFactory AI delivers a real-time SPC platform purpose-built for FMCG production that pulls data directly from PLCs, checkweighers, vision systems, and fillers — plotting live control charts, running all eight Western Electric rules automatically, calculating Cp/Cpk/Pp/Ppk continuously, and firing AI-powered alerts the moment a process starts drifting. The platform runs on an edge NVIDIA appliance on your plant network without cloud dependency. Every SPC event feeds maintenance work orders, quality holds, and compliance documentation in real time.
Complete SPC Coverage Across Every FMCG Process Parameter
SPC adds the most value where variation has direct financial consequences — product giveaway, regulatory non-compliance, or customer specification requirements. iFactory monitors every critical parameter simultaneously at line speed.
Fill Weight & Giveaway Control
Fill weight SPC monitors mean weight drift and variance expansion from each fill head. CUSUM charts detect as low as 0.8% low-drift from valve wear before it exits the tolerance band. Direct giveaway cost reduction of 1.5–2.4% on AI-monitored lines versus checkweigher-only control.
Depositor Head Weight Monitoring
Depositor head weight monitored per head with CUSUM charts that detect nozzle wear as gradual mean depression on individual heads while other heads remain in control. Root cause identifiable to the specific worn nozzle within one production run rather than requiring disruptive head-by-head investigation.
Continuous Cpk & Ppk Tracking
Cp, Cpk, Pp, Ppk, and DPMO calculated in real time and trended continuously rather than at scheduled capability studies. Rolling Cpk updates sample-by-sample so you see capability drift live — not after a monthly report. Alerts at configurable Cpk thresholds of 1.0, 1.33, or 1.67.
Live X-bar, R & Individual Charts
All primary control chart types — X-bar and R, X-bar and S, I-MR, p-chart, np-chart, c-chart, u-chart, CUSUM, and EWMA — plotted live from streaming production data. All eight Western Electric rules evaluated on every chart, every sample, with zero human latency.
AI-Enhanced Drift Detection
Traditional SPC detects out-of-control conditions after they appear in measurement data. AI-enhanced SPC adds virtual metrology prediction, cross-parameter correlation, and sub-sigma drift detection that catches problems 10–50x faster than Shewhart charts alone. Runs in parallel with traditional SPC for compliance.
BRC & FSSC 22000 Documentation
Every SPC record includes timestamped measurements, electronic signatures, documented out-of-control response actions, and signed capability studies. Cpk values, control chart images, and SPC-triggered corrective actions stored against the production asset record — providing the verified process control evidence required by BRC, FSSC 22000, and IFS auditors.
What an Uncontrolled Process Actually Costs Per Line
Pass/fail inspection tells you whether a unit meets spec. SPC tells you whether the process is capable of meeting spec — which is the only metric that scales. A process running at Cpk 0.9 generates 2,700 ppm defects mathematically, regardless of how hard the inspectors work.
Undetected Cpk Drift to Scrap
When Cpk drifts from 1.33 to 0.9, defect rate climbs from 64 ppm to 2,700 ppm. On a line running 1 million units per month, that is 2,636 additional defective units — most escaping inspection and reaching the customer or generating rework costs at £0.18–0.31 per unit.
Product Giveaway from Overfill
Without SPC monitoring, fill weights are set above the nominal target to avoid underweight risk. Each 0.5g of average overfill on a line running 500,000 units per day adds 250 kg of giveaway — at ingredient cost that compounds across every production day of the year.
Reactive Maintenance from Hidden Variation
When SPC detects nozzle wear, valve drift, or jaw degradation at the first control chart signal, maintenance is scheduled before the equipment fails. Without SPC, the same degradation continues until it causes a breakdown — costing 47 minutes of unplanned downtime per event.
Audit Non-Conformance Remediation
BRC Issue 9 and FSSC 22000 require documented evidence of process monitoring and capability for critical parameters. Missing or inadequate SPC documentation generates non-conformances requiring containment, root cause analysis, and corrective action — each costing 15–40 hours of quality team time.
From Data Connection to Live Control Charts in Two Weeks
iFactory connects to your existing production data sources — PLCs, checkweighers, vision systems, fillers, and CMMs — and begins plotting live control charts within days. No new sensors. No cloud uploads.
Connect Data Sources
iFactory connects to PLCs via OPC-UA, Modbus, and EtherNet/IP. Checkweigher and filler data streams in through standard industrial protocols. Vision system inspection results feed in via REST APIs. No additional hardware required.
Configure Control Charts
For each critical parameter, the correct chart type is auto-detected — X-bar and R for subgrouped continuous data, I-MR for individual measurements, p-chart for defect rates. Control limits are calculated from process history. Western Electric rules are enabled per parameter with configurable severity.
Deploy Dashboards
Operators see live control charts on the line. Quality managers see real-time Cpk values, control chart status, and open SPC-triggered work orders across all lines from one screen. Lines running below Cpk 1.0 are highlighted for immediate intervention.
Go Live & Iterate
Within 2 weeks of data connection, live SPC monitoring is operational. Control limits are refined as more data accumulates. AI models learn normal variation envelopes and begin detecting sub-sigma drifts. CMMS integration is configured to generate work orders from SPC signals.
Traditional SPC vs. AI-Enhanced SPC
Traditional SPC is essential for regulatory compliance and baseline monitoring. AI-enhanced SPC adds capabilities Shewhart's math was never designed to provide. Book a Demo to see both running on your data.
Traditional SPC
- Detects problems after they show up in metrology data
- Lag ranges from 2 hours (inline) to 48 hours (offline)
- Misses shifts under 0.5σ with reliable detection
- 8 Western Electric rules on historical points only
- Cpk calculated at scheduled capability studies
- No cross-parameter correlation
- Manual escalation — operator decides what to flag
AI-Enhanced SPC
- Catches problems 10–50x faster via virtual metrology prediction
- Detects sub-0.25σ drifts via EWMA + ML fusion
- WE rules + ML anomaly detection + cross-parameter correlation
- Rolling Cpk updated sample-by-sample in real time
- Auto-correlates machine, material, shift, operator variables
- Severity-ranked with ML prioritization by business impact
- 4-tier escalation — Info to Warning to Critical to Stop Ship
What FMCG Lines Achieve with iFactory SPC
These are documented outcomes from FMCG production lines running iFactory real-time SPC with AI-enhanced drift detection. Book a Demo to see the ROI model against your current defect rate and production volume.
Your process already produces the data. iFactory SPC turns it into live control charts, real-time Cpk, and AI-powered drift alerts. Book a 30-min walkthrough and we will run a live capability study on one critical parameter from your production data.
Questions from FMCG Quality and Production Teams
Stop managing process variation with end-of-shift reports.
See how real-time SPC with AI-enhanced drift detection catches process shifts 10–50x faster than traditional control charts — deployed on your existing FMCG production line in 6–12 weeks. Book a 30-minute walkthrough and we will run a live capability study on your data.