Statistical Process Control (SPC) in FMCG: Monitoring Production Quality in Real-Time

By Seren on June 10, 2026

statistical-process-control-spc-fmcg-production-quality-url.png_optimized_300

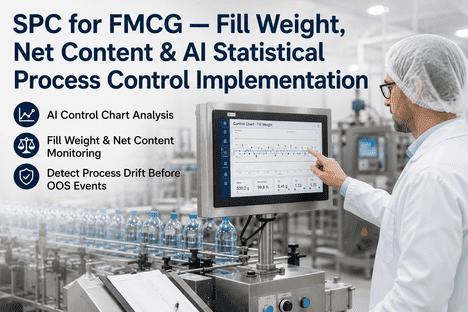
In FMCG production, quality drift does not announce itself with a sudden recall — it announces itself with a gradual 0.5–1.5% increase in fill-weight variation, a subtle shift in pH that creeps toward the specification limit over three shifts, or an incremental rise in viscosity that quietly pushes a batch closer to the upper control limit. Statistical Process Control (SPC) transforms these otherwise invisible signals into actionable intelligence, enabling quality teams to intervene at the moment of deviation rather than after 5,000 units of non-conforming product have reached the cold-store pallet. For plant managers who want to understand how real-time SPC protects FMCG brand reputation, Book a Demo with our quality analytics team to see live control charts and capability dashboards in action.

REAL-TIME PRODUCTION QUALITY
Is Undetected Process Drift Eroding Your FMCG Profit Margins?
iFactory's SPC integration delivers real-time control charts, Cpk analysis, and AI-driven quality dashboards that detect drift before defects occur — reducing scrap, rework, and compliance risk across your FMCG production lines.
3–5% Average reduction in overall yield from undetected process drift over a 6-month production cycle
$2.8M Annual cost of scrap, rework, and compliance penalties in a mid-size FMCG plant without SPC monitoring
62% Reduction in defect rate after implementing real-time SPC with automated out-of-control alerting
8–12x ROI from SPC deployment when paired with automated quality analytics and closed-loop corrective actions

The SPC Challenge in High-Speed FMCG Production

Why Conventional Quality Sampling Falls Short at Modern Line Speeds

FMCG production lines today operate at speeds that outpace traditional quality sampling by an order of magnitude. A snack-food line producing 400 bags per minute generates 240,000 units in a single 10-hour shift. At conventional sampling rates of one bag every 30 minutes, the quality team inspects just 0.008% of production. The gap between samples represents 12,000 unmeasured units — any of which could contain a process deviation that compromises fill weight, seal integrity, or product composition. Statistical Process Control closes this gap by monitoring process parameters continuously rather than relying solely on discrete product inspection. When temperature, pressure, flow rate, or line speed deviates from the control limits established during capability studies, SPC triggers an alert before the first non-conforming unit reaches the end of the line.

5 Root Causes of Quality Variation in FMCG Production

Diagnosing the Hidden Sources of Process Instability

01
Raw Material Inconsistency Across Batches
FMCG formulations depend on raw material properties that vary naturally between harvests, suppliers, and storage conditions. Flour protein content, sugar granulation, oil viscosity, and spice potency all shift within acceptable supplier specifications, but combined variation can push finished-product parameters beyond control limits. iFactory's SPC integration correlates incoming raw material test data with in-process measurements to identify upstream variation before it propagates through the production line.
02
Equipment Wear and Calibration Drift
Filler nozzles, forming mandrels, sealing jaws, and check-weigher cells undergo gradual wear that shifts process centering over time. A 50-micron wear on a volumetric filler piston causes a consistent 0.3–0.5 gram underfill that accumulates to thousands of dollars in hidden giveaway per month. SPC control charts detect this drift 3–5 days before conventional check-weighing triggers an alarm, giving maintenance teams time to plan corrective intervention. Book a Demo to see how iFactory's SPC module tracks filler performance trends in real time.
03
Environmental Condition Fluctuations
Temperature and humidity variation across production shifts affects product viscosity, drying rates, and packaging material properties. SPC monitoring that includes environmental parameters as control variables enables quality teams to distinguish between special-cause variation requiring immediate intervention and common-cause variation driven by ambient conditions that can be addressed through facility-level adjustments or recipe compensation.
04
Changeover and Start-up Transients
Product changeovers, line startups after scheduled maintenance, and shift transitions introduce transient process behavior that generates disproportionate quality risk. SPC monitoring with phase-specific control limits distinguishes between acceptable transient variation and abnormal deviation during each production phase, reducing the volume of product quarantined for evaluation after every changeover.Book a Demo
05
Human Variability in Manual Process Steps
Manual blending, ingredient addition, and visual inspection steps introduce operator-dependent variation that control charts can detect and quantify. When operator A's average fill weight is 2 grams higher than operator B's across identical production runs, the SPC system flags the between-operator variation as an opportunity for standardized work instruction and targeted training — reducing both giveaway and underfill risk simultaneously.

Economic Impact of Unmonitored Quality Variation in FMCG

The Annualized Cost of Hidden Process Instability

When SPC is not deployed, quality variation accumulates as hidden waste that erodes margin across every production run. Overfill giveaway, underfill rework, quarantine and testing labor, material scrap, and the brand-cost of a consumer complaint each represent a separate leak in the profitability of every unit produced. The table below documents the annualized cost impact of common FMCG quality failure modes for a mid-size production facility operating 16 hours per day across two lines.

Quality Failure Mode Primary Impact Revenue & Operations Risk Annualized Cost Range
Fill Weight Drift 0.5–1.5% systematic overfill Hidden giveaway erodes margin on every unit $180K – $420K
Seal Integrity Variation Leaker rate > 0.8% Consumer complaints, retailer chargebacks, brand damage $250K – $650K
Composition / Recipe Deviation Batch non-conformance Regulatory non-compliance, product quarantine, rework $120K – $380K
Changeover Waste 15–25 min excess purge time Lost OEE, material waste per changeover $80K – $200K
Environmental Excursion Temperature/humidity out of range Texture, appearance, shelf-life failures $60K – $150K

Expert Review: What Quality Engineers Look For in FMCG SPC Deployments

"Over 18 years of quality engineering in FMCG across confectionery, dairy, and beverage categories, I have evaluated SPC implementations at more than 40 production facilities across North America, Europe, and Southeast Asia. The single pattern that separates plants with best-in-class quality performance from those with chronic margin-eroding variation is not the sophistication of their statistical methods or the cost of their instrumentation — it is whether they have closed the loop between control chart signals and corrective action execution. Plants that achieve Cpk values above 1.67 and sustain them are the ones where every out-of-control signal generates an automatically assigned work order, every corrective action is documented with before-and-after data, and every improvement is validated through updated control limits. Plants that treat SPC as a monitoring exercise rather than a closed-loop quality management system rarely sustain Cpk above 1.33. Book a Demo"
Senior Director of Quality Systems — Global FMCG Operations 18+ Years in Confectionery, Dairy & Beverage Manufacturing

The 5-Step Framework for SPC Deployment in FMCG

From Manual Sampling to Real-Time Closed-Loop Quality Control

Deploying effective SPC in an FMCG environment follows a structured progression that builds measurement integrity, establishes process baselines, and enables automated intervention before quality variation reaches economic thresholds. Each step targets a specific capability gap and delivers measurable improvement within a single operating quarter.

Step 01
Conduct Measurement System Analysis (MSA)
Before any control limit can be trusted, the measurement system itself must be validated. Deploy Gage R&R studies on all check-weighers, in-line pH meters, viscometers, and temperature sensors. Ensure measurement variation represents less than 10% of total process variation. Without this foundation, SPC signals will include false positives driven by instrument noise rather than true process shifts.
Step 02
Establish Baseline Capability and Control Limits
Collect 25–30 subgroups of data under stable operating conditions. Calculate preliminary control limits and process capability indices (Cp, Cpk). Document the baseline Cpk for each critical-to-quality parameter. Parameters with Cpk below 1.33 require process improvement before control limits can be used for ongoing monitoring.
Step 03
Configure Real-Time Data Acquisition and Control Charts
Connect in-line sensors, check-weighers, and lab test results to the SPC platform. Configure X-bar and R charts for variable data (fill weight, viscosity, pH) and P charts or U charts for attribute data (leaker count, appearance defects). Set sampling frequency to detect a 1.5-sigma shift within two hours of occurrence.
Step 04
Automate Out-of-Control Alerting and Work Order Generation
Deploy multi-tier alert thresholds: a warning when data approaches the upper or lower control limit, an alarm when a point falls outside control limits, and a critical alert when a run of seven points appears on one side of the centerline. Connect each alarm tier to specific actions in the CMMS — a warning generates a notification, an alarm generates an inspection work order, a critical alert triggers an immediate line stoppage review.
Step 05
Close the Loop with Capability Improvement Cycles
Review control chart data weekly to identify chronic variation patterns. For each pattern, initiate a root cause analysis and assign corrective actions with owners and deadlines. When corrective actions are verified effective, recalculate control limits and capability indices. Every cycle of detection, correction, and validation drives Cpk higher and variation lower.

Continuous Monitoring Architecture for FMCG SPC

The Four Pillars of Real-Time Quality Intelligence

Real-Time Data Acquisition
Wireless sensors and PLC-connected instruments stream fill weight, temperature, pressure, viscosity, pH, and line speed data directly to the SPC platform at intervals as frequent as every 10 seconds. Data is automatically synchronized with batch IDs, shift records, and raw material lot numbers for complete traceability.
Multi-Chart Control Dashboard
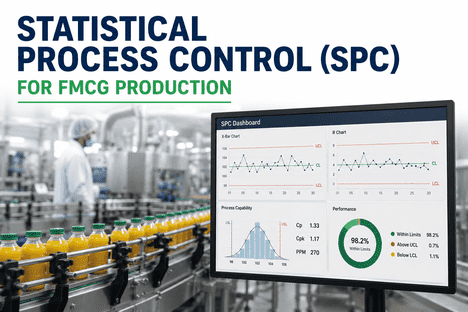
Operators and quality engineers view live X-bar, R, P, and U charts organized by line, product SKU, and CTQ parameter. Control limits are automatically recalculated when process improvements are validated. Color-coded status indicators show at a glance whether each process stream is in statistical control.
Automated Capability Analysis
Cp, Cpk, Pp, and Ppk are calculated automatically for every parameter and updated with each new data point. Trend charts show capability improvement over time, enabling quality managers to demonstrate the ROI of SPC deployment to plant leadership with data-driven evidence.
Closed-Loop Corrective Action Engine
Each out-of-control signal triggers an automated workflow that assigns a corrective action, notifies the responsible team member, tracks the investigation and resolution, and verifies effectiveness through control limit re-evaluation. Every quality event is documented with complete traceability for internal audits and regulatory inspections.

Conclusion: From Reactive Inspection to Real-Time Statistical Control

Protecting Your FMCG Brand with Data-Driven Quality Intelligence

Statistical Process Control transforms quality management from a backward-looking inspection activity into a forward-looking prevention system. In an FMCG environment where line speeds, margin pressure, and regulatory scrutiny continue to increase, SPC provides the only scalable method for detecting process drift at the moment it begins — before it becomes a defect, before it reaches a consumer, and before it erodes brand trust.

Book a Demo with iFactory's quality analytics team to build an SPC deployment plan for your FMCG production lines and see how real-time control charts, automated capability analysis, and closed-loop corrective action workflows protect your product quality and profit margin.

Frequently Asked Questions

What is the difference between SPC and traditional quality inspection?

Traditional quality inspection is a detection-based system: product is manufactured, sampled at the end of the line, and either passed or failed based on measured characteristics. Defective product that is detected has already been produced, and the cost of scrap, rework, or disposal has already been incurred. SPC is a prevention-based system: process parameters are monitored continuously during production, and statistical signals of process drift trigger intervention before any non-conforming product is made. Where inspection answers the question "Is this product good or bad?" SPC answers the question "Is this process stable and capable of producing good product?" — and it answers that question in time to prevent defects from occurring.

Which control chart types are most commonly used in FMCG production?

The most commonly used control charts in FMCG production are X-bar and R charts for variable data (fill weight, viscosity, pH, temperature, pressure) and P charts for attribute data (proportion of defective units, leaker rate, appearance defects). X-bar and R charts are typically deployed in pairs — the X-bar chart monitors the process center (average), and the R chart monitors the process spread (range), providing complete visibility into both location and dispersion of the process. For high-volume production with frequent sampling, individual and moving range (I-MR) charts are also common.

What Cpk value should FMCG manufacturers target?

The target Cpk depends on the criticality of the parameter and the nature of the process. For safety-related parameters (seal integrity, cook temperature, allergen cross-contact), a minimum Cpk of 1.67 is recommended, which corresponds to approximately 0.6 defects per million opportunities. For general quality parameters (fill weight, appearance, texture), a Cpk of 1.33 is a reasonable minimum target, corresponding to approximately 63 defects per million. World-class FMCG operations target Cpk values of 2.0 or higher for all critical parameters, achieving defect rates below 1 part per billion and maximizing margin by operating exactly at the specification target with minimal variation.

How does iFactory integrate SPC with existing FMCG line sensors and PLCs?

iFactory's SPC module includes native protocol adapters for Modbus TCP, OPC-UA, MQTT, and Siemens S7, as well as REST API connectivity for cloud-connected instruments. Most FMCG facilities already have check-weighers, metal detectors, temperature recorders, and flow meters equipped with digital outputs that can stream data directly into the SPC platform. For older instruments without digital connectivity, iFactory's deployment team provides retrofit data acquisition modules that capture analog outputs and convert them to digital signals. The entire data pipeline — from sensor signal to control chart to corrective action work order — is configured without custom programming, enabling deployment in as little as two weeks per production line.

Can SPC help with regulatory compliance in food and beverage manufacturing?

Yes. Regulatory frameworks including FSMA, SQF, BRCGS, and ISO 22000 all require documented evidence of process control and corrective action effectiveness. iFactory's SPC module provides automated documentation of every control chart, out-of-control signal, investigation, and corrective action with timestamps and user attribution. During a regulatory audit, quality managers can generate a complete process control history for any SKU, production date, or parameter within seconds — demonstrating to auditors that the facility operates a prevention-based quality system with objective statistical evidence of control.
DEPLOY SPC ON YOUR FMCG LINES
Get a Real-Time SPC Assessment for Your Production Facility
Our quality analytics team will evaluate your current inspection and data collection systems, establish baseline process capability, and deliver a structured deployment plan for real-time SPC that protects your brand quality, reduces waste, and improves OEE.

Share This Story, Choose Your Platform!