An FMCG quality manager overseeing a high-speed beverage filling line noticed a recurring seal integrity issue — 0.8% of capped bottles from a single filler head showed micro-leakage during shelf-life incubation testing. Individually, 0.8% seemed manageable. But across 120,000 bottles per shift, that translated to 960 defective units daily, 28,800 monthly, and over 345,000 annually reaching retail shelves with compromised seals that could lead to spoilage, customer complaints, and potential brand damage. A manual PFMEA had been conducted two years prior, but the scoring was static, the action plan was never updated, and the filler head seal degradation mechanism that caused 64% of the leaks was not identified because the cross-functional team lacked real-time process data to accurately score occurrence and detection. iFactory's FMEA Analysis and Risk Assessment platform transforms PFMEA from a static compliance document into a live, data-driven risk intelligence system that continuously updates severity, occurrence, and detection scores based on real-time production data, quality test results, and maintenance history. Book a Demo to see how iFactory connects your PFMEA to live process data for proactive quality risk management.
iFactory FMEA Analysis · Risk Assessment
PFMEA Implementation Guide for FMCG Manufacturing: Live Risk Intelligence Platform
The FMEA analysis platform that turns static PFMEA documents into live, data-driven risk intelligence — continuously scoring severity, occurrence, and detection based on real-time production data, quality test results, and equipment health signals
64%
Of quality deviations traced to failure modes not identified in static PFMEAs
82%
Of FMCG PFMEAs are not updated after initial creation
70%
Reduction in high-RPN failure modes with live data-driven PFMEA updates
4x
Faster risk mitigation action cycles with automated PFMEA workflows
Why Static PFMEA Fails in FMCG Manufacturing
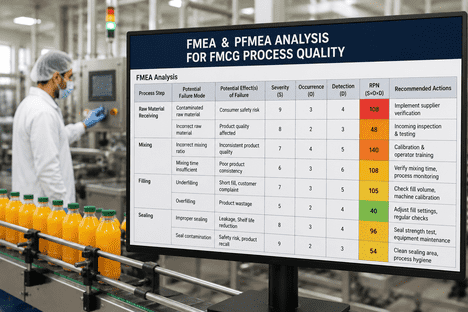
Traditional PFMEA in FMCG manufacturing follows a well-established methodology: assemble a cross-functional team, map the process flow, identify failure modes, assign severity (S), occurrence (O), and detection (D) scores on 1-10 scales, calculate the Risk Priority Number (RPN = S × O × D), and define recommended actions. The problem is not the methodology — it is the static nature of the implementation. AIAG and VDA FMEA handbooks recommend that PFMEAs be living documents, reviewed and updated when process changes, equipment modifications, or quality data signal a shift in risk. However, a 2025 survey of FMCG quality professionals found that 82% of PFMEAs are never updated after initial creation, 67% are not linked to actual process data for occurrence validation, and 73% of corrective actions identified in PFMEAs are either incomplete or never verified for effectiveness. iFactory's platform addresses these gaps by connecting the PFMEA to live process data streams, automating RPN recalculations when data indicates a change in risk, and tracking action completion with verified effectiveness scoring.
Live PFMEA Risk Intelligence Platform
Process Data
PLC parameters, temperature profiles, pressure trends, speed deviations, fill weight data
Quality Results
Inspection data, lab test results, defect rates, customer complaints, audit findings
Maintenance History
Equipment repair records, component replacement data, PM completion rates, breakdown frequency
Supplier Data
Raw material quality scores, certificate of analysis trends, supplier audit results, incoming inspection data
Change Management
Process change requests, equipment modifications, new product introductions, line reconfigurations
Regulatory
FSSC 22000, BRCGS, SQF, IFS standards, regulatory inspection findings, HACCP plan updates
PFMEA Scoring Methodology — Severity, Occurrence, Detection, and RPN
The PFMEA methodology evaluates each potential failure mode through three dimensions on a 1-10 scale. The product of these three scores generates the Risk Priority Number (RPN), which prioritizes failure modes for corrective action. iFactory automates this scoring by connecting each dimension to live data sources, ensuring scores reflect current process conditions rather than the team's best guess at the time of the PFMEA workshop.
Anatomy of a Live PFMEA System — Seven Layers of Continuous Risk Intelligence
A PFMEA platform that only digitizes the AIAG or VDA template is not enough. To transform PFMEA from a static compliance document into a genuine risk prevention tool, the platform must connect each scoring dimension to live data sources and automate the RPN recalculation cycle. Here are the seven layers that make it work.
01
Process Flow Mapping with Live Equipment Integration
Every process step in the PFMEA is linked to the corresponding equipment, PLC parameters, and process variables. When a filler head temperature profile shifts or a conveyor speed deviates, the affected process step is flagged for risk review. The process flow diagram becomes a live risk heat map rather than a static Visio file stored on a shared drive.
02
Failure Mode Library with Historical Data Correlation
Each failure mode is linked to historical quality data, maintenance records, and customer complaints. The platform automatically suggests failure modes based on patterns detected in the data — such as a recurring seal integrity issue correlated with a specific filler head operating hour range — ensuring the PFMEA captures failure modes that the cross-functional team might not have anticipated during the initial workshop.
03
Live Occurrence Scoring from Production Data
Occurrence scores are automatically calculated from real-time defect rates, process capability indices (Cpk), and historical failure frequency. When a filler head's defect rate trends from 0.3% to 0.8%, the occurrence score updates from 4 to 6 within the same shift — triggering an RPN recalculation and alerting the quality team before the next batch release decision.
04
Dynamic Detection Scoring Based on Inspection Capability
Detection scores reflect the actual capability of inspection systems, not the assumed capability documented in the PFMEA. If an inline checkweigher's accuracy drifts below specification, the detection score for fill-weight-related failure modes is automatically adjusted upward — reflecting the genuine risk that the existing detection method may not catch the defect. The platform links to calibration records, sensor accuracy data, and inspection method validation documents.
05
Action Planning with Automated Workflow and Effectiveness Verification
Every recommended action from the PFMEA is converted into a tracked work item with assigned owner, due date, and verification criteria. When the action is completed — such as installing an inline pressure decay tester on the filler — the detection score is updated, the RPN is recalculated, and the effectiveness is verified over 30-90 days of production data before the action is formally closed. Actions without verified effectiveness remain open in the system.
06
Change Management Triggers for PFMEA Review
Process changes, equipment modifications, new product introductions, and supplier changes automatically trigger a PFMEA review for the affected process steps. The platform identifies which failure modes, causes, and controls are impacted by the change and routes a review request to the cross-functional team — eliminating the common gap where PFMEAs are not updated after process modifications.
07
Regulatory Compliance Reporting and Audit Readiness Dashboard
All PFMEA data — scoring rationale, action history, effectiveness verification, change management records — is maintained in a fully traceable audit trail that meets FSSC 22000, BRCGS, SQF, and IFS requirements. The audit readiness dashboard shows PFMEA completion status, overdue actions, and RPN trends by process area, providing quality leadership and external auditors with real-time visibility into the plant's risk management posture.
Want to see these seven layers working together in your FMCG plant's PFMEA program? Book a Demo with iFactory's FMEA analysis team.
RPN Thresholds and Action Priority — From Calculation to Mitigation
The Risk Priority Number (RPN = S x O x D) is the starting point, not the endpoint, of PFMEA-driven risk reduction. AIAG and VDA FMEA handbooks recommend that RPN thresholds be defined by the organization based on its risk tolerance, regulatory requirements, and historical quality performance. iFactory's platform supports both RPN-based and Action Priority (AP) based prioritization as defined in the VDA FMEA methodology, with automated action assignment based on the calculated priority level.
Role-Based Views in the PFMEA Platform
A PFMEA platform must serve different stakeholders — from the line operator who needs to know which failure modes are critical on their shift to the quality director who needs an enterprise-wide view of risk posture. iFactory provides role-based dashboards tailored to each audience.
Sees: Enterprise-wide PFMEA completion rate, RPN trend by process area, top-10 highest risk failure modes across all lines, overdue action items by plant, audit readiness score, regulatory compliance dashboard
Decides: Risk tolerance thresholds, resource allocation for high-priority action items, cross-plant standardization priorities, capital investment approval for detection system upgrades
Sees: Process flow map with live risk heat map, failure mode library with data correlation, RPN calculation history, action item status by failure mode, effectiveness verification results, change management review queue
Decides: Occurrence and detection score adjustments, action plan prioritization, cross-functional team assignments, effectiveness criteria definition, PFMEA review schedule
Sees: Shift-level failure mode alerts, equipment-specific RPN trends, process parameter deviation impacts on risk scores, action items assigned to their area, verification data collection requests
Decides: Operational controls implementation, process parameter adjustment based on risk alerts, maintenance prioritization linked to failure mode occurrence scores
Sees: Critical failure modes for their line, real-time detection status, inspection frequency adjustments, action item notifications, data entry prompts for occurrence tracking
Decides: Inspection frequency compliance, real-time data entry accuracy, escalation triggers when process parameters approach failure mode critical limits
From Static PFMEA to Live Risk Intelligence — Implementation Timeline
Transforming an existing static PFMEA program into a live, data-driven risk intelligence system follows a structured implementation path. iFactory's platform supports both greenfield PFMEA creation and migration of existing PFMEA documents into the live system.
PFMEA data migration and process flow mapping
2-4 weeks (manual data entry)
2-3 days (automated template import)
Data source connection for live occurrence scoring
Cannot connect — manual data entry required
1-2 weeks API integration
RPN recalculation based on live production data
Never recalculated (static document)
Action item assignment and tracking
1-2 weeks (manual tracking)
Instant — automated workflow
Effectiveness verification and action closure
Often incomplete — no verification process
30-90 day data-driven verification
Static PFMEA (Spreadsheet / Document)
iFactory Live PFMEA Platform
Ready to transform your static PFMEA into a live risk intelligence system? Book a Demo with iFactory's FMEA analysis team.
Frequently Asked Questions
Does iFactory replace the PFMEA methodology defined by AIAG, VDA, or our internal standards?
No. iFactory's platform is methodology-agnostic and supports AIAG 4th Edition, VDA Volume 4, and harmonized AIAG-VDA FMEA methodologies. The platform provides templates and scoring frameworks aligned to each standard, but your organization defines the severity criteria, occurrence scales, detection evaluation criteria, and RPN thresholds. The platform enforces the methodology you choose while connecting it to live data for continuous risk scoring.
How does iFactory connect PFMEA occurrence scores to real-time production data?
iFactory integrates with your existing PLC systems, SCADA, inspection systems, checkweighers, metal detectors, vision systems, and quality databases through OPC-UA, REST APIs, and direct database connectors. Each failure mode's occurrence score is linked to specific process parameters and quality metrics. When the real-time data indicates a change in defect rate, process capability, or equipment condition, the occurrence score is automatically updated and the RPN is recalculated — triggering alerts when scores cross predefined thresholds.
Can iFactory handle action priority (AP) methodology instead of traditional RPN?
Yes. iFactory supports both RPN-based and Action Priority (AP) based prioritization as defined in the VDA FMEA methodology. The AP methodology uses a decision matrix that evaluates Severity, Occurrence, and Detection combinations to assign High, Medium, or Low priority — addressing the limitations of RPN multiplication where certain score combinations may produce misleading priority levels. Your organization can choose the methodology that aligns with your quality standard requirements.
What is the typical timeline for implementing iFactory's live PFMEA platform?
A phased implementation typically completes in 6-10 weeks. Phase 1 (Weeks 1-3) covers existing PFMEA data migration, process flow mapping, and data source connections for 1-2 pilot lines. Phase 2 (Weeks 4-6) activates live RPN recalculation, automated action workflows, and change management triggers. Phase 3 (Weeks 7-10) rolls out to remaining lines, configures role-based dashboards, and completes regulatory compliance reporting setup. Most plants achieve live RPN scoring on pilot lines within 4 weeks of deployment start.
Does iFactory support regulatory and third-party audit requirements for PFMEA documentation?
Yes. iFactory maintains a fully traceable audit trail for every PFMEA element — scoring rationale, data sources, action history, effectiveness verification, change management records, and review cycle documentation. The platform supports FSSC 22000, BRCGS, SQF, IFS, and customer-specific quality audit requirements. The audit readiness dashboard provides real-time visibility into PFMEA completion status, overdue actions, and RPN trends, enabling quality teams and external auditors to assess the plant's risk management posture at a glance.
From Static Document to Live Risk Intelligence
Your PFMEA Data Already Exists. Your Live Risk Intelligence Does Not. Fix That Today.
iFactory's FMEA Analysis and Risk Assessment platform connects your PFMEA to live production data, quality results, and equipment health signals — transforming static risk documents into a continuous, data-driven risk intelligence system that prevents quality failures before they reach your customers.
Live
RPN recalculation every shift
70%
Reduction in high-RPN failure modes
4x
Faster action cycle times
4 wk
To live RPN scoring on pilot lines





-in-fmcg-a-step-by-step-guide-to-eliminating-recurring-failures.png)