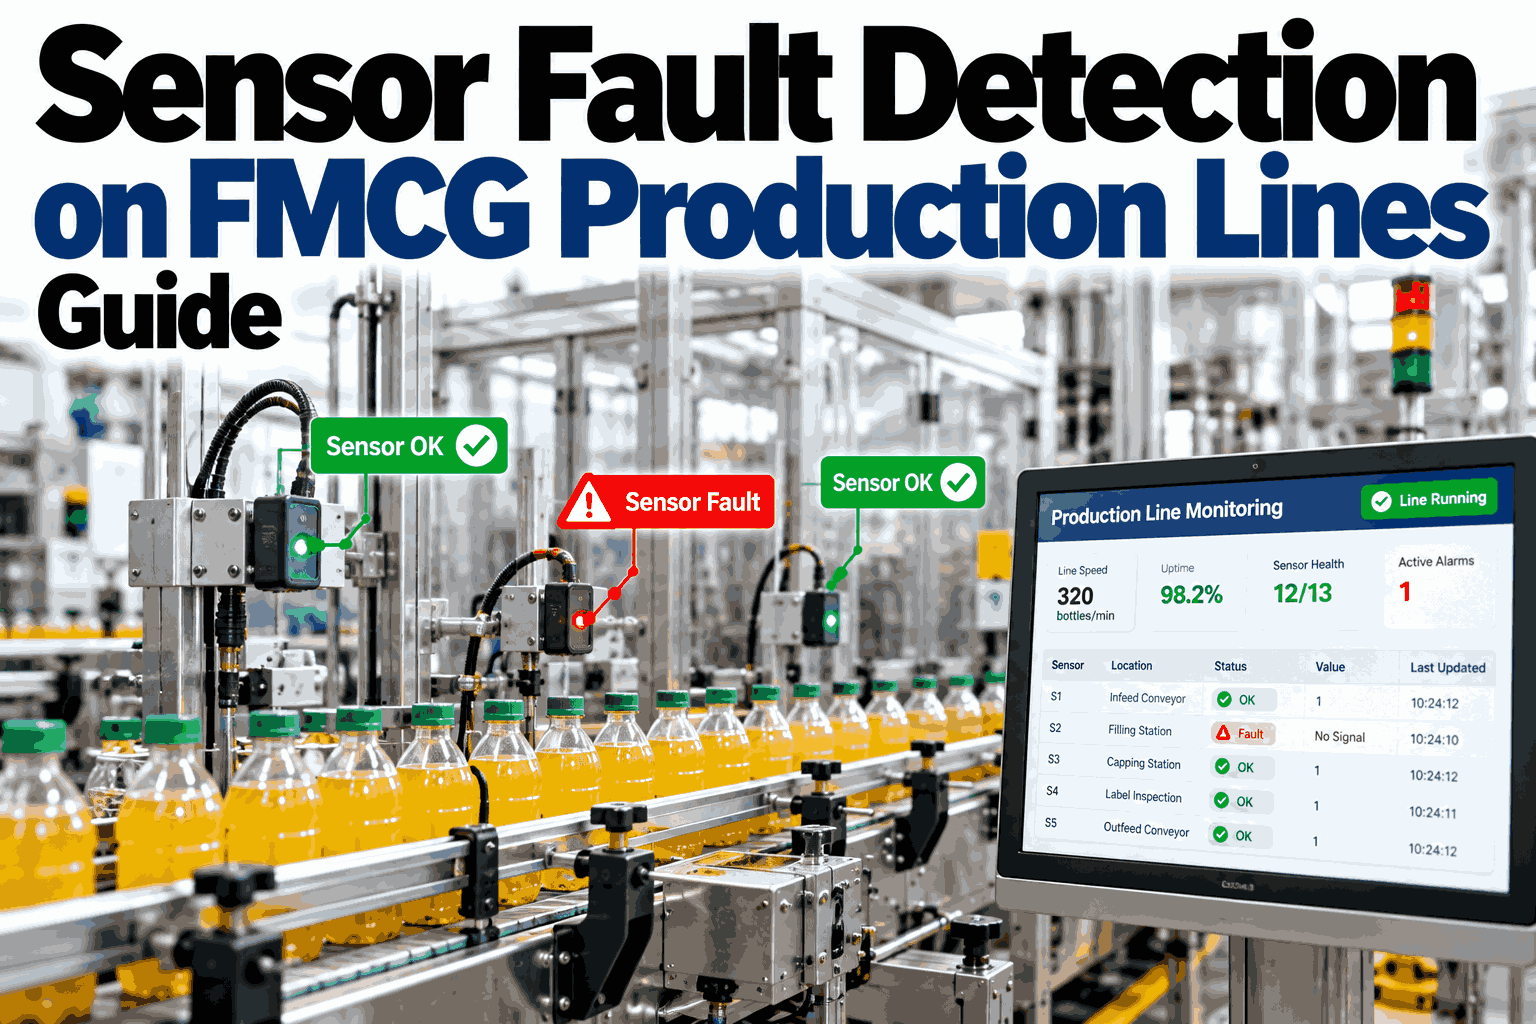
A line that stops for no obvious reason twenty or thirty times a shift rarely has twenty or thirty different mechanical problems behind it. More often, one sensor has gone slightly wrong in a way that looks random from the control room but follows a repeatable pattern once you know what to look for. Telling a dead sensor apart from a drifting one, and both from an intermittent fault, is usually the fastest way to stop chasing phantom stops, and you can walk through your own line's stop pattern with our team to see which one you are dealing with.
FMCG line diagnostics
Stop Chasing Random Line Stops That Are Actually a Failing Sensor
Learn to recognize dead sensor, drift, and intermittent fault patterns on your own FMCG line before they get logged as unexplained micro-stops all shift long.
What an intermittent sensor fault looks like on a trace
The real cause
Why Random Stops Are Usually a Sensor Problem, Not a Mechanical One
A mechanical fault tends to repeat the same way every time. A sensor fault produces readings that look inconsistent, which is exactly why it gets logged as random instead of being traced back to one root cause.
1
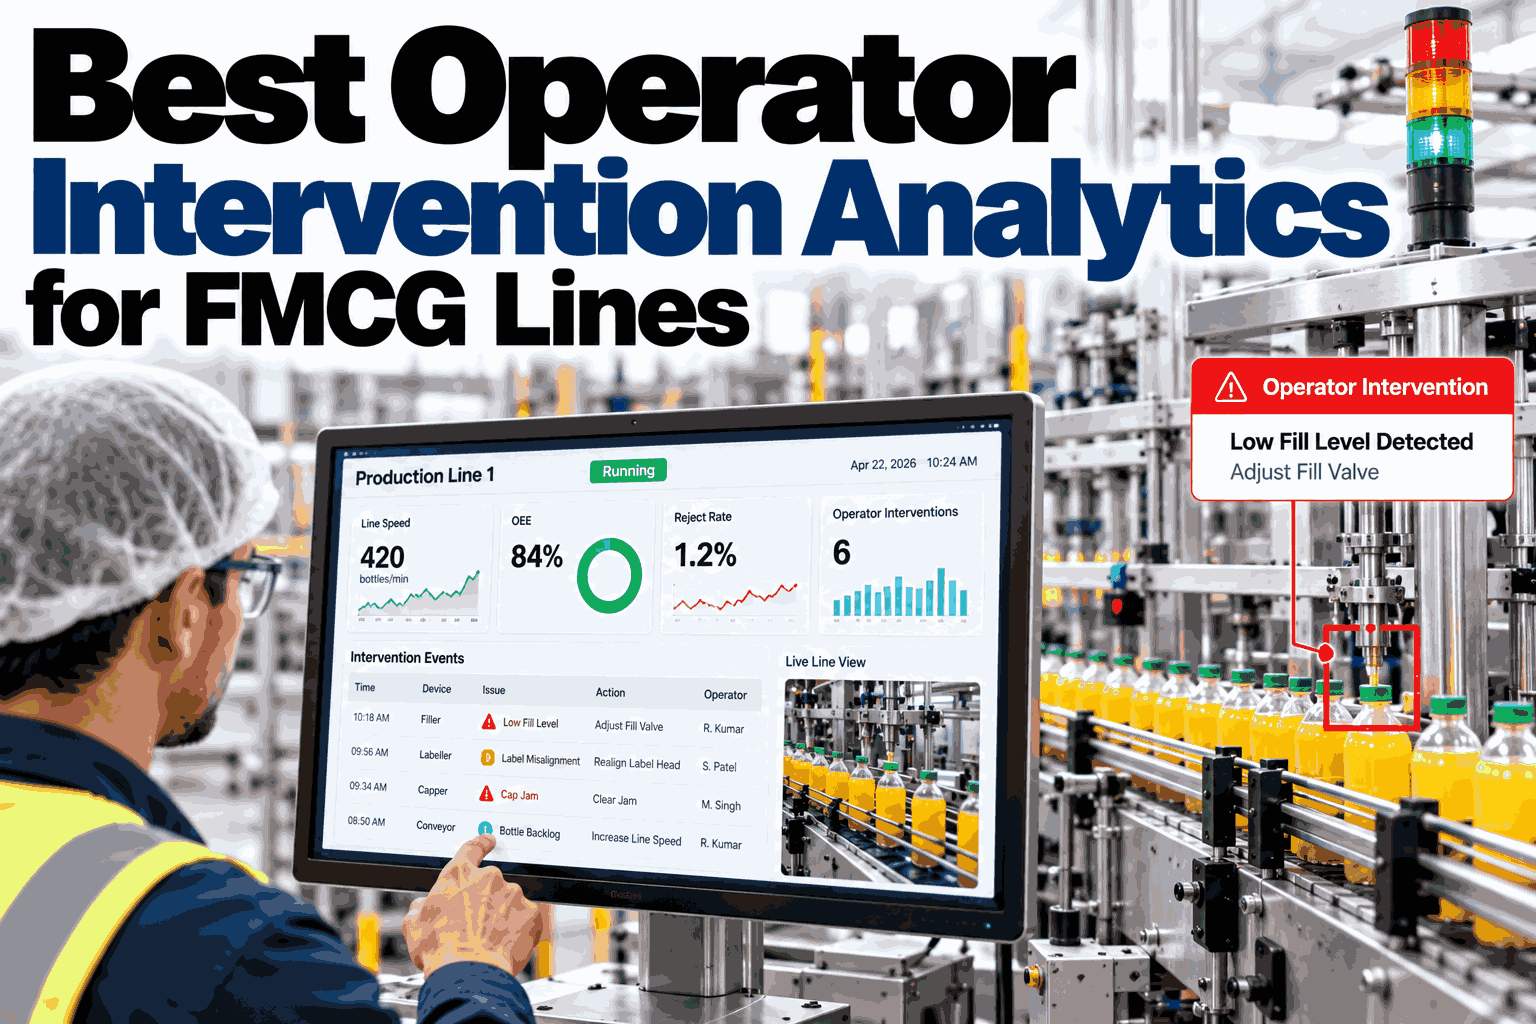
Operators react to the stop, not the cause. A false jam signal gets cleared and production restarts, with no record of why the sensor fired.
2
Each stop gets logged separately. Without pattern analysis, thirty stops from one failing sensor look like thirty unrelated events.
3
Sensors degrade gradually. A slowly drifting reading does not look broken on any single check, only across a trend line over days.
4
Maintenance tickets describe symptoms, not patterns. A ticket says the line stopped again, not that the same sensor has misfired nine times this week.
Three fault patterns
Three Sensor Fault Patterns and How Each One Reads on a Trace
Most FMCG line sensor problems fall into one of three patterns, and each one has a distinct shape once you plot its readings over a shift.
Dead sensor
A flat, unchanging reading regardless of what is actually happening on the line, often misread as a stable, normal signal until output stops matching it.
Drifting sensor
A slow, steady decline or climb in readings over days or weeks, easy to miss shift to shift but obvious once plotted across a longer trend.
Intermittent sensor
A sharp, erratic spike pattern with no fixed timing, the hardest of the three to spot without pattern analysis across many stops.
Matching symptom to cause
What Your Line Symptom Is Probably Telling You
The symptom an operator sees on the floor is usually a strong clue to which of the three fault patterns is actually behind it.
| Line symptom | Likely fault type | Typical root cause |
| Same stop code, dozens of times a shift |
Intermittent |
Loose connector or vibration-sensitive mounting |
| Defect rate creeping up over several weeks |
Drift |
Sensor calibration shifting gradually out of range |
| Line reports normal readings, output disagrees |
Dead |
Sensor stuck on last valid reading or lost signal |
| Stops cluster around specific times of day |
Intermittent |
Temperature or humidity sensitivity at that time window |
| Quality rejects rise without a stop being logged |
Drift |
Threshold no longer matches true sensor behavior |
Once a symptom is matched to a likely fault type, the next step is confirming it against the sensor's actual trace rather than replacing a part on a guess.
Get Your Own Line's Stop Pattern Reviewed
Share your recent micro-stop data and we will help you identify which sensor pattern is driving your random stops.
How detection works
How Micro-Stop Analytics Finds the Pattern Behind the Noise
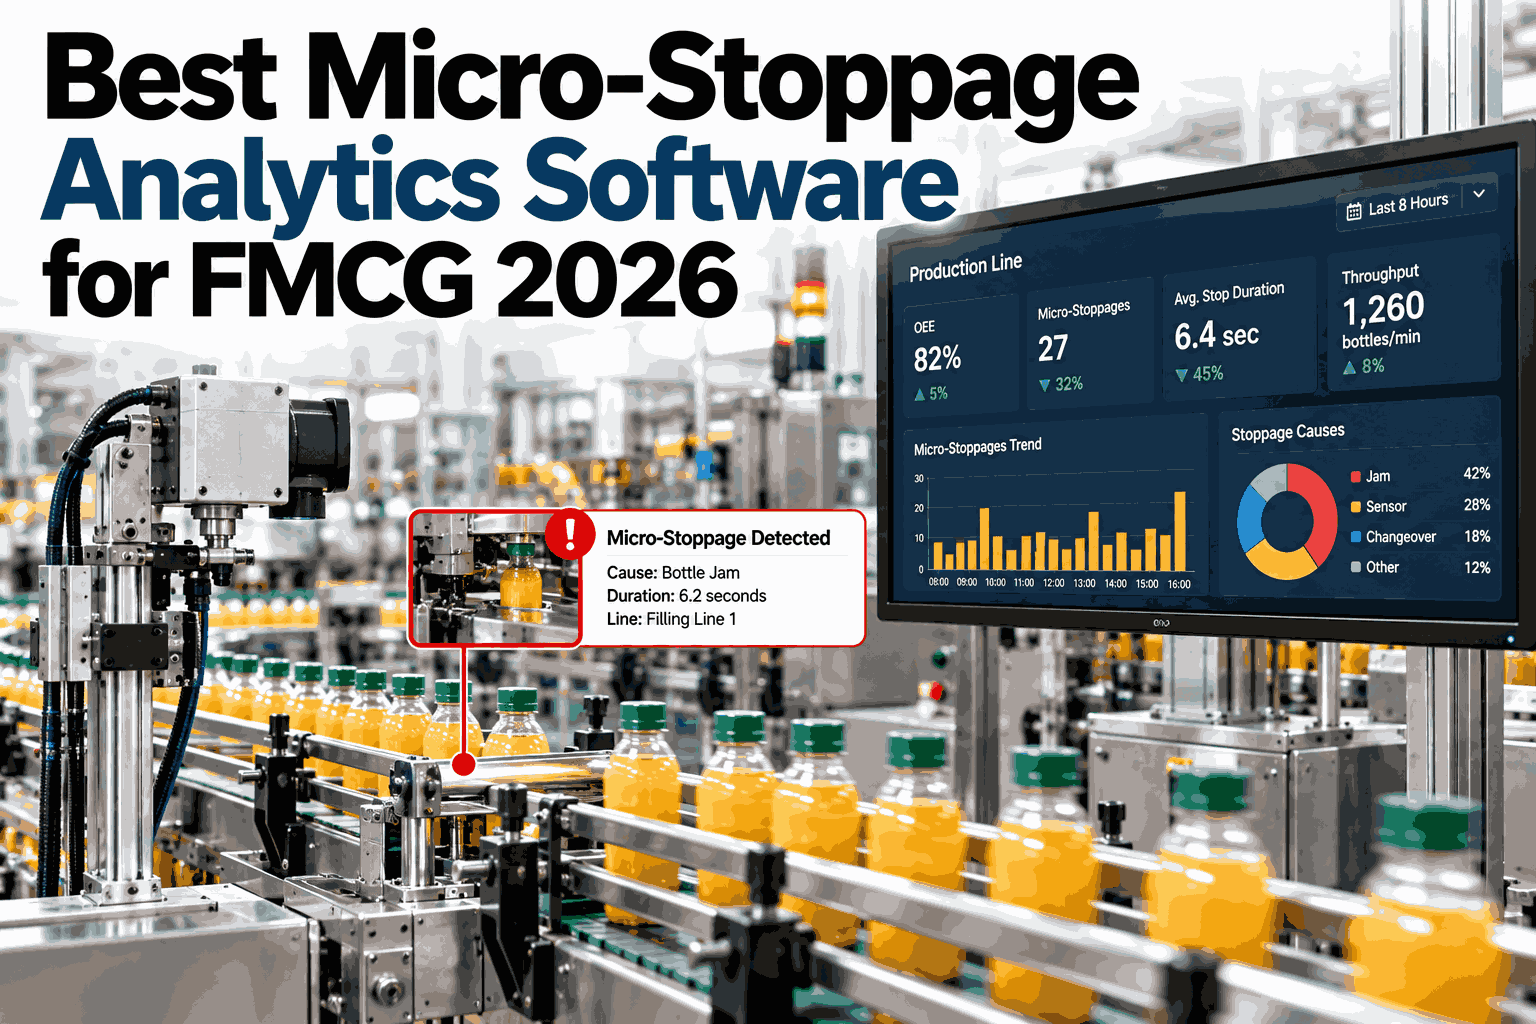
Catching these three patterns by eye across hundreds of daily stops is not realistic for a floor team. Pattern analytics does the same comparison automatically, at scale.
1
Every micro-stop is logged with its sensor source, timestamp, and the reading that triggered it.
2
Stops from the same sensor are grouped together instead of treated as isolated events.
3
The grouped pattern is compared against known dead, drift, and intermittent signatures.
4
A root cause flag is raised pointing to the specific sensor, not a generic line stop alert.
Jam root cause analysis then cross-checks mechanical stop signals against the same sensor history, so a genuine jam is not mistaken for a false sensor trip, or the reverse.
Frequently asked questions
What FMCG Plants Ask About Sensor Fault Patterns
How do you tell a sensor fault apart from a genuine mechanical jam?
A genuine jam usually correlates with a physical stop signal and a consistent location on the line, while a sensor fault repeats from the same sensor regardless of whether a real obstruction exists, which pattern analysis can separate automatically.
Walk through a real example with our team.
Can a drifting sensor be caught before it starts affecting quality?
Yes, drift is visible as a trend across days or weeks well before it crosses a threshold that causes a rejected batch, which is why trend monitoring catches it earlier than threshold-based alerts alone.
Ask support about trend alerts for your sensors.
Do we need new sensors to start detecting these patterns?
No, pattern detection works on the readings your existing sensors already produce, since the goal is analyzing the data you already have more carefully rather than replacing working hardware.
Confirm compatibility with your setup on a call.
How quickly can an intermittent fault be confirmed once flagged?
Once a sensor is flagged, confirming the pattern usually takes a short review of recent stop history rather than days of new monitoring, since the fault has typically already repeated enough times to be clearly visible.
Request a pattern review from our team.
Is this approach specific to FMCG lines or does it apply more broadly?
The same three fault patterns show up on most high-speed production lines, but FMCG lines in particular tend to generate enough micro-stops per shift that manual pattern spotting becomes impractical without automated analysis.
Discuss your line specifically with our specialists.
Find the sensor, not just the symptom
Turn Random Stops Into a Clear Sensor Diagnosis
Book a session with iFactory AI to see how micro-stop analytics and jam root cause detection would read your own line's data.