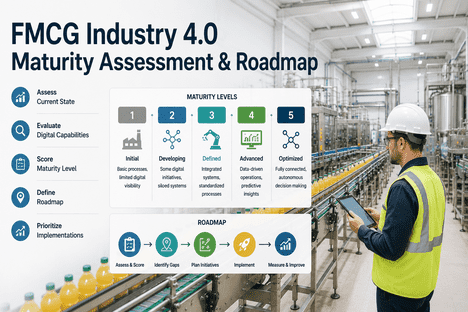
A mid-size FMCG plant running eight production lines across three shifts generates over 2,000 maintenance events, 150 quality deviations, and 40 hours of unplanned downtime every month. Most of that data lives on paper clipboards, whiteboards in the supervisor office, and spreadsheets that are reconciled if at all during the monthly review meeting. The plant manager knows OEE is somewhere around 65 percent. The quality manager knows the last BRC audit had three non-conformances around documentation completeness. The maintenance manager knows the filler line has failed six times this quarter. But none of them can connect these facts into a single coherent picture of the plant's operational health because the data infrastructure that should connect them does not exist. This is not a technology gap. It is a maturity gap and it is the single largest barrier to Industry 4.0 adoption in FMCG manufacturing today. Industry 4.0 maturity in FMCG is measured across five progressive levels from reactive, paper-dependent operations to autonomous, AI-optimised smart factories. The Food and Beverage sector has a Smart Industry Readiness Index variance that is among the widest of any manufacturing vertical, meaning that some plants are already operating at Level 4 while others remain stuck at Level 1 with no structured path forward. The difference between the two is not budget it is a systematic, dimension-by-dimension maturity assessment that identifies where to invest, in what sequence, and against what measurable outcomes. This guide provides a complete framework for assessing your FMCG plant's Industry 4.0 maturity across five critical dimensions, with a scored scoring rubric, a prioritised implementation roadmap, and specific ROI benchmarks for each maturity level.
FMCG DIGITAL MATURITY PLATFORM
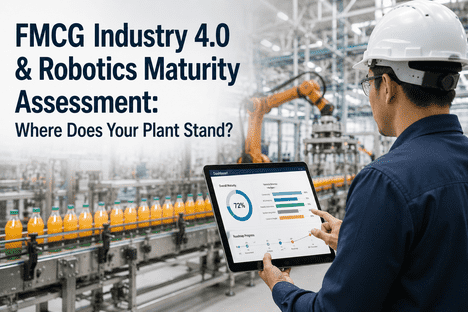
Assess Your FMCG Plant's Industry 4.0 Readiness in Under 2 Hours
iFactory's structured maturity assessment framework scores your plant across 5 dimensions with a prioritised roadmap. Used by 50+ FMCG plants. Results delivered in one business day.
57%
Of FMCG manufacturers cite budget constraints as the primary barrier to Industry 4.0 adoption — yet mature plants show 34% fewer unplanned stoppages
75%
Of FMCG companies report active Industry 4.0 initiatives — fewer than 30% have a phased implementation roadmap with defined milestones
3.2x
Higher ROI in the first 18 months for plants that complete a structured maturity assessment before deploying digital platforms
$290K
Annual value gap per production line between Level 1 plants and Level 5 smart factories — measured in reduced downtime, quality, and labour efficiency
THE FIVE DIMENSIONS OF FMCG INDUSTRY 4.0 MATURITY
What Gets Measured Gets Managed The Maturity Assessment Framework
A credible Industry 4.0 maturity assessment for FMCG manufacturing must evaluate capabilities across five interconnected dimensions each of which must reach a minimum threshold before the next level of digital operations can deliver sustained value. These dimensions are derived from the DREAMY framework (Digital Readiness Assessment Maturity), the Smart Industry Readiness Index (SIRI), and validated against 442 assessments across 125 manufacturing companies in the 2026 Industry 4.0 Maturity Benchmark.
D
Data Infrastructure
IoT sensors, PLC/SCADA feeds, data architecture
Assessment Criteria
IoT sensor coverage on critical assets — target 70%+ for predictive readiness
Real-time data availability with sub-second historian feeds
OT/IT network integration maturity with secure segmentation
Cloud-native data architecture with governance and retention policies
Maturity Indicators
Level 1: No sensors manual data collection on paper
Level 3: 50-70% sensor coverage with structured historian storage
Level 5: 90%+ coverage with AI-ready streaming architecture and digital twin integration
P
Process Standardisation
Digital workflows, SOP compliance, shift consistency
Assessment Criteria
SOP digitisation rate across all production and quality workflows
Shift-to-shift data entry consistency with enforced validation
Corrective action linkage quality — directly tied to triggering events
HACCP and GMP record completeness with digital audit trails
Maturity Indicators
Level 1: Paper-based logbooks HACCP records filed manually
Level 3: Digital SOPs with structured data capture and real-time validation
Level 5: Automated compliance documentation with closed-loop corrective actions
O
Organisational Readiness
Digital culture, analytics ownership, change management
Assessment Criteria
Supervisor dashboard usage and data-driven decision culture
Analytics ownership presence — dedicated digital capability owner
KPI review frequency and structured review cadence
Technology adoption track record and executive sponsorship
Maturity Indicators
Level 1: No analytics ownership — IT-driven projects with limited plant buy-in
Level 3: Plant-level analytics champion with weekly KPI reviews
Level 5: AI-augmented decision culture — operators act on predictive alerts daily
I
Integration Architecture
ERP, MES, LIMS, CMMS connectivity
Assessment Criteria
ERP API openness and bidirectional data synchronisation
MES bidirectional connectivity with real-time production data flows
LIMS integration depth for automated quality data transfer
Network architecture for OT/IT convergence with security
Maturity Indicators
Level 1: Fully air-gapped OT network — manual data re-entry into ERP
Level 3: Bidirectional ERP/MES integration with automated lot traceability
Level 5: Unified OT/IT architecture with real-time synchronisation across all systems
A
AI & Advanced Analytics
Predictive models, machine learning, autonomous decisions
Assessment Criteria
AI use case specificity with defined success criteria and baselines
ROI model quality — quantified business case before deployment
Historical training data availability — 12+ months clean data
Stakeholder alignment and cross-functional governance
Maturity Indicators
Level 1: No AI initiatives — no structured data history for training
Level 3: Pilot AI use case with measured outcomes and defined success metrics
Level 5: Closed-loop autonomous optimisation — AI triggers work orders and adjusts parameters
MATURITY LEVELS AND SCORING FRAMEWORK
Five Levels of FMCG Industry 4.0 Maturity Where Does Your Plant Stand?
The assessment framework assigns a maturity level to each dimension on a 1-5 scale, placing the plant in one of five operational maturity bands. Each dimension is scored on sub-criteria rated 1 (not present) to 5 (fully mature). The aggregate score determines the plant's overall maturity level and generates specific remediation recommendations before progressing to the next stage.
Level 1
Reactive
Score: 0-12
Paper-based operations, siloed data, reactive maintenance, no sensor infrastructure, manual compliance records. OEE below 60%. Unplanned downtime exceeds 15% of available production time.
Priority Actions
Complete IT/OT asset inventory — identify every connected and unconnected asset
Deploy CMMS with digital work orders and preventive maintenance schedules
Implement structured HACCP documentation with digital forms and audit trails
Establish baseline KPIs for OEE, downtime, and quality yield
Design and implement OT network segmentation — isolate production from corporate IT
ROI: Foundation remediation typically reduces reactive maintenance by 25-35% within 6 months
Level 2
Emerging
Score: 13-18
Partial digitisation with inconsistent data capture. Basic KPIs tracked. CMMS deployed but adoption varies across shifts. Some sensor coverage on critical assets. OEE 60-68%.
Priority Actions
Expand IoT sensor deployment to top 20% highest-impact assets — vibration, temperature, current draw
Achieve 85%+ work order digital compliance and 90%+ preventive maintenance checklist completion
Deploy real-time OEE dashboard with live availability, performance, and quality data
Integrate CMMS with shift handover processes — enforce structured digital shift logbooks
Launch change management programme — plant-level digital champion with monthly adoption reviews
ROI: Targeted gap remediation typically improves OEE by 5-8 points within 9 months
Level 3
Structured
Score: 19-24
Digital workflows deployed with enforced data validation. Integrated systems with real-time production visibility. Structured data history enables pilot AI use cases. OEE 68-76%.
Priority Actions
Deploy pilot AI predictive maintenance on the highest-consequence asset — train on 6-12 months of sensor data
Integrate ERP, MES, and CMMS for end-to-end lot traceability under 10 minutes
Implement automated quality data transfer from lab instruments to LIMS and ERP
Activate security monitoring across OT environment with OT-aware SIEM tools
Build formal technology roadmap covering 3-year horizon with defined ROI milestones per phase
ROI: AI pilot deployment typically reduces unplanned downtime by 25-40% on targeted assets within 12 months
Level 4
Advanced
Score: 25-27
Real-time data across all production lines. ML models active with predictive alerts. Cross-system integration complete. Digital twin pilots on critical lines. OEE 76-84%.
Priority Actions
Scale AI predictive maintenance across all critical assets — target 55%+ fault detection before failure
Deploy energy monitoring connected to production data — identify energy-per-unit optimisation opportunities
Integrate supply chain visibility — connect demand sensing with production scheduling
Implement ambient intelligence and environmental monitoring across production areas
Develop digital twin simulation for at least one production line — validate against real operations
ROI: Advanced plants achieve 34% fewer unplanned stoppages and 19% stronger GFSI audit scores than Level 2 peers
Level 5
Predictive / Smart Factory
Score: 28-30
Autonomous optimisation with closed-loop AI. AI-generated work orders with no human triage. Digital twin drives operational decisions. Full OT/IT convergence. OEE above 85%.
Priority Actions
Deploy autonomous mobile robots for continuous inspection patrol on every shift
Implement closed-loop process optimisation AI adjusts machine parameters in real time
Achieve zero-unplanned stoppage targets 72+ hours without unplanned downtime on any single line
Integrate CMMS data fully with ERP, MES, and supply chain no manual data entry anywhere
Continuous model improvement programme with scheduled retraining cadence and drift monitoring
ROI: Smart factory plants show maintenance cost per unit reduced by 40%+ and OEE sustained above 85%
READY TO KNOW YOUR MATURITY LEVEL?
Complete a Structured FMCG Industry 4.0 Assessment in One Business Day
iFactory's assessment team scores your plant across all five dimensions using a validated framework. You receive a dimension-by-dimension score, gap analysis, prioritised remediation plan, and ROI projection for each phase.
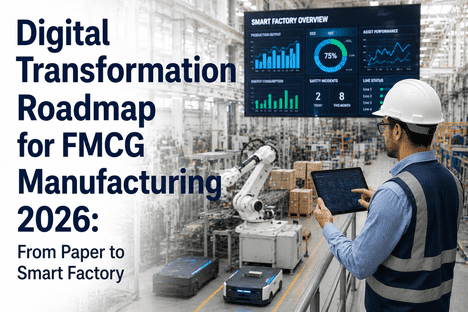
IMPLEMENTATION ROADMAP
Phased Transformation From Paper to Predictive in 30-42 Months
The most effective FMCG digital transformation programs follow a phased architecture that generates measurable ROI at each stage before committing capital to the next avoiding the big-bang deployment trap that has derailed numerous FMCG digitalisation programs. The following roadmap is based on validated implementation sequences across 50+ FMCG plants and is calibrated for mid-size facilities operating 8-14 production lines.
Phase 1
Months 1-6
Foundation & CMMS
Deploy digital CMMS with structured work orders, preventive maintenance schedules, and digital HACCP documentation. Establish baseline KPIs. Achieve 85%+ work order digital compliance and 90%+ checklist completion. Implement network segmentation between IT and OT environments.
Outcome: Reactive maintenance reduced 25-35%. Audit documentation completeness improved 40%+. Baseline OEE established.
Phase 2
Months 7-15
Visibility & IoT
Deploy IoT sensors on top 20% highest-impact assets — vibration, temperature, current draw on motors and drives. Launch real-time OEE dashboard visible on floor screens and supervisor devices. Integrate CMMS with ERP for automated data flows. Implement sensor-to-work-order triggers for condition-based maintenance.
Outcome: Critical asset IoT coverage 80%+. OEE improved 5-8 points. Reactive maintenance below 35%.
Phase 3
Months 16-24
AI & Predictive
Train ML models on 12+ months of Phase 2 sensor data. Deploy AI predictive maintenance on critical assets with 14-21 day fault lead time. Implement AI work order prioritisation ranked by production impact and failure probability. Launch root cause analysis automation for recurring failure patterns.
Outcome: Predictive model catches 55%+ of faults before failure. MTTR reduced 35%+. Reactive maintenance below 20%.
Phase 4
Months 25-36
Autonomous Operations
Deploy digital twin on high-value production lines. Integrate AMR inspection robots for continuous patrol. Implement closed-loop AI optimisation. Achieve full ERP-CMMS-MES integration with no manual data entry. Activate autonomous work order generation from AI anomaly detection.
Outcome: Unplanned downtime below 4%. OEE sustained above 85%. Maintenance cost per unit reduced 40%+.
REAL OUTCOMES FROM FMCG DIGITAL TRANSFORMATION
Measurable Results Across the Maturity Curve
34%
Fewer unplanned stoppages at Level 4 plants vs Level 2 plants
Validated across 442 assessments in 125 manufacturing companies (2026 Benchmark)
3.2x
Higher first-18-month ROI when assessment precedes platform deployment
Readiness-first implementations also go live 40% faster
40%
Reduction in single operation personnel on automated maintenance tasks
Validated across FMCG plants with structured digital workflow deployment
19%
Stronger GFSI audit scores at advanced digital maturity levels
Structured digital HACCP and compliance documentation drives measurable audit improvements
5-8
OEE points improvement from Level 2 to Level 3 maturity progression
Real-time monitoring + structured data capture drives measurable production efficiency gains
$290K+
Annual value per production line from Level 1 to Level 5 transformation
Combined savings from reduced downtime, improved quality, labour efficiency, and energy optimisation
FREQUENTLY ASKED QUESTIONS
What FMCG Manufacturers Ask About Industry 4.0 Maturity
How long does a full Industry 4.0 maturity assessment take?▼
A structured assessment using iFactory's framework takes approximately 2 hours of stakeholder interviews and system walkthroughs, followed by dimension-by-dimension scoring and report generation delivered within one business day. The assessment covers all five dimensions — Data Infrastructure, Process Standardisation, Organisational Readiness, Integration Architecture, and AI & Advanced Analytics — across 25 sub-criteria. Plants seeking to begin the process can schedule their assessment session directly with the team.
What is the minimum maturity level required to deploy AI predictive maintenance?▼
AI predictive maintenance requires a minimum overall assessment score of 19 (Level 3 - Structured) with no individual dimension scoring below 3. Below this threshold, targeted gap remediation should precede AI deployment. The critical prerequisite is 12+ months of clean, structured sensor data from IoT-enabled assets — without this training data foundation, AI models produce unreliable predictions that destroy organisational confidence. Plants at Level 2 can typically reach Level 3 readiness within 4-8 months through focused remediation of data infrastructure and process standardisation gaps.
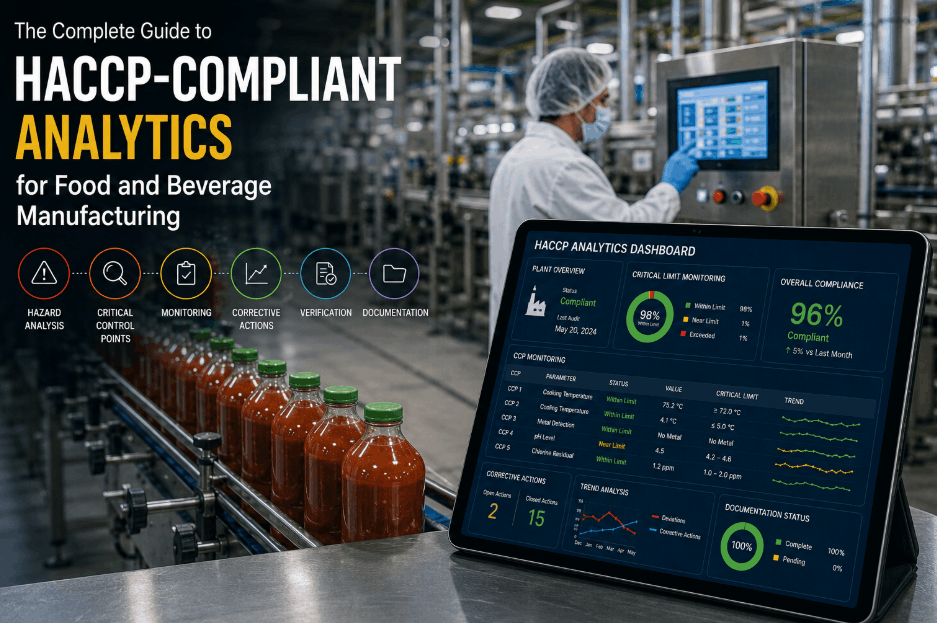
How does Industry 4.0 maturity assessment map to FDA FSMA and BRCGS compliance requirements?▼
The process standardisation and data infrastructure dimensions of the assessment directly map to FSMA Section 204, BRCGS, SQF, and FSSC 22000 documentation requirements. Level 3 maturity (score 19+) typically satisfies all major compliance requirements for digital record-keeping, lot traceability under 10 minutes, and corrective action linkage. Remediating gaps in these dimensions simultaneously closes major audit documentation vulnerabilities. Plants at Level 2 can achieve compliance-ready documentation maturity within 8-12 weeks through structured digital workflow deployment.
What is the typical timeline for progressing from Level 2 to Level 4?▼
A mid-size FMCG plant (8-14 lines) with committed leadership and adequate change management investment typically progresses from Level 2 to Level 4 in 18-24 months. The timeline breaks down as: Phase 1 foundation work (4-6 months), Phase 2 IoT and visibility deployment (6-9 months), and Phase 3 AI and analytics activation (8-12 months). Attempts to compress the timeline below 18 months consistently fail because each phase requires the data foundation and organisational competency built in the previous phase. The critical path is determined by the time required to build 12+ months of clean sensor data history for AI model training, not by technology deployment speed.
How does iFactory's platform support FMCG Industry 4.0 maturity progression?▼
iFactory provides the unified platform layer that connects IoT sensor data, digital workflows, CMMS, AI predictive maintenance, and integration architecture into a single FMCG operations intelligence system — enabling plants to progress from Level 2 to Level 4 without platform switching. The platform is pre-integrated with major ERP systems (SAP, Oracle), MES platforms, and LIMS systems common in FMCG environments. Typical implementation for a Level 2 plant takes 10-14 weeks to reach live operational status on the core CMMS and digital workflow modules, with IoT and AI capabilities added incrementally as the plant's maturity advances. Book a Demo to see the platform configured for your specific FMCG production environment.
FMCG INDUSTRY 4.0 MATURITY PLATFORM
Know Your Maturity Level. Build Your Roadmap. Start Generating ROI.
iFactory provides the structured maturity assessment framework, phased implementation roadmap, and unified digital platform that takes FMCG plants from reactive to predictive. Used by 50+ food and consumer goods manufacturers. Assessed against the 2026 Industry 4.0 Maturity Benchmark.