The average FMCG packaging line runs at 60% OEE meaning 40% of its theoretical output vanishes into downtime, speed losses, and quality defects before a single unit reaches the warehouse. That hidden capacity gap, worth $1.5M–$4M annually per high-speed line, does not require new equipment to recover. World-class FMCG plants reach 85% OEE using the same physical assets the difference is how they measure, analyze, and act on equipment performance data. The six big losses framework breakdowns, changeovers, micro-stops, speed losses, startup rejects, and production defects provides the diagnostic structure. iFactory's platform connects PLC, SCADA, CMMS, and condition monitoring data into a unified intelligence layer that decomposes every loss category and prioritizes improvement actions by financial impact. Book a Demo to see how iFactory turns your equipment data into a live OEE improvement engine across every FMCG production line.
Equipment Efficiency · FMCG · 2026
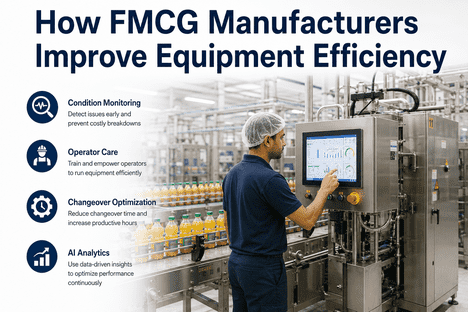
How FMCG Manufacturers Improve Equipment Efficiency
OEE improvement · Condition monitoring · Changeover reduction · Micro-stop elimination · AI analytics for food and consumer goods production equipment performance.
01
60%
Average FMCG plant OEE — 40% of capacity lost to downtime, speed, and quality gaps
02
85%
World-class OEE benchmark — achievable with structured measurement and targeted improvement
03
50%
Of all OEE losses come from breakdowns and changeovers — the highest-leverage improvement targets
04
10–18 pt
Achievable OEE improvement in year one using AI analytics and structured CMMS integration
Why Equipment Efficiency Determines Profitability in FMCG Manufacturing
FMCG manufacturing operates on thin margins where equipment efficiency directly determines profitability. A multi-line snack food plant at 62% OEE versus 78% OEE is not just leaving output on the table it is losing competitive advantage in a market where every percentage point of OEE on a high-speed line is worth $150,000–$350,000 annually in throughput value. The traditional approach manual OEE logs, end-of-shift reports, monthly summaries captures the final number but misses the loss decomposition needed for targeted action. Equipment efficiency improvement requires three foundations: accurate measurement (automated OEE calculation at line and SKU level with correct denominators), root cause analysis (Pareto-based loss categorization identifying the specific 2–3 failure modes driving 60–70% of the gap), and structured execution (SMED changeover programs, condition-based maintenance, and operator autonomous maintenance checklists deployed against the prioritized loss drivers). iFactory's platform provides the digital infrastructure for all three layers — connecting PLC data, CMMS maintenance history, quality inspection outputs, and condition monitoring telemetry into a single equipment intelligence system that drives measurable OEE improvement from day one of deployment.
Six Pillars of FMCG Equipment Efficiency — Where iFactory Drives Measurable Impact
OEE Measurement
Automated OEE·six big losses·Pareto analysis
Foundation
Condition Monitoring
Vibration·thermal·oil·ultrasonic·CBM
Detection
Predictive Maintenance
ML failure prediction·work order automation·CMMS
Prevention
Changeover Reduction
SMED·digital work instructions·sequence optimization
Availability
Micro-Stop Elimination
PLC auto-capture·pattern recognition·root cause fix
Performance
Three Equipment Efficiency Challenges AI Analytics Solves in FMCG Plants
01
Invisible Micro-Stop Losses That Silently Destroy 15–25% of Production Capacity
Micro-stops — stoppages lasting 10–120 seconds from film misfeeds, label jams, product misalignment, and sensor faults — are the most underreported performance loss in FMCG manufacturing. Manual operator logs capture fewer than 30% of sub-5-minute stoppages because individual events seem too trivial to record. Yet a packaging line experiencing 8 micro-stops per hour at 2 minutes each loses over 13% of production time to events that never appear in any report. iFactory's real-time machine monitoring captures every micro-stop automatically through PLC signal integration, timestamps each event, and uses AI pattern recognition to classify micro-stops by root cause — label feed issues, product jamming, reject surges, or sensor faults. This turns invisible losses into a prioritized improvement backlog. First-pass elimination of the top 4–6 micro-stop causes typically recovers 5–8 OEE points within 90 days without any capital investment.
7–15% performance recovery90-day first passZero capital required
02
Unplanned Breakdowns That Consume 50% of Maintenance Budget on Emergency Repairs
Breakdowns and changeovers account for 50% of all OEE losses in FMCG plants. A single hour of unplanned downtime on a high-speed packaging line costs $36,000–$50,000 in lost throughput, with emergency repair costs 4–5× higher than planned interventions. Most FMCG facilities find 80% of unplanned downtime traces back to 5 recurring failure modes — bearing failures on filler drives, seal degradation on packaging machines, conveyor motor overheating, CIP valve malfunctions, and gripper wear. iFactory's predictive maintenance platform integrates vibration sensors, thermal cameras, and motor current analysis into ML models that detect developing degradation 4–12 weeks before failure. When a fault signature is detected, the platform auto-generates a work order with the equipment location, predicted failure mode, and recommended intervention — converting emergency breakdowns into planned, scheduled events with zero production impact.
4–12 week lead time40–60% downtime reduction5 recurring failure modes
03
Changeover Inefficiency Wasting 15–25% of Available Production Time Across Multiple SKUs
FMCG plants running hundreds of SKUs across shared production lines face changeover losses that consume 15–25% of total available production time. Plants without structured SMED programs average 45-minute changeovers, and SKU proliferation has driven 3–5× more changeovers than a decade ago. iFactory's AI changeover optimization analyzes historical changeover sequences, tooling times, and operator execution patterns to identify the fastest achievable changeover path for each product transition. The platform recommends optimal scheduling sequences that minimize total changeover time across the production plan, while digital work instructions displayed at the machine guide operators through standardized, mistake-proof changeover procedures. Continuous improvement algorithms identify which changeover steps account for the most variability, focusing improvement efforts where they have the greatest OEE impact. Professional SMED programs using iFactory routinely cut FMCG changeover time by 30–50%.
30–50% changeover reduction3–5× more SKU transitionsDigital work instructions
How iFactory Connects Equipment Data to OEE Improvement Actions
iFactory is the AI software intelligence layer that integrates with existing FMCG plant infrastructure — PLC and SCADA systems from Siemens, Rockwell, Schneider, and B&R; vibration monitoring systems from Bently Nevada, Pruftechnik, and SPM; thermal cameras and IR sensors; CMMS platforms including SAP, Oracle, and Infor EAM; and quality inspection systems. The platform requires zero new hardware investment — it connects to the telemetry and data sources already deployed on your filling, packaging, labeling, and palletizing lines. The Shift Logbook captures operator shift reports, defect tags, and maintenance notes alongside the sensor stream, creating a unified data fabric for equipment efficiency analysis and AI-driven improvement targeting across every production asset.
Availability
PLC states·downtime logs·CMMS history·sensor health
Breakdown prediction·changeover optimization·SMED standardization
5–8% availability gain
Performance
PLC cycle time·micro-stop capture·speed vs rated·vibration
Micro-stop root cause·speed loss correlation·Pareto prioritization
4–7% performance gain
Quality
Vision inspection·reject counts·SPC·process parameters
Defect mode correlation·startup reject optimization·process drift alerts
2–4% quality gain
Maintenance
Vibration·thermal·oil analysis·motor current·acoustic
Condition-based PM·failure prediction·auto work order generation
40–60% downtime reduction
Equipment Efficiency Improvement Use Cases Across FMCG Production
FMCG packaging lines lose 15–25% of capacity to micro-stops under 5 minutes that traditional reporting misses entirely. iFactory captures every machine state change through PLC signal integration, timestamping each stop and using AI pattern recognition to classify by root cause — film misfeed, product jam, sensor fault, or reject surge. The Pareto-ranked loss output tells operators and maintenance exactly which 4–6 causes to eliminate first, with first-pass fixes typically recovering 5–8 OEE points within 90 days. Every micro-stop event traces back to the PLC, sensor, and shift log data that triggered the classification.
Recovery5–8 OEE points in 90 days
Capture Rate100% of sub-5-min stops
Book a Demo
Filler bearing failures and seal degradation are the leading mechanical causes of unplanned filling line downtime, with each failure event costing $18,000–$45,000 in emergency repair costs and lost production. iFactory monitors filler vibration spectra, bearing temperature trends, motor current draw, and seal acoustic signatures, comparing all readings against equipment-specific baselines. When a developing fault is detected — typically 4–12 weeks before failure — iFactory auto-generates a prioritized work order with the fault type, recommended action, and required parts, allowing maintenance teams to schedule the intervention during planned downtime. The platform logs every prediction event with full traceability to the sensor data that triggered the alert.
Lead Time4–12 weeks
Reduction40–60% unplanned stops
Talk to an Expert
FMCG plants executing 3–5× more changeovers than a decade ago lose 15–25% of available production time to product transitions. iFactory's AI analyzes historical changeover data across operators, shifts, and SKU transitions to identify the fastest achievable path for each product pair. Digital work instructions at the machine guide operators through standardized, mistake-proof sequences while the platform tracks each changeover phase in real time against the optimized baseline. Continuous improvement algorithms identify which steps — tooling swaps, parameter adjustments, first-article inspection — account for the most variability, targeting coaching and standardization where they deliver the highest OEE return. Professional SMED programs using iFactory routinely cut changeover time by 30–50%.
Reduction30–50% changeover time
MethodAI-optimized sequences + digital work instructions
Traditional end-of-line sampling misses defects between inspection intervals, allowing defective product to reach packaging before detection. iFactory integrates AI vision inspection at critical points — label placement, fill level, seal integrity, carton closure — inspecting 100% of output at line speed with deep learning models achieving 99.5%+ defect detection accuracy. When defect rates exceed pre-set thresholds, iFactory automatically triggers a machine halt and notifies quality and maintenance teams with the defect classification, location, and photographic evidence. The system correlates defect patterns with upstream process parameters — fill pressure, sealing temperature, label tension — enabling operators to adjust root causes rather than sort defective output.
Inspection100% output at line speed
Accuracy99.5%+ defect detection
What iFactory Delivers for FMCG Equipment Efficiency Programs
10–18
OEE points recovered in year one on monitored production lines
Measurable throughput gain without capital equipment investment
40–60%
Reduction in unplanned downtime from condition-based maintenance
Predictive alerts vs reactive emergency response
30–50%
Changeover time reduction using AI-optimized SMED programs
Digital work instructions and sequence optimization
$1.5–3.5M
Recovered throughput value per high-speed line in year one
Based on published FMCG OEE improvement benchmarks
FAQ
How does iFactory measure OEE without replacing existing PLC and SCADA systems?
iFactory connects to existing PLC, SCADA, and MES infrastructure via OPC-UA, Modbus, MQTT, and REST APIs — no hardware replacement required. The platform ingests machine state signals, cycle times, fault codes, and production counts from your current control systems, then calculates OEE automatically using correct denominators (planned production time with changeovers and CIP included).
Book a Demo for a facility-specific data readiness assessment and integration roadmap.
What is the typical timeline from deployment to measurable OEE improvement in an FMCG plant?
Initial data integration and baseline OEE establishment takes 30–60 days. The first measurable improvements from micro-stop elimination and PM workflow refinement typically appear within 90–120 days. First-pass elimination of the top 4–6 micro-stop causes commonly delivers 5–8 OEE points within 90 days. Full plant-wide impact compounds over 12–18 months as predictive models mature and improvement actions accumulate across all loss categories.
Does iFactory provide vibration sensors, thermal cameras, and other condition monitoring hardware?
iFactory is the AI software intelligence layer — not a sensor manufacturer. The platform integrates with existing condition monitoring hardware from vendors including Bently Nevada, Pruftechnik, SPM, Fluke, and any IIoT sensor vendor supporting MQTT, OPC-UA, or REST API. Your facility selects the sensor technology and telemetry hardware that matches your asset failure modes and budget; iFactory turns the data into predictive alerts, auto-generated work orders, and OEE improvement intelligence.
How does iFactory help reduce changeover time without changing the physical equipment on the line?
Changeover time reduction comes from process standardization and sequence optimization — not mechanical modification. iFactory analyzes historical changeover data across operators, shifts, and SKU transitions to identify the fastest achievable path for each product pair. Digital work instructions at the machine eliminate operator variation, while real-time changeover phase tracking reveals which steps consistently consume excess time. Plants using this approach routinely achieve 30–50% changeover reduction without modifying any equipment, simply by executing the best-known method every time.
Deploy iFactory for AI-Driven FMCG Equipment Efficiency Improvement
iFactory's manufacturing operations platform provides FMCG production managers with the digital infrastructure to measure, analyze, and improve equipment efficiency across every production line — connecting PLC data, condition monitoring telemetry, CMMS maintenance history, and quality inspection outputs into a unified intelligence system that drives 10–18 points of OEE improvement in year one. Pre-built FMCG templates deploy in weeks, not months, using your existing control infrastructure.
OEE Analytics
Condition Monitoring
Predictive Maintenance
SMED Changeover
Micro-Stop Elimination