Multi-plant FMCG analytics standardization is redefining how large food and beverage corporations manage performance across distributed manufacturing networks. When analytics processes, KPI definitions, and data architectures differ from facility to facility, corporate leadership operates blind — unable to benchmark plants fairly, identify systemic inefficiencies, or execute enterprise-wide quality strategies with confidence. For FMCG corporations running five, fifteen, or fifty production sites, standardized analytics is not a technical preference — it is the operational foundation that separates market leaders from reactive manufacturers. This guide breaks down what true multi-site analytics standardization looks like, why it matters for FMCG portfolio performance, and how to build a centralized analytics framework that scales across every plant in your network.
Standardize Analytics Across Every Plant in Your FMCG Network
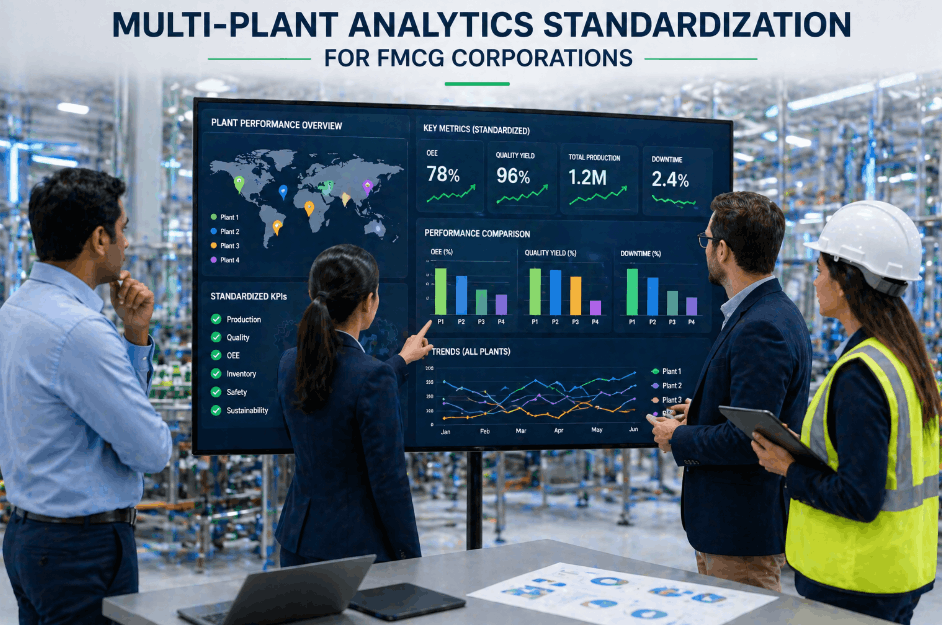
iFactory's centralized analytics platform delivers unified KPI dashboards, standardized FMCG reporting, and AI-driven portfolio intelligence — purpose-built for multi-site food and beverage corporations.
Why Multi-Plant FMCG Operations Struggle Without Standardized Analytics
In most FMCG corporations, analytics capabilities evolve plant by plant — each facility inheriting its own ERP configuration, quality management logic, and KPI reporting cadence. Over time, this fragmentation compounds into a portfolio-wide visibility problem. Corporate teams attempting to compare OEE across plants discover that Plant A measures availability differently from Plant B. Quality yield figures carry different denominators. Downtime categories are classified inconsistently. The result is a reporting environment where consolidation exercises consume weeks of analyst time and still produce numbers that cannot be trusted for strategic decisions.
FMCG corporations that book a demo with iFactory consistently describe the same discovery: their existing plant data contains rich performance intelligence, but the lack of a standardized analytics layer means that intelligence never reaches the corporate decision layer. Standardizing multi-plant FMCG analytics is not about replacing plant-level systems — it is about imposing a common intelligence framework on top of them.
Inconsistent KPI Definitions
When OEE, yield, and throughput are calculated differently across plants, corporate benchmarking produces misleading comparisons. Standardized KPI libraries ensure every metric carries the same definition, formula, and data source across every facility in the portfolio.
Siloed Plant-Level Reporting
Plant managers optimize local reports for local audiences. Without a corporate analytics layer, portfolio-level patterns — cross-plant waste trends, shared supplier risk exposure, category-level quality deviations — remain invisible to the teams who can act on them.
Manual Consolidation Cycles
Corporate analytics teams in multi-plant FMCG environments frequently spend 60–80% of reporting cycles consolidating and reconciling plant data rather than analyzing it. Standardized pipelines eliminate reconciliation work and redirect analyst capacity toward insight generation.
Delayed Portfolio Decisions
When multi-site analytics data arrives in weekly or monthly cycles, corporate operations decisions are always behind the curve. Real-time standardized analytics across the plant network compress decision latency from days to hours — enabling proactive portfolio management at scale.
Building a Centralized FMCG Analytics Framework Across Multiple Plants
A mature multi-plant FMCG analytics standardization framework operates across three distinct layers: a unified data ingestion layer that normalizes inputs from heterogeneous plant systems; a standardized metrics engine that applies common KPI logic to every facility's data stream; and a corporate intelligence layer that surfaces cross-plant benchmarks, portfolio trends, and predictive risk signals to leadership. FMCG corporations that schedule a demo typically find that their existing data infrastructure can support this architecture without full system replacement — standardization is applied as an integration layer, not a rip-and-replace exercise.
Standardized KPI Libraries: The Foundation of Cross-Plant Benchmarking
The first and most critical step in multi-plant analytics standardization is establishing a corporate KPI library — a governed set of metric definitions, calculation rules, and data source mappings that applies uniformly across every facility. This library covers production efficiency metrics (OEE, throughput rate, cycle time), quality metrics (first-pass yield, defect rate, CAPA cycle time), safety metrics, and supply chain performance indicators. When every plant calculates OEE using the same formula and the same downtime taxonomy, portfolio benchmarks become actionable rather than approximate.
Unified Data Pipelines: Connecting Heterogeneous Plant Systems
FMCG multi-site environments rarely share a common technology stack. One plant may run SAP, another Oracle, a third a legacy MES with no API layer. Centralized FMCG analytics platforms address this through pre-built connectors and data normalization middleware — ingesting data from PLC, SCADA, ERP, LIMS, and WMS systems across all plants and transforming it into a standardized data model before analytics processing begins. The standardization happens at the platform layer, not in each plant's local systems.
Corporate KPI Dashboards for Multi-Plant FMCG Performance Management
A standardized multi-plant FMCG analytics platform delivers three distinct dashboard tiers designed for different organizational audiences. FMCG corporations exploring this architecture can request a demo and receive a portfolio-specific dashboard design session that maps these tiers to their specific reporting structure.
| Dashboard Tier | Primary Audience | Key Metrics Displayed | Update Frequency | Strategic Value |
|---|---|---|---|---|
| Portfolio Executive View | C-Suite, VP Operations | Portfolio OEE, Quality Index, COGS variance, Sustainability KPIs | Daily / Real-time | Enterprise strategy and investment decisions |
| Regional Operations View | Regional Directors, Category Managers | Plant benchmarks, Cross-facility waste, Throughput rankings, Capacity utilization | Real-time | Regional performance management and resource allocation |
| Plant Manager View | Plant Managers, Quality Leads | Line-level OEE, Shift performance, CAPA status, Downtime Pareto | Real-time / Shift | Operational improvement and compliance management |
| Quality & Compliance View | Quality Directors, Regulatory Affairs | Defect rates, Hold inventory, Supplier risk scores, Audit readiness index | Real-time | Risk management and regulatory compliance |
| Supply Chain View | Supply Chain, Procurement | Supplier performance, Inbound quality, Inventory turns, Lead time variance | Daily | Supply chain optimization and vendor management |
AI-Powered Multi-Plant Analytics: From Standardization to Predictive Intelligence
Standardized data and unified KPIs create the foundation — but the competitive advantage in multi-plant FMCG analytics comes when AI models are applied to the standardized data stream. When performance data from forty plants flows through a common analytics layer, machine learning models can identify cross-facility patterns that no human analyst could detect: shared equipment failure signatures appearing weeks before downtime events, quality deviation clusters correlated with specific supplier batches, or throughput degradation patterns that emerge at certain production volumes across multiple sites. FMCG operations teams that book a demo typically describe seeing their portfolio's hidden performance patterns mapped for the first time as a defining moment in their analytics strategy.
Cross-Plant Benchmarking and Best Practice Identification
One of the highest-value applications of standardized multi-plant FMCG analytics is systematic best practice identification. When every plant's performance data is expressed in common KPI terms, AI models can identify which facilities consistently outperform the portfolio average — and more importantly, which specific process parameters, scheduling patterns, or maintenance practices drive that outperformance. Corporate operations teams can then extract these practices systematically and deploy them as standard operating procedures across the underperforming facilities. This best-practice propagation flywheel is only possible when data is truly standardized across the network.
Portfolio-Level Waste and Cost Intelligence
Standardized multi-site analytics surfaces waste patterns that are invisible at the plant level. A 0.8% yield gap that appears minor at a single facility translates to millions in COGS impact when multiplied across a twenty-plant network. Centralized FMCG analytics platforms calculate portfolio-wide waste exposure in real time — quantifying the financial impact of closing the gap between the best-performing plant and the network average. This portfolio waste intelligence is one of the most compelling ROI drivers that FMCG corporations find when they explore the platform for the first time.
Portfolio OEE Normalization Across Filling Lines
Multi-site beverage corporations deploy standardized analytics to normalize OEE measurement across different filling technologies and line configurations — enabling true cross-facility benchmarking and best-practice deployment at category scale.
Centralized Quality Index and Shelf Life Analytics
Dairy FMCG corporations use standardized portfolio analytics to build a centralized quality index — tracking first-pass yield, hold rates, and shelf life performance across all plants within a single dashboard, with AI alerting for emerging quality trends before they reach the complaint stage.
Changeover Efficiency and SKU Proliferation Analytics
High-SKU FMCG corporations apply standardized analytics to benchmark changeover efficiency across plants — identifying facilities where changeover performance is compressing available production time and quantifying the capacity recovery opportunity from standardizing changeover processes.
Multi-Plant FMCG Analytics Standardization: A Three-Phase Deployment Roadmap
Deploying standardized analytics across a multi-plant FMCG network requires a phased approach that manages data quality, system integration complexity, and organizational change simultaneously. Corporations that attempt to standardize all plants simultaneously typically encounter data governance bottlenecks that delay value realization by 12–18 months. A phased rollout — beginning with a pilot cohort of plants and expanding systematically — consistently delivers faster time-to-value and higher adoption rates.
Analytics Governance Foundation and KPI Standardization
Establish a corporate analytics governance structure: define the standard KPI library, document metric calculation rules, and map data sources across all facilities. Conduct a data readiness assessment at each plant to identify integration gaps before platform deployment begins. This phase eliminates the definitional inconsistencies that undermine multi-plant benchmarking.
Pilot Cohort Integration and Centralized Dashboard Activation
Deploy the standardized analytics platform across a pilot cohort of three to five representative plants — typically including the highest-performing and lowest-performing facilities to maximize benchmark contrast. Integrate plant data systems, activate the standardized metrics engine, and launch corporate KPI dashboards. Validate benchmark accuracy before scaling to the full portfolio.
Full Portfolio Rollout and AI Intelligence Activation
Extend the standardized analytics layer to the full plant network, activate AI-driven cross-plant performance models, and integrate corporate analytics outputs with ERP and planning systems. Launch automated corporate reporting, portfolio waste intelligence, and predictive risk alerts. The platform's accuracy improves continuously as it accumulates standardized performance data across the full facility portfolio.
The Financial Case for Multi-Plant FMCG Analytics Standardization
The ROI of standardized multi-plant FMCG analytics operates across four distinct value streams. FMCG corporations building a business case find that the financial argument is compelling across all four dimensions — and that the investment required is modest relative to the portfolio-wide value at stake. Those ready to build a plant-specific ROI model can book a demo and walk through a structured expected-value analysis in under an hour.
OEE Gap Closure Across the Portfolio
For a ten-plant FMCG network, closing a 3-percentage-point OEE gap between the best and average plant through standardized best-practice deployment typically generates $8M–$22M in annual production capacity value — without capital investment. This is the primary ROI driver for most standardized multi-plant analytics deployments.
Quality Cost Reduction at Portfolio Scale
Standardized cross-plant quality analytics identifies systemic yield gaps and recurring defect categories that plant-level reporting misses. FMCG corporations that deploy portfolio quality intelligence typically achieve 15–25% reductions in total quality costs within 18 months of deployment — driven by root cause visibility that only cross-plant data comparison can provide.
Analytics Labor Efficiency
Large FMCG corporations managing multi-plant reporting often employ five to fifteen analysts dedicated to data consolidation and reconciliation. Standardized automated pipelines eliminate this consolidation overhead — redirecting analyst capacity from data wrangling to strategic insight delivery and freeing significant labor cost from the corporate analytics function.
Multi-Plant FMCG Analytics Standardization — Frequently Asked Questions
What does analytics standardization mean in a multi-plant FMCG context?
Analytics standardization means establishing common KPI definitions, data collection rules, calculation logic, and reporting structures that apply uniformly across every plant in the FMCG portfolio. It ensures that OEE at Plant A means exactly the same thing as OEE at Plant Z — enabling fair benchmarking, accurate portfolio reporting, and evidence-based best-practice deployment across the entire manufacturing network.
Does standardizing analytics require replacing existing plant-level systems?
No. Best-practice multi-plant FMCG analytics standardization is implemented as an integration and normalization layer above existing plant systems — whether those are SAP, Oracle, legacy MES platforms, or bespoke ERP configurations. The standardization happens in the analytics platform, not in each plant's operational systems. This approach minimizes deployment risk and dramatically reduces implementation timelines.
How long does it take to deploy standardized analytics across a multi-plant FMCG network?
A pilot cohort of three to five plants typically achieves live standardized benchmarks within 10–18 weeks. Full portfolio deployment across a fifteen to forty-plant network typically completes within six to twelve months, depending on data infrastructure maturity and system integration complexity. Pre-deployment data readiness assessments significantly reduce integration time at each facility.
What KPIs should a centralized FMCG analytics platform standardize first?
The highest-priority KPIs for initial standardization are OEE (Overall Equipment Effectiveness), first-pass yield, downtime categorization, and quality defect rate — as these drive the most significant benchmarking value and are most frequently defined inconsistently across plants. Secondary priorities include changeover time, waste rate, energy intensity, and supplier quality scores. The specific prioritization depends on the corporation's strategic objectives and current pain points.
How does AI add value to standardized multi-plant FMCG analytics?
Once data is standardized across the portfolio, AI models can identify cross-facility performance patterns that are invisible to human analysts — including shared equipment failure precursors, correlated quality deviations, and best-practice performance signatures. AI also enables predictive analytics: forecasting which plants are trending toward quality or throughput issues before they materialize, allowing corporate teams to intervene proactively rather than reactively.
What is the typical ROI payback period for multi-plant FMCG analytics standardization?
Most FMCG corporations achieve full investment payback within 10–16 months, primarily driven by OEE improvement through best-practice propagation and quality cost reduction through portfolio-level defect root cause analysis. For large networks with significant OEE variance between plants, payback periods under 12 months are common, with five-year ROI multiples typically ranging from 8× to 15×.
Deploy Standardized Analytics Across Your Entire FMCG Plant Network
iFactory's multi-plant FMCG analytics platform delivers unified KPI dashboards, AI-driven portfolio intelligence, and automated cross-facility benchmarking — purpose-built for food and beverage corporations managing multiple manufacturing sites.