
Food and beverage manufacturers operating at scale face a strategic inflection point in 2025: choosing between preventive and predictive analytics for FMCG is no longer an abstract technology debate — it is a direct determinant of production uptime, food safety compliance, and operational cost structure. This guide breaks down both analytics approaches, compares their cost implications, and outlines the hybrid FMCG analytics strategy that leading consumer goods plants are deploying today to outperform on OEE, reduce unplanned stoppages, and future-proof their maintenance operations.
What Is Preventive Analytics in FMCG Manufacturing?
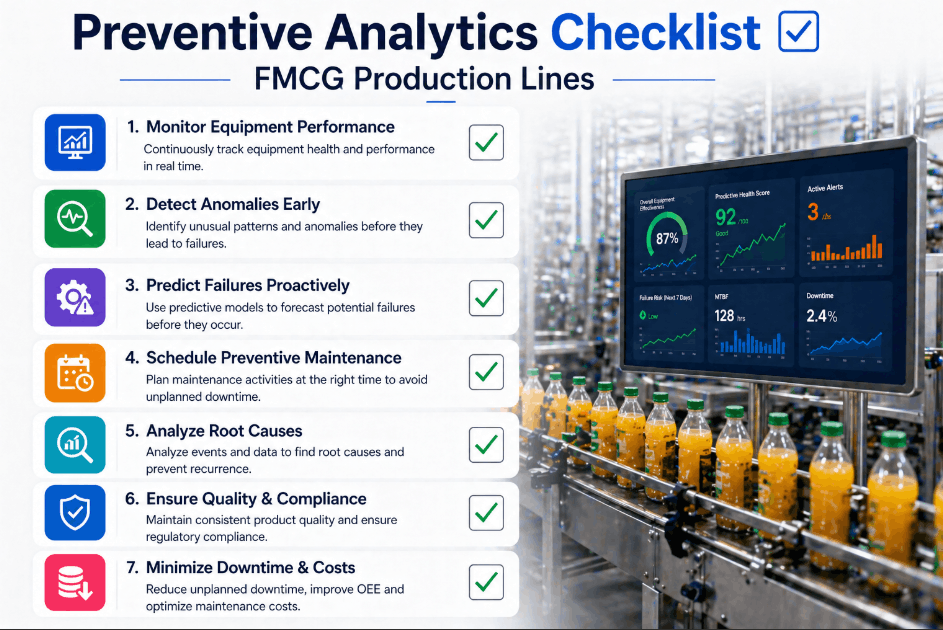
Preventive analytics in FMCG — also called preventive maintenance (PM) — is a calendar-driven or usage-triggered approach to equipment servicing. Assets are inspected, lubricated, or replaced at fixed intervals regardless of their actual operating condition. For decades, this was the industry standard in food processing, dairy, bakery, and beverage production. The logic is straightforward: schedule maintenance before the failure window, and you prevent unplanned downtime.
The challenge is that fixed-interval schedules are systematically wrong for a significant portion of your asset population at any given time. Some assets are over-maintained — generating unnecessary planned downtime and PM labor costs. Others are under-maintained — intervals set too wide for actual stress loads, allowing degradation to accumulate silently until failure. In high-throughput FMCG environments where production schedules change weekly and ingredient viscosity, run speed, and CIP frequency vary dramatically, calendar-based PM is a structural liability.
How It Works in Food Plants
Fixed-interval servicing based on calendar schedules (weekly, monthly, quarterly). Maintenance windows are pre-scheduled regardless of equipment condition. Standard checklists are applied uniformly across asset classes. Post-service sign-off is manual with no condition re-check.
How It Works in Food Plants
Condition-triggered servicing based on real-time sensor data, historian analysis, and AI failure pattern models. Maintenance windows are scheduled dynamically at lowest-impact production periods. Intervention scope is calibrated to the actual degradation profile of the specific asset.
Preventive vs Predictive Analytics for FMCG: The Core Comparison
Understanding the practical difference between PM and PdM (predictive maintenance analytics) in FMCG requires examining five operational dimensions that directly affect plant performance: interval accuracy, food safety risk, maintenance labor efficiency, spare parts cost, and unplanned downtime rate. Book a demo to model this comparison against your own facility's maintenance history and asset configuration.
| Comparison Dimension | Preventive Analytics (PM) | Predictive Analytics (PdM) | FMCG Impact |
|---|---|---|---|
| Interval Determination | Fixed calendar or usage hours | Dynamic — triggered by condition data | High Uptime Gain |
| Food Safety Risk Window | Failure can occur between PM intervals | Failure signatures detected 24–72 hrs early | Critical Reduction |
| Maintenance Labor Cost | Fixed regardless of asset condition | Scoped to actual degradation — 15–25% lower | Cost Savings |
| Spare Parts Spend | Emergency sourcing on unplanned events | Pre-staged from predictive lead time | High Savings |
| Unplanned Downtime Rate | Baseline — reactive to failures | 30–45% reduction vs PM-only baseline | Transformational |
| Implementation Complexity | Low — schedule-based, no sensor dependency | Medium — requires data infrastructure | Manageable |
| ROI Timeline | Immediate — no deployment cost | Measurable within 30–45 days of go-live | Fast Payback |
Food Safety Implications: Why the Analytics Approach Matters in FMCG
In consumer goods manufacturing — particularly food and beverage — equipment reliability is not just an OEE metric. It is a food safety control. A failed CIP pump mid-cycle, a refrigeration compressor that drops temperature during a cold-chain processing run, or a seal failure on an aseptic filler each carry regulatory and consumer safety implications that extend far beyond the mechanical repair itself. Book a demo to see how predictive analytics for food manufacturing reduces food safety incident exposure by eliminating the detection gap between PM intervals.
The PM Interval Gap Problem in Food Processing
Preventive maintenance schedules create fixed windows of risk. Between PM events, asset degradation is invisible to the maintenance system. In food manufacturing environments where regulatory audits, HACCP plans, and SQF certifications demand continuous equipment integrity, the interval gap is a structural food safety vulnerability. Industry data shows that 62% of food plant equipment failures had a detectable precursor signal 24–72 hours before failure — a window that calendar-based PM cannot capture.
Predictive Analytics Closes the Safety Detection Gap
AI-driven predictive analytics for FMCG monitors equipment condition continuously — not just at scheduled intervals. Sensor deviations that precede seal failures, bearing degradation patterns on CIP pumps, and temperature drift anomalies in refrigeration systems are detected and escalated before they cross the threshold into food safety incidents. Plants implementing predictive analytics report a significant reduction in food safety-related downtime events tied to equipment failure.
Regulatory Audit Readiness and Analytics Documentation
AI-driven predictive analytics platforms generate automatic audit trails — timestamped alert records, technician acknowledgement logs, and resolution documentation — that directly support BRC, SQF, and FSMA compliance reporting. Calendar-based PM systems generate maintenance records; predictive analytics systems generate evidence of continuous equipment health monitoring, which represents a substantially stronger compliance position during regulatory audits.
Cost Analysis: Preventive vs Predictive Analytics Strategy in FMCG
The cost comparison between preventive and predictive analytics methods for consumer goods manufacturing is more nuanced than a simple capital-versus-operating expense framing. Both approaches carry total cost of ownership implications that span maintenance labor, spare parts logistics, planned downtime duration, and the fully-loaded cost of unplanned events. Understanding where each analytics method creates and destroys value is essential for building a defensible business case for investment. Book a demo to run this cost model against your plant's own downtime history.
Maintenance Labor Efficiency
Preventive analytics generates fixed labor costs regardless of asset condition. Predictive analytics scopes maintenance tasks to actual degradation profiles — reducing over-maintenance labor by 15–25% while eliminating the reactive overtime generated by unplanned failures.
Spare Parts and Inventory Carrying Cost
PM-driven spare parts management is reactive — parts are ordered after failure confirmation. Predictive analytics converts 36–72 hours of failure lead time into pre-staged parts at line-side kitting locations, eliminating emergency freight and reducing inventory carrying cost through demand signal accuracy.
Planned vs Unplanned Downtime Duration
Planned PM downtime is scheduled but often over-scoped. Unplanned downtime carries a cost multiplier of 3–5× planned downtime due to recovery scheduling, overtime, and throughput loss. Predictive analytics reduces unplanned events while compressing planned maintenance windows to lowest-impact production periods.
The Hybrid FMCG Analytics Strategy: Combining PM and PdM for Maximum ROI
The most effective FMCG analytics strategy in 2025 is not a wholesale replacement of preventive maintenance with predictive analytics — it is a structured hybrid approach that applies the right analytics method to the right asset class based on failure mode characteristics, sensor data availability, and production impact. Book a demo to map this hybrid analytics framework to your specific facility's asset population and maintenance budget constraints.
Best Analytics Strategy for Food Manufacturing: Implementation Roadmap
Transitioning from a purely preventive analytics approach to a hybrid PM-PdM model in FMCG requires a structured implementation sequence. Plants that achieve 35–45% reductions in unplanned downtime consistently follow a phased deployment that prioritizes highest-impact assets first, builds model accuracy before expanding coverage, and integrates predictive outputs with existing CMMS and dispatch workflows rather than replacing them. The roadmap below outlines the standard deployment phases that deliver measurable results within 30–60 days of go-live on priority assets.
Data Infrastructure Assessment and Asset Tiering
Audit existing SCADA historian, CMMS work order history, and condition monitoring sensor coverage across the asset population. Classify all assets into the four-tier analytics strategy framework. Identify data gaps on Tier 1 critical assets and prioritize sensor deployment or historian integration accordingly.
Predictive Model Deployment on Tier 1 Assets
Deploy AI-driven predictive analytics models on critical asset classes — aseptic fillers, packaging line drives, CIP systems, refrigeration compressors. Configure alert escalation logic, integrate with CMMS dispatch workflows, and establish spare parts pre-staging protocols linked to failure probability outputs.
PM Schedule Optimization Across Tier 2 and 3 Assets
Replace fixed-interval PM schedules with condition-informed intervals on Tier 2 assets. Reschedule all PM windows to lowest-production-impact periods identified from production schedule data. Implement post-PM automated condition re-checks on assets where sensor coverage permits validation.
Model Learning, RCA Integration, and Coverage Expansion
Feed resolution findings from work order closures back into predictive models to improve failure pattern detection accuracy. Expand predictive analytics coverage to additional asset classes as model accuracy improves. Integrate AI-driven root cause analysis findings into PM interval and scope optimization for recurring failure modes.
FMCG Analytics Methods: Frequently Asked Questions
Plant and operations managers evaluating PM vs PdM analytics decisions for their consumer goods facilities consistently raise the same operational and financial questions. The answers below reflect implementation experience across beverage, dairy, bakery, and protein processing environments.
Can FMCG plants implement predictive analytics without replacing their existing CMMS?
Yes. Best-in-class predictive analytics platforms for food manufacturing connect to existing CMMS infrastructure — SAP PM, Maximo, Infor EAM, or custom systems — and push work orders and alert escalations through existing workflows rather than replacing them. The predictive layer augments CMMS with condition intelligence; it does not require a system replacement as a prerequisite for deployment.
What is the realistic ROI timeline for predictive analytics in FMCG vs preventive-only?
Plants that transition from PM-only to a hybrid predictive analytics strategy typically see initial measurable gains — 15–20% unplanned downtime reduction — within the first 60 days of deployment on priority assets. Full 35–45% reduction benchmarks are achieved within 9–18 months as predictive models accumulate resolution data and improve failure pattern detection accuracy across the full asset population.
How does the analytics approach decision affect FMCG food safety compliance?
Predictive analytics provides a substantially stronger food safety compliance position than calendar-based PM alone. Continuous condition monitoring eliminates the interval detection gap that PM creates. Automated alert and escalation documentation generates audit-ready records of proactive equipment health monitoring that directly supports BRC, SQF, FSMA, and HACCP compliance reporting requirements.
What data infrastructure is required to implement predictive analytics for food manufacturing?
At minimum: a SCADA historian with 12+ months of operational data and a CMMS with work order history. Plants with vibration sensors, thermal cameras, or motor current monitoring on critical assets significantly accelerate model accuracy timelines. Facilities without existing sensor coverage on priority assets can begin with thermal and vibration spot-checks integrated with historian data while sensor deployment is phased in.
Is a hybrid analytics strategy better than full predictive analytics conversion for FMCG?
For most FMCG facilities, a structured hybrid approach delivers higher ROI than attempting full PdM conversion across all assets simultaneously. Not every asset class has detectable precursor failure signatures, and not every asset justifies the investment in predictive model deployment. Tiering assets by criticality, failure mode detectability, and production impact — and applying the right analytics method to each tier — maximizes return on reliability investment across the full facility.


![predictive-analytics-roi-calculator-for-fmcg-[free-tool]](./manage-post-2k26/uploads/predictive-analytics-roi-calculator-for-fmcg-[free-tool].png)